You are not logged in.
This means you
CAN ONLY VIEW reports that were published prior to Thursday, March 20, 2025.
You
MUST UPGRADE YOUR MEMBERSHIP if you want to see any current reports.
AFTER MARKET UPDATE - FRIDAY, SEPTEMBER 15TH, 2023
Previous After Market Report Next After Market Report >>>
|
|
|
|
DOW |
-288.87 |
34,618.24 |
-0.83% |
|
Volume |
3,438,078,400 |
+274% |
|
Volume |
8,525,702,700 |
+75% |
|
NASDAQ |
-217.72 |
13,708.33 |
-1.56% |
|
Advancers |
947 |
34% |
|
Advancers |
1,539 |
36% |
|
S&P 500 |
-54.78 |
4,450.32 |
-1.22% |
|
Decliners |
1,873 |
66% |
|
Decliners |
2,766 |
64% |
|
Russell 2000 |
-19.60 |
1,847.03 |
-1.05% |
|
52 Wk Highs |
40 |
|
|
52 Wk Highs |
61 |
|
|
S&P 600 |
-11.48 |
1,186.40 |
-0.96% |
|
52 Wk Lows |
85 |
|
|
52 Wk Lows |
239 |
|
|
 |
Major Indices Faced Distributional Pressure
Kenneth J. Gruneisen - Passed the CAN SLIM® Master's Exam
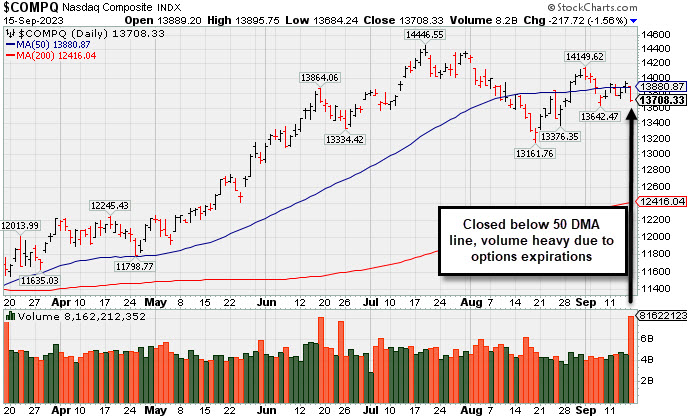
The S&P 500, Nasdaq, and Russell 2000 gave back all their gains for the week while the Dow Jones Industrial Average narrowed its weekly gain to a modest 0.2%. The major indices all closed near their worst levels of the session, which had the S&P 500 and Nasdaq below their 50-day moving averages. Volume totals reported were higher than the prior session on the NYSE and on the Nasdaq exchange due to options expirations. Breadth was negative as decliners led advancers by a 2-1 margin on the NYSE and by nearly 2-1 on the Nasdaq exchange. There were 14 high-ranked companies from the Leaders List that hit a new 52-week high and were listed on the BreakOuts Page versus the total of 17 on the prior session. New 52-week lows solidly outnumbered new 52-week highs totals on the NYSE and on the Nasdaq exchange. The major indices are in an uptrend under pressure (M criteria).
PICTURED: The Nasdaq Composite Index closed below its 50-day moving average (DMA) line with heavy volume behind Friday's loss attributed to options expirations.
All 11 S&P 500 sectors closed in the red. The utilities sector (-0.5%) led the relative outperformers while the information technology sector (-2.0%) saw the steepest decline. Weak mega cap and semiconductor components created a drag including a big loss in Adobe (ADBE -4.21%) after it gave disappointing guidance.
Weak semiconductor stocks also weighed heavily on index performance. That weakness followed Arm's (ARM -4.47%) successful IPO on Thursday. Reuters also reported that Taiwan Semiconductor Manufacturing Co. (TSM -2.43%) is delaying chip equipment shipments.
General Motors (GM +0.86%) and Stellantis (STLA +2.18%) registered gains despite failing to reach a deal with the UAW, which resulted in targeted strikes at three manufacturing plants. Ford (F -0.08%) logged a small decline.
Rising market rates and oil prices ($91.00/bbl, +0.74, +0.8%) contributed to the market's negative bias. The 2-yr note yield rose three basis points today, and seven basis points this week, to 5.04%. The 10-yr note yield rose four basis points today, and seven basis points this week, to 4.33%.
|
 Kenneth J. Gruneisen started out as a licensed stockbroker in August 1987, a couple of months prior to the historic stock market crash that took the Dow Jones Industrial Average down -22.6% in a single day. He has published daily fact-based fundamental and technical analysis on high-ranked stocks online for two decades. Through FACTBASEDINVESTING.COM, Kenneth provides educational articles, news, market commentary, and other information regarding proven investment systems that work in good times and bad.
Comments contained in the body of this report are technical opinions only and are not necessarily those of Gruneisen Growth Corp. The material herein has been obtained from sources believed to be reliable and accurate, however, its accuracy and completeness cannot be guaranteed. Our firm, employees, and customers may effect transactions, including transactions contrary to any recommendation herein, or have positions in the securities mentioned herein or options with respect thereto. Any recommendation contained in this report may not be suitable for all investors and it is not to be deemed an offer or solicitation on our part with respect to the purchase or sale of any securities. |
|
 |
Retail and Semiconductor Indexes Led Decliners
Kenneth J. Gruneisen - Passed the CAN SLIM® Master's Exam
The Retail Index ($RLX -2.64%) suffered a big loss on Friday. The financial indexes had a slightly negative bias as the Bank Index ($BKX -0.60%) and the Broker/Dealer Index ($XBD -0.56%) both edged lower. The tech sector was led lower by the Semiconductor Index ($SOX -3.01%) while the Networking Index ($NWX -1.03%) and the Biotech Index ($BTK -1.03%) each lost about -1%. Commodity-linked groups were mixed as the Oil Services Index ($OSX -1.42%) and Integrated Oil Index ($XOI -1.39%) both lost ground, meanwhile the Gold & Silver Index ($XAU +1.97%) posted a standout gain on the mostly negative session.
PICTURED: The Broker/Dealer Index ($XBD -0.56%) has been finding support above its 50-day moving average (DMA) line.
| Oil Services |
$OSX |
96.96 |
-1.40 |
-1.42% |
+15.62% |
| Integrated Oil |
$XOI |
1,960.26 |
-27.71 |
-1.39% |
+9.68% |
| Semiconductor |
$SOX |
3,476.39 |
-107.84 |
-3.01% |
+37.29% |
| Networking |
$NWX |
780.11 |
-8.09 |
-1.03% |
-0.41% |
| Broker/Dealer |
$XBD |
507.44 |
-2.87 |
-0.56% |
+12.98% |
| Retail |
$RLX |
3,634.19 |
-98.55 |
-2.64% |
+31.96% |
| Gold & Silver |
$XAU |
118.67 |
+2.29 |
+1.97% |
-1.81% |
| Bank |
$BKX |
82.31 |
-0.50 |
-0.60% |
-18.38% |
| Biotech |
$BTK |
5,183.08 |
-54.02 |
-1.03% |
-1.86% |
|
|
|
 |
Orderly Pullback Below "Max Buy" Level
Kenneth J. Gruneisen - Passed the CAN SLIM® Master's Exam
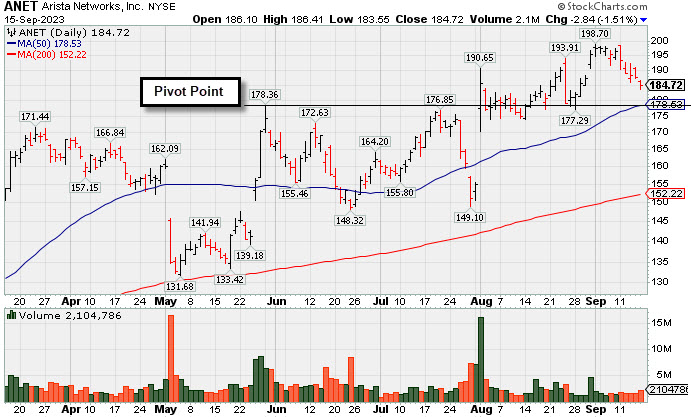
Arista Networks Inc (ANET -$2.84 or -1.51% to $184.72) pulled back below its "max buy" level for a 5th consecutive loss with light volume and its color code was changed to yellow. It remains perched only -7% from its all-time high. Its 50-day moving average (DMA) line ($178.53) defines near-term support.
Fundamentals remain strong after it reported Jun '23 quarterly earnings +40% on +39% sales revenues versus the year-ago period. ANET was highlighted in yellow with pivot point cited based on its 12/27/21 high plus 10 cents in the 3/08/23 mid-day report (read here). It was last shown in this FSU section on 7/12/23 with an annotated graph under the headline, "Hovering Near High with Volume Totals Cooling".
ANET currently has a 98 Earnings Per Share Rating. It has shown 7 consecutive quarterly comparisons with strong and steady above the +25% minimum earnings guideline (C criteria). Annual earnings (A criteria) had a downturn in FY '20 like many companies during the pandemic.
The number of top-rated funds owning its shares rose from 1,758 in Dec '21 to 2,316 in Jun '23, a reassuring sign concerning the I criteria. Its current Up/Down Volume Ratio of 1.9 is an unbiased indication its shares have been under accumulation over the past 50 days. The high-ranked Computer - Networking firm has a Timeliness Rating of A and a Sponsorship Rating of C. Its small supply of 250.8 million shares (S criteria) in the public float may contribute to greater volatility in the event of institutional buying or selling.
|
|
|
Color Codes Explained :
Y - Better candidates highlighted by our
staff of experts.
G - Previously featured
in past reports as yellow but may no longer be buyable under the
guidelines.
***Last / Change / Volume data in this table is the closing quote data***
Symbol/Exchange
Company Name
Industry Group |
PRICE |
CHANGE
(%Change) |
Day High |
Volume
(% DAV)
(% 50 day avg vol) |
52 Wk Hi
% From Hi |
Featured
Date |
Price
Featured |
Pivot Featured |
|
Max Buy |
 STRL
-
NASDAQ
STRL
-
NASDAQ
Sterling Infrastructure
Bldg-Heavy Construction
|
$74.00
|
-0.73
-0.98% |
$74.87
|
803,350
194.99% of 50 DAV
50 DAV is 412,000
|
$84.00
-11.90%
|
12/14/2022
|
$32.41
|
PP = $33.72
|
|
MB = $35.41
|
 Most Recent Note - 9/15/2023 3:54:08 PM
G - Extended from any sound base. Near-term support is its 50 DMA line ($70). Fundamentals remain strong.
>>> FEATURED STOCK ARTICLE : 7th Straight Loss Off High for Sterling Infrastructure - 9/13/2023 |
View all notes |
Set NEW NOTE alert |
Company Profile |
SEC
News |
Chart |
Request a new note
C
A
S
I |
FIX
-
NYSE
Comfort Systems USA
Bldg-A/C and Heating Prds
|
$187.68
|
-0.97
-0.51% |
$188.83
|
945,422
427.79% of 50 DAV
50 DAV is 221,000
|
$192.33
-2.42%
|
4/27/2023
|
$148.85
|
PP = $152.23
|
|
MB = $159.84
|
Most Recent Note - 9/15/2023 12:31:29 PM
G - Perched near its all-time high, extended from any sound base. Its 50 DMA line ($176) defines important near-term support to watch on pullbacks. Fundamentals remain strong.
>>> FEATURED STOCK ARTICLE : FIX Still Stubbornly Hovering Near High - 8/21/2023 |
View all notes |
Set NEW NOTE alert |
Company Profile |
SEC
News |
Chart |
Request a new note
C
A
S
I |
KOF
-
NYSE
Coca Cola Femsa Sab Ads
FOOD and BEVERAGE - Beverages - Soft Drinks
|
$79.70
|
-0.84
-1.04% |
$80.93
|
126,601
83.51% of 50 DAV
50 DAV is 151,600
|
$91.23
-12.64%
|
6/9/2023
|
$88.61
|
PP = $91.33
|
|
MB = $95.90
|
Most Recent Note - 9/14/2023 6:59:26 PM
G - Perched -11.7% off its 52-week high but its Relative Strength Rating is currently 75. Reported Jun '23 quarterly earnings +23% on +26% sales revenues versus the year-ago period, below the +25% minimum guideline (C criteria). See the latest FSU analysis for more details and a new annotated graph.
>>> FEATURED STOCK ARTICLE : Lingering Below 50 DMA Line and Relative Strength Rating Slumped - 9/14/2023 |
View all notes |
Set NEW NOTE alert |
Company Profile |
SEC
News |
Chart |
Request a new note
C
A
S
I |
CLH
-
NYSE
Clean Harbors
Pollution Control
|
$168.14
|
-1.40
-0.83% |
$169.87
|
791,774
246.66% of 50 DAV
50 DAV is 321,000
|
$178.33
-5.71%
|
3/10/2023
|
$136.89
|
PP = $136.74
|
|
MB = $143.58
|
Most Recent Note - 9/14/2023 7:04:31 PM
G - Posted a gain today with below-average volume and closed just above its 50 DMA line ($168.95). Reported earnings for the Jun '23 quarter -13% on +3% sales revenues versus the year-ago period, below the +25% minimum earnings guideline (C criteria), raising fundamental concerns.
>>> FEATURED STOCK ARTICLE : Volume Totals Have Been Cooling While Hovering Near High - 8/18/2023 |
View all notes |
Set NEW NOTE alert |
Company Profile |
SEC
News |
Chart |
Request a new note
C
A
S
I |
HUBB
-
NYSE
Hubbell
Electrical-Power/Equipmt
|
$315.85
|
-3.72
-1.16% |
$319.15
|
952,197
217.40% of 50 DAV
50 DAV is 438,000
|
$340.06
-7.12%
|
4/25/2023
|
$262.85
|
PP = $257.51
|
|
MB = $270.39
|
Most Recent Note - 9/14/2023 7:05:48 PM
G - Posted a gain with near-average volume and closed just above its 50 DMA line ($319.30). Fundamentals remain strong after Jun '23 earnings rose +45% on +9% sales revenues versus the year-ago period.
>>> FEATURED STOCK ARTICLE : Rebounded Near 50-Day Moving Average Line - 8/24/2023 |
View all notes |
Set NEW NOTE alert |
Company Profile |
SEC
News |
Chart |
Request a new note
C
A
S
I |
Symbol/Exchange
Company Name
Industry Group |
PRICE |
CHANGE
(%Change) |
Day High |
Volume
(% DAV)
(% 50 day avg vol) |
52 Wk Hi
% From Hi |
Featured
Date |
Price
Featured |
Pivot Featured |
|
Max Buy |
ANET
-
NYSE
Arista Networks
Computer-Networking
|
$184.72
|
-2.84
-1.51% |
$186.41
|
2,104,786
77.75% of 50 DAV
50 DAV is 2,707,000
|
$198.70
-7.04%
|
8/1/2023
|
$188.84
|
PP = $178.46
|
|
MB = $187.38
|
Most Recent Note - 9/15/2023 3:47:26 PM
Y - Pulled back today for a 5th consecutive small loss with light volume, pulling back below its "max buy" level and its color code is changed to yellow. Remains perched near its all-time high. Fundamentals remain strong. See the latest FSU analysis for more details and a new annotated graph.
>>> FEATURED STOCK ARTICLE : Orderly Pullback Below "Max Buy" Level - 9/15/2023 |
View all notes |
Set NEW NOTE alert |
Company Profile |
SEC
News |
Chart |
Request a new note
C
A
S
I |
LSCC
-
NASDAQ
Lattice Semiconductor
Elec-Semicondctor Fablss
|
$87.45
|
-4.69
-5.09% |
$91.23
|
3,218,243
200.39% of 50 DAV
50 DAV is 1,606,000
|
$98.30
-11.04%
|
6/13/2023
|
$91.73
|
PP = $96.92
|
|
MB = $101.77
|
Most Recent Note - 9/15/2023 1:34:21 PM
G - Slumping back below its 50 DMA line ($91.26) with today's big loss raising concerns. Reported Jun '23 quarterly earnings +24% on +18% sales revenues versus the year-ago period, just below the +25% minimum earnings guideline (C criteria).
>>> FEATURED STOCK ARTICLE : Rebound Needed Above 50-Day Moving Average for Lattice - 8/17/2023 |
View all notes |
Set NEW NOTE alert |
Company Profile |
SEC
News |
Chart |
Request a new note
C
A
S
I |
ESQ
-
NASDAQ
Esquire Finl Hldgs
Finance-Commercial Loans
|
$46.42
|
-0.90
-1.90% |
$47.79
|
56,780
258.09% of 50 DAV
50 DAV is 22,000
|
$54.03
-14.08%
|
7/14/2023
|
$45.80
|
PP = $48.23
|
|
MB = $50.64
|
Most Recent Note - 9/15/2023 3:50:47 PM
G - Suffered a volume-driven loss. Its 50 DMA line ($48) has acted as resistance while slipping below prior highs in the $47 area. A rebound above the 50 DMA line is needed for its outlook to improve.
>>> FEATURED STOCK ARTICLE : Pullback with Light Volume Testing Important Support Level - 8/15/2023 |
View all notes |
Set NEW NOTE alert |
Company Profile |
SEC
News |
Chart |
Request a new note
C
A
S
I |
MEDP
-
NASDAQ
Medpace Holdings
Medical-Research Eqp/Svc
|
$279.98
|
-0.05
-0.02% |
$282.00
|
915,322
341.54% of 50 DAV
50 DAV is 268,000
|
$282.73
-0.97%
|
7/25/2023
|
$196.32
|
PP = $241.57
|
|
MB = $253.65
|
Most Recent Note - 9/15/2023 3:52:09 PM
G - Churned heavy volume while remaining perched at its all-time high. Prior high ($269) defines initial support to watch above its 50 DMA line ($258). Fundamentals remain strong.
>>> FEATURED STOCK ARTICLE : Consolidating Above 50-Day Moving Average - 8/23/2023 |
View all notes |
Set NEW NOTE alert |
Company Profile |
SEC
News |
Chart |
Request a new note
C
A
S
I |
COKE
-
NASDAQ
Coca-Cola Consolidated
Beverages-Non-Alcoholic
|
$644.81
|
-15.19
-2.30% |
$660.00
|
74,896
182.67% of 50 DAV
50 DAV is 41,000
|
$745.53
-13.51%
|
8/3/2023
|
$718.56
|
PP = $694.30
|
|
MB = $729.02
|
Most Recent Note - 9/15/2023 3:49:44 PM
G - Sank further below its 50 DMA line ($669) with a volume-driven loss hurting its outlook. Only a prompt rebound above the 50 DMA line would help its outlook improve.
>>> FEATURED STOCK ARTICLE : Rebounded Above 50-Day Moving Average - 9/11/2023 |
View all notes |
Set NEW NOTE alert |
Company Profile |
SEC
News |
Chart |
Request a new note
C
A
S
I |
Symbol/Exchange
Company Name
Industry Group |
PRICE |
CHANGE
(%Change) |
Day High |
Volume
(% DAV)
(% 50 day avg vol) |
52 Wk Hi
% From Hi |
Featured
Date |
Price
Featured |
Pivot Featured |
|
Max Buy |
PLUS
-
NASDAQ
ePlus
Computer-Tech Services
|
$62.46
|
-0.97
-1.53% |
$63.60
|
414,776
410.67% of 50 DAV
50 DAV is 101,000
|
$75.90
-17.71%
|
8/8/2023
|
$67.60
|
PP = $62.92
|
|
MB = $66.07
|
Most Recent Note - 9/15/2023 1:35:45 PM
Y - Today's quiet loss is testing the recent low and 50 DMA line defining important near-term support in the $61 area. More damaging losses may trigger a technical sell signal.
>>> FEATURED STOCK ARTICLE : Still Consolidating Above 50 DMA Line - 9/12/2023 |
View all notes |
Set NEW NOTE alert |
Company Profile |
SEC
News |
Chart |
Request a new note
C
A
S
I |
|
|
|
THESE ARE NOT BUY RECOMMENDATIONS!
Comments contained in the body of this report are technical
opinions only. The material herein has been obtained
from sources believed to be reliable and accurate, however,
its accuracy and completeness cannot be guaranteed.
This site is not an investment advisor, hence it does
not endorse or recommend any securities or other investments.
Any recommendation contained in this report may not
be suitable for all investors and it is not to be deemed
an offer or solicitation on our part with respect to
the purchase or sale of any securities. All trademarks,
service marks and trade names appearing in this report
are the property of their respective owners, and are
likewise used for identification purposes only.
This report is a service available
only to active Paid Premium Members.
You may opt-out of receiving report notifications
at any time. Questions or comments may be submitted
by writing to Premium Membership Services 665 S.E. 10 Street, Suite 201 Deerfield Beach, FL 33441-5634 or by calling 1-800-965-8307
or 954-785-1121.
|
|
|