You are not logged in.
This means you
CAN ONLY VIEW reports that were published prior to Wednesday, April 23, 2025.
You
MUST UPGRADE YOUR MEMBERSHIP if you want to see any current reports.
AFTER MARKET UPDATE - WEDNESDAY, SEPTEMBER 20TH, 2023
Previous After Market Report Next After Market Report >>>
|
|
|
|
DOW |
-76.85 |
34,440.88 |
-0.22% |
|
Volume |
767,662,873 |
-14% |
|
Volume |
4,813,896,400 |
+7% |
|
NASDAQ |
-209.06 |
13,469.13 |
-1.53% |
|
Advancers |
1,115 |
39% |
|
Advancers |
1,444 |
33% |
|
S&P 500 |
-41.75 |
4,402.20 |
-0.94% |
|
Decliners |
1,715 |
61% |
|
Decliners |
2,885 |
67% |
|
Russell 2000 |
-16.43 |
1,810.10 |
-0.90% |
|
52 Wk Highs |
49 |
|
|
52 Wk Highs |
54 |
|
|
S&P 600 |
-9.46 |
1,167.02 |
-0.80% |
|
52 Wk Lows |
66 |
|
|
52 Wk Lows |
267 |
|
|
 |
Breadth Negative as Major Indices Fell
Kenneth J. Gruneisen - Passed the CAN SLIM® Master's Exam
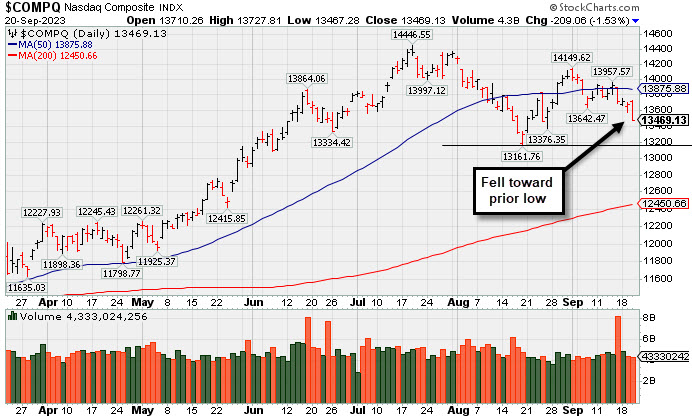
The Nasdaq Composite Index fell -1.53% while the S&P 500 Index fell -0.94% and the Dow Jones Industrial Average fell -0.22%. Volume totals reported were mixed, lighter than the prior session on the NYSE and higher on the Nasdaq exchange. Breadth was negative as decliners led advancers by a 3-2 margin on the NYSE and by a 2-1 margin on the Nasdaq exchange. There were 19 high-ranked companies from the Leaders List that hit a new 52-week high and were listed on the BreakOuts Page versus the total of 9 on the prior session. New 52-week lows outnumbered new 52-week highs totals on the NYSE and on the Nasdaq exchange. The major indices are in an uptrend under pressure (M criteria).
PICTURED: The Nasdaq Composite Index is sputtering below its 50-day moving average (DMA) line and fell toward the prior low.
The FOMC voted unanimously to leave the target range for the fed funds rate unchanged at 5.25-5.50%. Turbulent price action continued as Fed Chair Powell gave his press conference and stated that the Fed is going to "proceed carefully" when thinking about making a policy move. Treasury yields were mixed as the 2-yr note yield settled at 5.13% and the 10-yr note yield settled at 4.35%.
Stocks settled into a steady decline in the late afternoon, led by the mega caps. Most of the S&P 500 sectors closed in the red with communication services (-1.9%) and information technology (-1.8%) logging the biggest declines. The consumer staples sector (+0.2%) led the outperformers.
Klaviyo (KVYO +9.2%) priced its IPO at $30 and traded as high as $37 before pulling back. Recent IPOs including ARM Holdings (ARM -4.10%) and Instacart (CART -10.68%) both slumped.
|
 Kenneth J. Gruneisen started out as a licensed stockbroker in August 1987, a couple of months prior to the historic stock market crash that took the Dow Jones Industrial Average down -22.6% in a single day. He has published daily fact-based fundamental and technical analysis on high-ranked stocks online for two decades. Through FACTBASEDINVESTING.COM, Kenneth provides educational articles, news, market commentary, and other information regarding proven investment systems that work in good times and bad.
Comments contained in the body of this report are technical opinions only and are not necessarily those of Gruneisen Growth Corp. The material herein has been obtained from sources believed to be reliable and accurate, however, its accuracy and completeness cannot be guaranteed. Our firm, employees, and customers may effect transactions, including transactions contrary to any recommendation herein, or have positions in the securities mentioned herein or options with respect thereto. Any recommendation contained in this report may not be suitable for all investors and it is not to be deemed an offer or solicitation on our part with respect to the purchase or sale of any securities. |
|
 |
Retail, Tech, Energy, and Financial Indexes Fell
Kenneth J. Gruneisen - Passed the CAN SLIM® Master's Exam
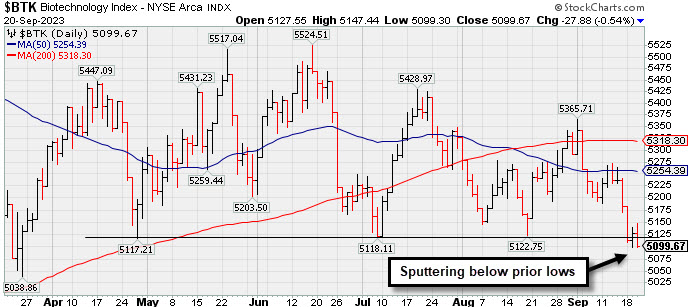
Again the Retail Index ($RLX -1.19%) outpaced the Bank Index ($BKX -0.84%) and the Broker/Dealer Index ($XBD -0.62%) to the downside on Wednesday. The Networking Index ($NWX -1.37%) and the Semiconductor Index ($SOX -1.74%) both outpaced the Biotech Index ($BTK -0.54%) to the downside. Commodity-linked groups were mixed as the Oil Services Index ($OSX -0.64%) and Integrated Oil Index ($XOI -1.00%) both lost ground, meanwhile the Gold & Silver Index ($XAU -0.96%) posted a standout gain.
PICTURED: The Biotech Index ($BTK -0.54%) is sputtering below prior lows.
|
|
|
 |
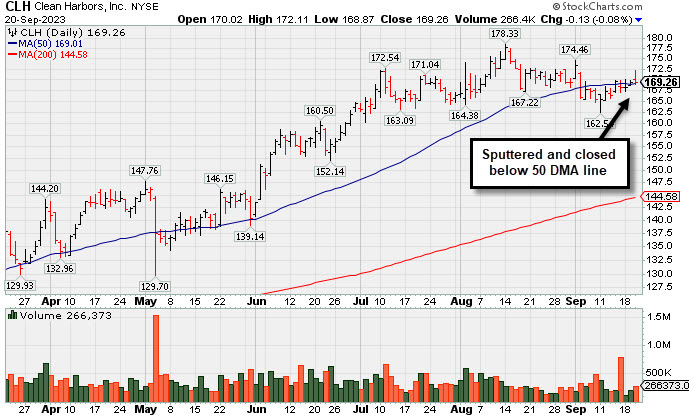
Enduring Distributional Pressure Near 50-Day Moving Average
Kenneth J. Gruneisen - Passed the CAN SLIM® Master's Exam
Clean Harbors Inc (CLH -$0.13 or -0.08% to $169.26) erased an early gain today and closed near the session low and near its 50-day moving average (DMA) line ($169). Recently it reported earnings for the Jun '23 quarter -13% on +3% sales revenues versus the year-ago period, below the +25% minimum earnings guideline (C criteria), raising fundamental concerns while well below the +25% minimum earnings guideline (C criteria). CLH has seen its Earnings Per Share Rating slump to 94 from 99. Prior quarters showed a strong earnings track record with earnings above the +25% minimum guideline (C criteria). Annual earnings (A criteria) growth has been strong and steady.
There are only 54.1 million shares outstanding (S criteria), which can contribute to greater price volatility in the event of institutional buying or selling. The number of top-rated funds owning its shares rose from 590 in Sep '21 to 781 in Jun '23, a reassuring sign concerning the I criteria. The current Up/Down Volume Ratio of 0.8 is an unbiased indication its shares have been under distributional pressure over the past 50 days. It has a Timeliness Rating of B , a Sponsorship Rating of C, and an Accumulation Distribution Rating of D.
|
|
|
Color Codes Explained :
Y - Better candidates highlighted by our
staff of experts.
G - Previously featured
in past reports as yellow but may no longer be buyable under the
guidelines.
***Last / Change / Volume data in this table is the closing quote data***
Symbol/Exchange
Company Name
Industry Group |
PRICE |
CHANGE
(%Change) |
Day High |
Volume
(% DAV)
(% 50 day avg vol) |
52 Wk Hi
% From Hi |
Featured
Date |
Price
Featured |
Pivot Featured |
|
Max Buy |
 STRL
-
NASDAQ
STRL
-
NASDAQ
Sterling Infrastructure
Bldg-Heavy Construction
|
$74.28
|
+0.00
0.00% |
$75.98
|
15
0.00% of 50 DAV
50 DAV is 414,000
|
$84.00
-11.57%
|
12/14/2022
|
$32.41
|
PP = $33.72
|
|
MB = $35.41
|
Most Recent Note - 9/18/2023 4:57:40 PM
G - Posted a gain today with below-average volume. Extended from any sound base. Near-term support is its 50 DMA line ($70.47). Fundamentals remain strong.
>>> FEATURED STOCK ARTICLE : 7th Straight Loss Off High for Sterling Infrastructure - 9/13/2023 |
View all notes |
Set NEW NOTE alert |
Company Profile |
SEC
News |
Chart |
Request a new note
C
A
S
I |
FIX
-
NYSE
Comfort Systems USA
Bldg-A/C and Heating Prds
|
$182.22
|
+0.00
0.00% |
$185.13
|
8
0.00% of 50 DAV
50 DAV is 239,000
|
$192.33
-5.26%
|
4/27/2023
|
$148.85
|
PP = $152.23
|
|
MB = $159.84
|
Most Recent Note - 9/18/2023 4:56:02 PM
G - Pulling back from its all-time high, still extended from any sound base. Its 50 DMA line ($176.91) defines important near-term support to watch on pullbacks. Fundamentals remain strong.
>>> FEATURED STOCK ARTICLE : FIX Still Stubbornly Hovering Near High - 8/21/2023 |
View all notes |
Set NEW NOTE alert |
Company Profile |
SEC
News |
Chart |
Request a new note
C
A
S
I |
KOF
-
NYSE
Coca Cola Femsa Sab Ads
FOOD and BEVERAGE - Beverages - Soft Drinks
|
$81.50
|
+1.75
2.19% |
$81.81
|
0
0.00% of 50 DAV
50 DAV is 148,800
|
$91.23
-10.67%
|
6/9/2023
|
$88.61
|
PP = $91.33
|
|
MB = $95.90
|
 Most Recent Note - 9/19/2023 5:19:22 PM
G - Posted a 2nd consecutive gain with light volume, finding support above its 200 DMA line ($79.37) and closing only -10.7% off its 52-week high. More damaging losses would raise serious concerns. Its Relative Strength Rating is currently 76, below the 80+ minimum guideline for buy candidates. Reported Jun '23 quarterly earnings +23% on +26% sales revenues versus the year-ago period, below the +25% minimum guideline (C criteria).
>>> FEATURED STOCK ARTICLE : Lingering Below 50 DMA Line and Relative Strength Rating Slumped - 9/14/2023 |
View all notes |
Set NEW NOTE alert |
Company Profile |
SEC
News |
Chart |
Request a new note
C
A
S
I |
CLH
-
NYSE
Clean Harbors
Pollution Control
|
$169.39
|
+0.00
0.00% |
$169.88
|
1
0.00% of 50 DAV
50 DAV is 319,000
|
$178.33
-5.01%
|
3/10/2023
|
$136.89
|
PP = $136.74
|
|
MB = $143.58
|
Most Recent Note - 9/19/2023 5:20:32 PM
G - Posted a small gain today with below-average volume. Hovering near its 50 DMA line ($169). Reported earnings for the Jun '23 quarter -13% on +3% sales revenues versus the year-ago period, below the +25% minimum earnings guideline (C criteria), raising fundamental concerns.
>>> FEATURED STOCK ARTICLE : Volume Totals Have Been Cooling While Hovering Near High - 8/18/2023 |
View all notes |
Set NEW NOTE alert |
Company Profile |
SEC
News |
Chart |
Request a new note
C
A
S
I |
HUBB
-
NYSE
Hubbell
Electrical-Power/Equipmt
|
$314.38
|
+0.00
0.00% |
$319.54
|
23,330
5.18% of 50 DAV
50 DAV is 450,000
|
$340.06
-7.55%
|
4/25/2023
|
$262.85
|
PP = $257.51
|
|
MB = $270.39
|
Most Recent Note - 9/19/2023 5:16:09 PM
G - Closed just below its 50 DMA line ($318.51) with today's loss on light volume. Prior low ($299.80 on 8/10/23) defines the next important suport to watch. Fundamentals remain strong.
>>> FEATURED STOCK ARTICLE : Rebounded Near 50-Day Moving Average Line - 8/24/2023 |
View all notes |
Set NEW NOTE alert |
Company Profile |
SEC
News |
Chart |
Request a new note
C
A
S
I |
Symbol/Exchange
Company Name
Industry Group |
PRICE |
CHANGE
(%Change) |
Day High |
Volume
(% DAV)
(% 50 day avg vol) |
52 Wk Hi
% From Hi |
Featured
Date |
Price
Featured |
Pivot Featured |
|
Max Buy |
ANET
-
NYSE
Arista Networks
Computer-Networking
|
$184.83
|
+0.00
0.00% |
$185.55
|
27,174
1.00% of 50 DAV
50 DAV is 2,708,000
|
$198.70
-6.98%
|
8/1/2023
|
$188.84
|
PP = $178.46
|
|
MB = $187.38
|
Most Recent Note - 9/15/2023 3:47:26 PM
Y - Pulled back today for a 5th consecutive small loss with light volume, pulling back below its "max buy" level and its color code is changed to yellow. Remains perched near its all-time high. Fundamentals remain strong. See the latest FSU analysis for more details and a new annotated graph.
>>> FEATURED STOCK ARTICLE : Orderly Pullback Below "Max Buy" Level - 9/15/2023 |
View all notes |
Set NEW NOTE alert |
Company Profile |
SEC
News |
Chart |
Request a new note
C
A
S
I |
LSCC
-
NASDAQ
Lattice Semiconductor
Elec-Semicondctor Fablss
|
$86.16
|
-0.68
-0.78% |
$86.72
|
0
0.00% of 50 DAV
50 DAV is 1,644,000
|
$98.30
-12.35%
|
6/13/2023
|
$91.73
|
PP = $96.92
|
|
MB = $101.77
|
Most Recent Note - 9/19/2023 5:13:57 PM
G - Ended -12.3% off its high but slumped further below its 50 DMA line ($91) toward its 200 DMA line with today's 3rd consecutive loss. Reported Jun '23 quarterly earnings +24% on +18% sales revenues versus the year-ago period, just below the +25% minimum earnings guideline (C criteria). See the latest FSU analysis for more details and a new annotated graph.
>>> FEATURED STOCK ARTICLE : Slumping Near 200 DMA Line and Still Only -12.3% Off High - 9/19/2023 |
View all notes |
Set NEW NOTE alert |
Company Profile |
SEC
News |
Chart |
Request a new note
C
A
S
I |
ESQ
-
NASDAQ
Esquire Financial Holdings
Finance-Commercial Loans
|
$45.52
|
-0.52
-1.13% |
$46.06
|
0
0.00% of 50 DAV
50 DAV is 22,700
|
$54.03
-15.75%
|
7/14/2023
|
$45.80
|
PP = $48.23
|
|
MB = $50.64
|
Most Recent Note - 9/19/2023 12:16:32 PM
G - Sputtering after its 50 DMA line ($48) acted as resistance, raising concerns while sinking below prior highs in the $47 area. A rebound above the 50 DMA line is needed for its outlook to improve. See the latest FSU analysis for more details and an annotated graph.
>>> FEATURED STOCK ARTICLE : Met Resistance at 50-Day Moving Average After Slumping - 9/18/2023 |
View all notes |
Set NEW NOTE alert |
Company Profile |
SEC
News |
Chart |
Request a new note
C
A
S
I |
MEDP
-
NASDAQ
Medpace Holdings
Medical-Research Eqp/Svc
|
$255.73
|
+0.00
0.00% |
$271.42
|
93
0.03% of 50 DAV
50 DAV is 282,000
|
$282.73
-9.55%
|
7/25/2023
|
$196.32
|
PP = $241.57
|
|
MB = $253.65
|
Most Recent Note - 9/19/2023 12:24:26 PM
G - Abruptly retreating below the prior high ($269) and violating its 50 DMA line ($259) with today's big volume-driven loss triggering a technical sell signal. ONly a prompt rebound above the 50 DMA line would help its outlook improve. Fundamentals remain strong.
>>> FEATURED STOCK ARTICLE : Consolidating Above 50-Day Moving Average - 8/23/2023 |
View all notes |
Set NEW NOTE alert |
Company Profile |
SEC
News |
Chart |
Request a new note
C
A
S
I |
COKE
-
NASDAQ
Coca-Cola Consolidated
Beverages-Non-Alcoholic
|
$656.69
|
+1.40
0.21% |
$661.29
|
3
0.01% of 50 DAV
50 DAV is 42,000
|
$745.53
-11.92%
|
8/3/2023
|
$718.56
|
PP = $694.30
|
|
MB = $729.02
|
Most Recent Note - 9/15/2023 3:49:44 PM
G - Sank further below its 50 DMA line ($669) with a volume-driven loss hurting its outlook. Only a prompt rebound above the 50 DMA line would help its outlook improve.
>>> FEATURED STOCK ARTICLE : Rebounded Above 50-Day Moving Average - 9/11/2023 |
View all notes |
Set NEW NOTE alert |
Company Profile |
SEC
News |
Chart |
Request a new note
C
A
S
I |
Symbol/Exchange
Company Name
Industry Group |
PRICE |
CHANGE
(%Change) |
Day High |
Volume
(% DAV)
(% 50 day avg vol) |
52 Wk Hi
% From Hi |
Featured
Date |
Price
Featured |
Pivot Featured |
|
Max Buy |
PLUS
-
NASDAQ
ePlus
Computer-Tech Services
|
$62.81
|
+0.07
0.11% |
$62.97
|
2
0.00% of 50 DAV
50 DAV is 108,000
|
$75.90
-17.25%
|
8/8/2023
|
$67.60
|
PP = $62.92
|
|
MB = $66.07
|
Most Recent Note - 9/15/2023 1:35:45 PM
Y - Today's quiet loss is testing the recent low and 50 DMA line defining important near-term support in the $61 area. More damaging losses may trigger a technical sell signal.
>>> FEATURED STOCK ARTICLE : Still Consolidating Above 50 DMA Line - 9/12/2023 |
View all notes |
Set NEW NOTE alert |
Company Profile |
SEC
News |
Chart |
Request a new note
C
A
S
I |
|
|
|
THESE ARE NOT BUY RECOMMENDATIONS!
Comments contained in the body of this report are technical
opinions only. The material herein has been obtained
from sources believed to be reliable and accurate, however,
its accuracy and completeness cannot be guaranteed.
This site is not an investment advisor, hence it does
not endorse or recommend any securities or other investments.
Any recommendation contained in this report may not
be suitable for all investors and it is not to be deemed
an offer or solicitation on our part with respect to
the purchase or sale of any securities. All trademarks,
service marks and trade names appearing in this report
are the property of their respective owners, and are
likewise used for identification purposes only.
This report is a service available
only to active Paid Premium Members.
You may opt-out of receiving report notifications
at any time. Questions or comments may be submitted
by writing to Premium Membership Services 665 S.E. 10 Street, Suite 201 Deerfield Beach, FL 33441-5634 or by calling 1-800-965-8307
or 954-785-1121.
|
|
|