You are not logged in.
This means you
CAN ONLY VIEW reports that were published prior to Wednesday, April 23, 2025.
You
MUST UPGRADE YOUR MEMBERSHIP if you want to see any current reports.
AFTER MARKET UPDATE - FRIDAY, SEPTEMBER 22ND, 2023
Previous After Market Report Next After Market Report >>>
|
|
|
|
DOW |
-106.58 |
33,963.84 |
-0.31% |
|
Volume |
876,676,402 |
+3% |
|
Volume |
4,324,361,000 |
-14% |
|
NASDAQ |
-12.18 |
13,211.81 |
-0.09% |
|
Advancers |
1,318 |
47% |
|
Advancers |
1,845 |
43% |
|
S&P 500 |
-9.94 |
4,320.06 |
-0.23% |
|
Decliners |
1,489 |
53% |
|
Decliners |
2,462 |
57% |
|
Russell 2000 |
-5.32 |
1,776.50 |
-0.30% |
|
52 Wk Highs |
22 |
|
|
52 Wk Highs |
35 |
|
|
S&P 600 |
-3.51 |
1,146.45 |
-0.31% |
|
52 Wk Lows |
172 |
|
|
52 Wk Lows |
365 |
|
|
Damaging losses have signaled a more serious market correction (M criteria). During market corrections, disciplined investors know to reduce exposure and raise cash by selling any weakening stocks on a case-by-case basis.
|
 |
Major Indexes Sputtered and Lacked Leadership
Kenneth J. Gruneisen - Passed the CAN SLIM® Master's Exam
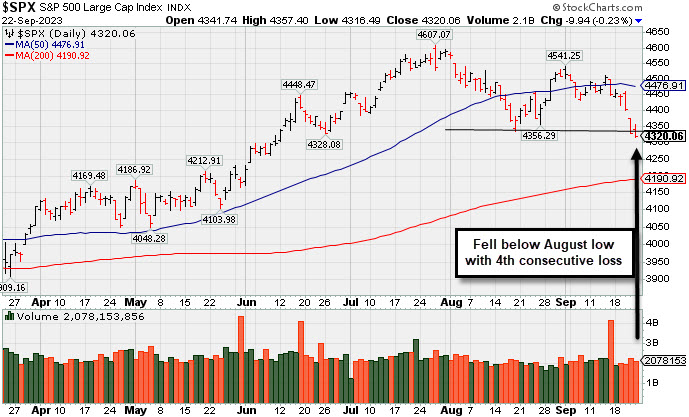
The major indices settled near their lows of the day with losses in the -0.1% to -0.3% range. Volume totals reported were mixed, higher than the prior session on the NYSE and lighter on the Nasdaq exchange. Decliners led advancers by a narrow margin on the NYSE and by a 4-3 margin on the Nasdaq exchange. There were 5 high-ranked companies from the Leaders List that hit a new 52-week high and were listed on the BreakOuts Page versus the total of 2 on the prior session. New 52-week lows totals solidly outnumbered new 52-week highs totals on the NYSE and on the Nasdaq exchange. The major indices are in a correction (M criteria). New buying efforts should be avoided until a new rally is confirmed by a solid follow-through day.
PICTURED: The S&P 500 Index fell below its August low with a 4th consecutive loss.
The preliminary September S&P Global US Manufacturing PMI improved from August (actual 48.9; prior 47.9) but was still indicative of contraction (below a 50 reading). The S&P Global US Services PMI, meanwhile, still reflected expansion, but fell to 50.2 in the preliminary September reading from 50.5 in August. Some of the market's deterioration was attributed to San Francisco Fed President Daly (a 2024 FOMC voter), who reportedly echoed the new party line that the Fed may have some more tightening to do. The 2-yr note yield settled at 5.12%. The 10-yr note yield fell four basis points to 4.44%.
Nine of the 11 S&P 500 sectors logged a decline. The consumer discretionary (-0.9%) and financials (-0.7%) sectors saw the steepest losses. The energy (+0.2%) and information technology (+0.3%) sectors outperformed. Gains in Apple (AAPL +0.49%) and NVIDIA (NVDA +1.45%) had a positive impact on the major indices. Meanwhile, the UAW confirmed reports that progress has been made on labor talks with Ford (F +1.89%), however, Stellantis (STLA +0.10%) and General Motors (GM -0.40%) were said to need more "serious pushing."
|
 Kenneth J. Gruneisen started out as a licensed stockbroker in August 1987, a couple of months prior to the historic stock market crash that took the Dow Jones Industrial Average down -22.6% in a single day. He has published daily fact-based fundamental and technical analysis on high-ranked stocks online for two decades. Through FACTBASEDINVESTING.COM, Kenneth provides educational articles, news, market commentary, and other information regarding proven investment systems that work in good times and bad.
Comments contained in the body of this report are technical opinions only and are not necessarily those of Gruneisen Growth Corp. The material herein has been obtained from sources believed to be reliable and accurate, however, its accuracy and completeness cannot be guaranteed. Our firm, employees, and customers may effect transactions, including transactions contrary to any recommendation herein, or have positions in the securities mentioned herein or options with respect thereto. Any recommendation contained in this report may not be suitable for all investors and it is not to be deemed an offer or solicitation on our part with respect to the purchase or sale of any securities. |
|
 |
Financial Indexes Fell While Tech Indexes Rose
Kenneth J. Gruneisen - Passed the CAN SLIM® Master's Exam
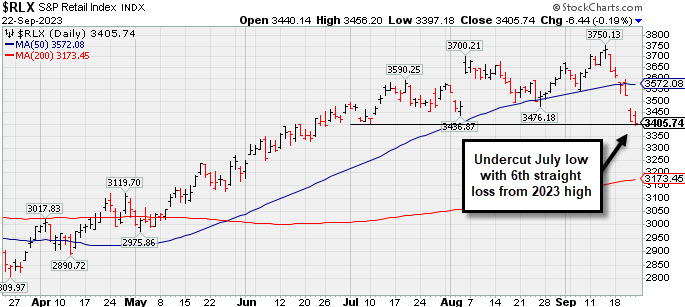
The Bank Index ($BKX -1.25%) outpaced the Broker/Dealer Index ($XBD -0.68%) to the downside and the Retail Index ($RLX -0.19%) also inched lower on Friday. The Networking Index ($NWX +0.36%) and Semiconductor Index ($SOX +0.79%) each posted a small gain while the Biotech Index ($BTK -0.34%) edged lower. The Oil Services Index ($OSX +0.55%) posted a small gain while the Integrated Oil Index ($XOI -0.19%) and the Gold & Silver Index ($XAU -0.45%) both ended slightly lower.
PICTURED: The Retail Index ($RLX -0.19%) undercut its July low with a 6th straight loss while retreating from its 2023 high.
| Oil Services |
$OSX |
93.33 |
+0.51 |
+0.55% |
+11.29% |
| Integrated Oil |
$XOI |
1,909.49 |
-3.58 |
-0.19% |
+6.84% |
| Semiconductor |
$SOX |
3,365.29 |
+26.44 |
+0.79% |
+32.90% |
| Networking |
$NWX |
748.67 |
+2.69 |
+0.36% |
-4.42% |
| Broker/Dealer |
$XBD |
487.98 |
-3.33 |
-0.68% |
+8.65% |
| Retail |
$RLX |
3,405.74 |
-6.44 |
-0.19% |
+23.67% |
| Gold & Silver |
$XAU |
114.58 |
-0.52 |
-0.45% |
-5.20% |
| Bank |
$BKX |
78.51 |
-1.00 |
-1.26% |
-22.16% |
| Biotech |
$BTK |
5,011.62 |
-16.86 |
-0.34% |
-5.10% |
|
|
|
 |
Damaging Streak of Losses Violated 50-Day Moving Average Line
Kenneth J. Gruneisen - Passed the CAN SLIM® Master's Exam
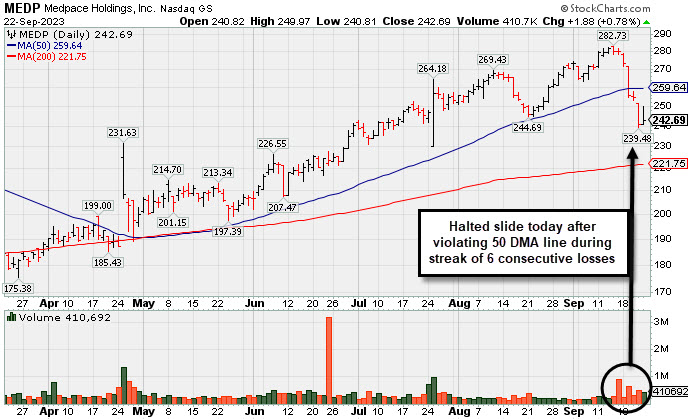
Medpace Holdings Inc (MEDP +$1.88 or +0.78% to $242.69) halted its slide today after 6 damaging losses, abruptly retreating below the prior high ($269) and violating its 50-day moving average (DMA) line ($260) triggering a technical sell signal. Only a prompt rebound above the 50 DMA line would help its outlook improve. Fundamentals remain strong.
MEDP was highlighted in yellow with pivot point cited based on its 1/23/23 high plus 10 cents in the earlier mid-day report (read here). It was last shown in this FSU section on 8/23/23 with an annotated graph under the headline, "Consolidating Above 50-Day Moving Average".
It has a 99 Earnings Per Share Rating. MEDP reported earnings increases above the +25% minimum earnings guideline (C criteria) in the past 5 quarterly comparisons through Jun '23. It is also a great match with the winning models of the fact-based investment system as its annual earnings history has been strong and steady.
There is a small supply of only 30.6 million shares outstanding (S criteria) which can contribute to greater price volatility in the event of institutional buying or selling. The number of top-rated funds owning its shares rose from 188 in Dec '17 to 731 in Jun '23, a reassuring sign concerning the I criteria. Its current Up/Down Volume Ratio of 0.9 is an unbiased indication its shares have been under slight distributional pressure over the past 50 days. It has earned a Timeliness Rating of A and Sponsorship rating of B.
Charts courtesy of www.stockcharts.com |
|
|
Color Codes Explained :
Y - Better candidates highlighted by our
staff of experts.
G - Previously featured
in past reports as yellow but may no longer be buyable under the
guidelines.
***Last / Change / Volume data in this table is the closing quote data***
Symbol/Exchange
Company Name
Industry Group |
PRICE |
CHANGE
(%Change) |
Day High |
Volume
(% DAV)
(% 50 day avg vol) |
52 Wk Hi
% From Hi |
Featured
Date |
Price
Featured |
Pivot Featured |
|
Max Buy |
 STRL
-
NASDAQ
STRL
-
NASDAQ
Sterling Infrastructure
Bldg-Heavy Construction
|
$71.66
|
-0.29
-0.40% |
$72.65
|
219,067
53.30% of 50 DAV
50 DAV is 411,000
|
$84.00
-14.69%
|
12/14/2022
|
$32.41
|
PP = $33.72
|
|
MB = $35.41
|
Most Recent Note - 9/21/2023 5:24:17 PM
G - Fell near its 50 DMA line ($71.38) with today's big loss on below-average volume. Fundamentals remain strong.
>>> FEATURED STOCK ARTICLE : 7th Straight Loss Off High for Sterling Infrastructure - 9/13/2023 |
View all notes |
Set NEW NOTE alert |
Company Profile |
SEC
News |
Chart |
Request a new note
C
A
S
I |
FIX
-
NYSE
Comfort Systems USA
Bldg-A/C and Heating Prds
|
$170.38
|
-0.13
-0.08% |
$172.39
|
225,717
92.51% of 50 DAV
50 DAV is 244,000
|
$192.33
-11.41%
|
4/27/2023
|
$148.85
|
PP = $152.23
|
|
MB = $159.84
|
Most Recent Note - 9/21/2023 5:15:49 PM
G - Violated its 50 DMA line ($177.72) with today's gap down and 5th consecutive loss triggering a technical sell signal. Only a prompt rebound above the 50 DMA line would help its outlook improve. Fundamentals remain strong. See the latest FSU analysis for more details and a new annotated graph.
>>> FEATURED STOCK ARTICLE : Violated 50-Day Moving Average With a Damaging Gap Down - 9/21/2023 |
View all notes |
Set NEW NOTE alert |
Company Profile |
SEC
News |
Chart |
Request a new note
C
A
S
I |
CLH
-
NYSE
Clean Harbors
Pollution Control
|
$167.22
|
+0.02
0.01% |
$169.37
|
154,022
50.17% of 50 DAV
50 DAV is 307,000
|
$178.33
-6.23%
|
3/10/2023
|
$136.89
|
PP = $136.74
|
|
MB = $143.58
|
Most Recent Note - 9/21/2023 5:02:04 PM
G - Slumped below its 50 DMA line ($169) with today's 2nd consecutive loss backed by below-average volume. Jun '23 quarterly earnings were -13% on +3% sales revenues versus the year-ago period, below the +25% minimum earnings guideline (C criteria), raising fundamental concerns.
>>> FEATURED STOCK ARTICLE : Enduring Distributional Pressure Near 50-Day Moving Average - 9/20/2023 |
View all notes |
Set NEW NOTE alert |
Company Profile |
SEC
News |
Chart |
Request a new note
C
A
S
I |
ANET
-
NYSE
Arista Networks
Computer-Networking
|
$180.34
|
+2.48
1.39% |
$181.52
|
1,251,907
46.64% of 50 DAV
50 DAV is 2,684,000
|
$198.70
-9.24%
|
8/1/2023
|
$188.84
|
PP = $178.46
|
|
MB = $187.38
|
Most Recent Note - 9/21/2023 5:00:41 PM
G - Gapped down today violating its 50 DMA line ($180) with a loss on light volume triggering a technical sell signal and its color code is changed to green. Only a prompt rebound above the 50 DMA line would help its outlook improve. Fundamentals remain strong.
>>> FEATURED STOCK ARTICLE : Orderly Pullback Below "Max Buy" Level - 9/15/2023 |
View all notes |
Set NEW NOTE alert |
Company Profile |
SEC
News |
Chart |
Request a new note
C
A
S
I |
MEDP
-
NASDAQ
Medpace Holdings
Medical-Research Eqp/Svc
|
$242.69
|
+1.88
0.78% |
$249.97
|
410,692
142.60% of 50 DAV
50 DAV is 288,000
|
$282.73
-14.16%
|
7/25/2023
|
$196.32
|
PP = $241.57
|
|
MB = $253.65
|
 Most Recent Note - 9/22/2023 5:17:23 PM
G - Halted its slide today after 6 damaging losses, abruptly retreating below the prior high ($269) and violating its 50 DMA line ($260) triggering a technical sell signal. Only a prompt rebound above the 50 DMA line would help its outlook improve. Fundamentals remain strong. See the latest FSU analysis for more details and a new annotated graph.
>>> FEATURED STOCK ARTICLE : Damaging Streak of Losses Violated 50-Day Moving Average Line - 9/22/2023 |
View all notes |
Set NEW NOTE alert |
Company Profile |
SEC
News |
Chart |
Request a new note
C
A
S
I |
Symbol/Exchange
Company Name
Industry Group |
PRICE |
CHANGE
(%Change) |
Day High |
Volume
(% DAV)
(% 50 day avg vol) |
52 Wk Hi
% From Hi |
Featured
Date |
Price
Featured |
Pivot Featured |
|
Max Buy |
COKE
-
NASDAQ
Coca-Cola Consolidated
Beverages-Non-Alcoholic
|
$655.26
|
+2.43
0.37% |
$670.67
|
26,298
64.14% of 50 DAV
50 DAV is 41,000
|
$745.53
-12.11%
|
8/3/2023
|
$718.56
|
PP = $694.30
|
|
MB = $729.02
|
Most Recent Note - 9/21/2023 5:03:08 PM
G - Suffered a loss today with light volume. Recently sputtering below its 50 DMA line ($671) after volume-driven losses. Only a prompt rebound above the 50 DMA line would help its outlook improve.
>>> FEATURED STOCK ARTICLE : Rebounded Above 50-Day Moving Average - 9/11/2023 |
View all notes |
Set NEW NOTE alert |
Company Profile |
SEC
News |
Chart |
Request a new note
C
A
S
I |
PLUS
-
NASDAQ
ePlus
Computer-Tech Services
|
$63.05
|
+1.05
1.69% |
$63.45
|
74,651
69.12% of 50 DAV
50 DAV is 108,000
|
$75.90
-16.93%
|
8/8/2023
|
$67.60
|
PP = $62.92
|
|
MB = $66.07
|
Most Recent Note - 9/21/2023 5:23:05 PM
Y - Volume totals have been cooling while still testing support near the recent low and 50 DMA line in the $61 area. More damaging losses may trigger a technical sell signal.
>>> FEATURED STOCK ARTICLE : Still Consolidating Above 50 DMA Line - 9/12/2023 |
View all notes |
Set NEW NOTE alert |
Company Profile |
SEC
News |
Chart |
Request a new note
C
A
S
I |
|
|
|
THESE ARE NOT BUY RECOMMENDATIONS!
Comments contained in the body of this report are technical
opinions only. The material herein has been obtained
from sources believed to be reliable and accurate, however,
its accuracy and completeness cannot be guaranteed.
This site is not an investment advisor, hence it does
not endorse or recommend any securities or other investments.
Any recommendation contained in this report may not
be suitable for all investors and it is not to be deemed
an offer or solicitation on our part with respect to
the purchase or sale of any securities. All trademarks,
service marks and trade names appearing in this report
are the property of their respective owners, and are
likewise used for identification purposes only.
This report is a service available
only to active Paid Premium Members.
You may opt-out of receiving report notifications
at any time. Questions or comments may be submitted
by writing to Premium Membership Services 665 S.E. 10 Street, Suite 201 Deerfield Beach, FL 33441-5634 or by calling 1-800-965-8307
or 954-785-1121.
|
|
|