You are not logged in.
This means you
CAN ONLY VIEW reports that were published prior to Tuesday, April 8, 2025.
You
MUST UPGRADE YOUR MEMBERSHIP if you want to see any current reports.
AFTER MARKET UPDATE - FRIDAY, SEPTEMBER 2ND, 2016
Previous After Market Report Next After Market Report >>>
|
|
|
|
DOW |
+72.66 |
18,491.96 |
+0.39% |
|
Volume |
782,455,800 |
-3% |
|
Volume |
1,373,794,240 |
-5% |
|
NASDAQ |
+22.69 |
5,249.90 |
+0.43% |
|
Advancers |
2,403 |
81% |
|
Advancers |
1,943 |
69% |
|
S&P 500 |
+9.12 |
2,179.98 |
+0.42% |
|
Decliners |
567 |
19% |
|
Decliners |
856 |
31% |
|
Russell 2000 |
+12.03 |
1,251.83 |
+0.97% |
|
52 Wk Highs |
100 |
|
|
52 Wk Highs |
178 |
|
|
S&P 600 |
+8.76 |
761.87 |
+1.16% |
|
52 Wk Lows |
22 |
|
|
52 Wk Lows |
22 |
|
|
 |
Mid Cap and Small Cap Indexes Hit New Record Highs
Kenneth J. Gruneisen - Passed the CAN SLIM® Master's Exam
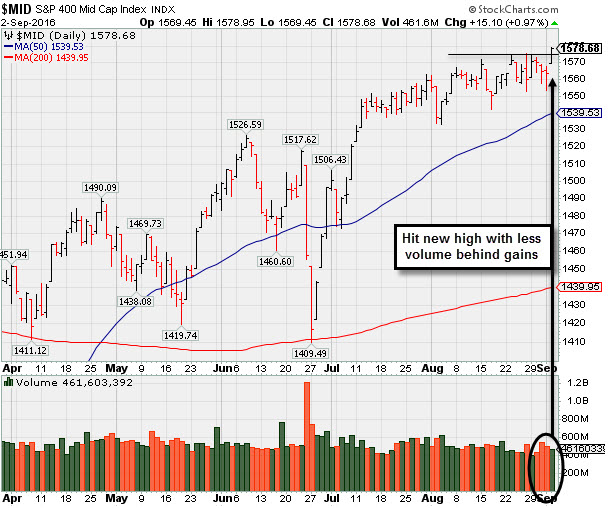
For the week, the Dow was up 0.5%, the S&P added 0.5%, and the Nasdaq gained 0.6%. Stocks finished higher on Friday. The Dow was up 72 points to 18491. The S&P 500 added 9 points to 2179 and the Nasdaq Composite gained 22 points to 5249. The S&P 600 Small Cap Index quietly hit a new record high. The volume totals were lighter than the prior session on the NYSE and on the Nasdaq exchange as traders headed out early for the long Labor Day weekend. Breadth was positive as advancers led decliners by a 4-1 margin on the NYSE and better than 2-1 on the Nasdaq exchange. There were 68 high-ranked companies from the Leaders List that made new 52-week highs and were listed on the BreakOuts Page, versus the total of 29 on the prior session. New 52-week highs totals expanded and solidly outnumbered new 52-week lows on both the NYSE and the Nasdaq exchange. PICTURED: The S&P 400 Mid Cap Index hit a new record high with Friday's gains on lighter volume.
The "confirmed uptrend" for the market (M criteria) endured some distributional pressure, however the Dow Jones Industrial Average found support above its 50-day moving average (DMA) line. A healthy crop of leading stocks remains hitting new 52-week highs. The Featured Stocks Page lists noteworthy candidates that have made headway. The S&P 500 snapped its two-week losing streak on Friday following a weaker-than-expected jobs report. Non-farm payrolls grew 151,000 in August versus a projected 180,000 increase. The labor force participation rate was unchanged at 62.8% while the unemployment rate remained steady at 4.9%. According to Bloomberg data, futures are currently pricing 30% probability of a rate hike in September versus 34% odds before the jobs data. All 11 sectors in the S&P 500 finished positive on the session with Utilities leading the advance as American Water Works (AWK +1.96%) rose. In Health Care, Biogen (BIIB +2.47%) rose with news the FDA granted fast track designation for its Alzheimer’s drug. On the earnings front, Lululemon (LULU -10.55%) fell after the yoga wear retailer provided weaker-than-expected forward guidance. Shares of Broadcom (AVGO -2.25%) were lower as the chipmaker’s wired infrastructure business fell short of estimates. The Treasury yield curve steepened on the session after the labor report with the benchmark 10-year note down 11/32 to yield 1.60%. In commodities, NYMEX WTI crude rebounded 2.5% to $44.25/barrel, after Vladimir Putin expressed optimism concerning a potential output freeze. COMEX gold gained 0.9% to $1325.100/ounce. In FOREX, the Dollar Index advanced 0.2%. |
 Kenneth J. Gruneisen started out as a licensed stockbroker in August 1987, a couple of months prior to the historic stock market crash that took the Dow Jones Industrial Average down -22.6% in a single day. He has published daily fact-based fundamental and technical analysis on high-ranked stocks online for two decades. Through FACTBASEDINVESTING.COM, Kenneth provides educational articles, news, market commentary, and other information regarding proven investment systems that work in good times and bad.
Comments contained in the body of this report are technical opinions only and are not necessarily those of Gruneisen Growth Corp. The material herein has been obtained from sources believed to be reliable and accurate, however, its accuracy and completeness cannot be guaranteed. Our firm, employees, and customers may effect transactions, including transactions contrary to any recommendation herein, or have positions in the securities mentioned herein or options with respect thereto. Any recommendation contained in this report may not be suitable for all investors and it is not to be deemed an offer or solicitation on our part with respect to the purchase or sale of any securities. |
|
 |
Financial, Retail and Commodity-Linked Groups Rose
Kenneth J. Gruneisen - Passed the CAN SLIM® Master's Exam
The Broker/Dealer Index ($XBD +0.82%) and Bank Index ($BKX +1.40%) both rose on Friday The tech sector was mixed as the Networking Index ($NWX +0.59%) edged higher but the Semiconductor Index ($SOX -0.17%) and the Biotechnology Index ($BTK -0.02%) both sputtered. The Retail Index ($RLX +0.29%) also eked out a small gain. The Gold & Silver Index ($XAU +3.55%) rallied along with energy-linked groups as the Oil Services Index ($OSX +0.73%) and the Integrated Oil Index ($XOI +1.43%) both tallied gains. Charts courtesy www.stockcharts.com
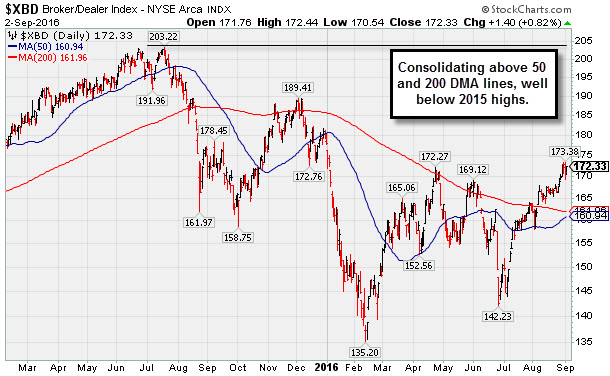
PICTURED: The Broker/Dealer Index ($XBD +1.40%) is consolidating above its 50-day and 200-day moving average (DMA) lines but well below its 2015 record high.
| Oil Services |
$OSX |
155.94 |
+1.14 |
+0.74% |
-1.13% |
| Integrated Oil |
$XOI |
1,135.53 |
+16.05 |
+1.43% |
+5.86% |
| Semiconductor |
$SOX |
806.95 |
-1.41 |
-0.17% |
+21.62% |
| Networking |
$NWX |
400.40 |
+2.35 |
+0.59% |
+6.51% |
| Broker/Dealer |
$XBD |
172.33 |
+1.40 |
+0.82% |
-3.23% |
| Retail |
$RLX |
1,349.52 |
+3.89 |
+0.29% |
+5.15% |
| Gold & Silver |
$XAU |
96.63 |
+3.31 |
+3.55% |
+113.31% |
| Bank |
$BKX |
72.55 |
+0.35 |
+0.48% |
-0.73% |
| Biotech |
$BTK |
3,250.52 |
-0.75 |
-0.02% |
-14.77% |
|
|
|
 |
Seriously Applying the Fact-Based System Now
Kenneth J. Gruneisen - Passed the CAN SLIM® Master's Exam
Asset Management Services Using the Winning Fact-Based Investment System - Inquire Now! You can have professional help in limiting your losses and maximizing your gains in all market environments. For help with how your portfolio is managed in 2016 and beyond click here and indicate "Find a Broker". *Accounts over $250,000 please. **Serious inquires only, please. |
|
|
Color Codes Explained :
Y - Better candidates highlighted by our
staff of experts.
G - Previously featured
in past reports as yellow but may no longer be buyable under the
guidelines.
***Last / Change / Volume data in this table is the closing quote data***
Symbol/Exchange
Company Name
Industry Group |
PRICE |
CHANGE
(%Change) |
Day High |
Volume
(% DAV)
(% 50 day avg vol) |
52 Wk Hi
% From Hi |
Featured
Date |
Price
Featured |
Pivot Featured |
|
Max Buy |
TDG
-
NYSE
Transdigm Group Inc
AEROSPACE/DEFENSE - Aerospace/Defense Products and; Services
|
$288.36
|
+0.95
0.33% |
$290.85
|
229,687
61.25% of 50 DAV
50 DAV is 375,000
|
$289.96
-0.55%
|
5/11/2016
|
$248.33
|
PP = $245.00
|
|
MB = $257.25
|
Most Recent Note - 8/29/2016 4:02:29 PM
G - Volume has been drying up while hovering in a tight range, and today's light volume gain led to a best-ever close. Its 50 DMA line and prior highs near $268 define important near-term support to watch on pullbacks.
>>> FEATURED STOCK ARTICLE : Gains Lack Great Volume While Wedging to New Highs - 7/27/2016 |
View all notes |
Set NEW NOTE alert |
Company Profile |
SEC
News |
Chart |
Request a new note
C
A
S
I |
IESC
-
NASDAQ
I E S Holdings Inc
Bldg-Maintenance and Svc
|
$17.79
|
+0.58
3.37% |
$17.83
|
73,569
73.57% of 50 DAV
50 DAV is 100,000
|
$18.12
-1.82%
|
7/26/2016
|
$15.79
|
PP = $15.74
|
|
MB = $16.53
|
 Most Recent Note - 9/2/2016 3:21:41 PM
G - Rising near its best-ever close and well above its "max buy" level. Its 50 DMA line and the recent low (13.50 on 8/02/16) define important near-term support to watch on pullbacks. See the latest FSU analysis for more details and an annotated graph.
>>> FEATURED STOCK ARTICLE : Strength Returned With Heavier Volume Gains for Highs - 8/30/2016 |
View all notes |
Set NEW NOTE alert |
Company Profile |
SEC
News |
Chart |
Request a new note
C
A
S
I |
NTES
-
NASDAQ
Netease Inc Adr
INTERNET - Internet Information Providers
|
$214.91
|
-1.00
-0.46% |
$218.37
|
1,547,380
137.67% of 50 DAV
50 DAV is 1,124,000
|
$218.77
-1.76%
|
6/29/2016
|
$182.42
|
PP = $186.55
|
|
MB = $195.88
|
Most Recent Note - 9/1/2016 5:35:40 PM
G - Rose near its all-time high with today's gain on near average volume. It is extended from any sound base. Its 50 DMA line ($199) defines near-term support above prior highs in the $186 area.
>>> FEATURED STOCK ARTICLE : Pulled Back on Higher Volume Following Earnings Report - 8/18/2016 |
View all notes |
Set NEW NOTE alert |
Company Profile |
SEC
News |
Chart |
Request a new note
C
A
S
I |
HTHT
-
NASDAQ
China Lodging Group Ads
LEISURE - Lodging
|
$45.14
|
+0.14
0.31% |
$45.37
|
89,605
38.13% of 50 DAV
50 DAV is 235,000
|
$47.72
-5.41%
|
7/13/2016
|
$38.87
|
PP = $39.29
|
|
MB = $41.25
|
Most Recent Note - 8/30/2016 6:00:20 PM
G - Pulled back today with lighter (near average) volume. Extended from any sound base after rallying well above its "max buy" level. Prior highs and its 50 DMA line define near term support to watch on pullbacks.
>>> FEATURED STOCK ARTICLE : Volume-Driven Gains for New Highs Signal Institutional Demand - 8/17/2016 |
View all notes |
Set NEW NOTE alert |
Company Profile |
SEC
News |
Chart |
Request a new note
C
A
S
I |
MXL
-
NYSE
Maxlinear Inc Cl A
Telecom-Infrastructure
|
$19.88
|
+0.36
1.84% |
$19.90
|
978,213
69.13% of 50 DAV
50 DAV is 1,415,000
|
$22.50
-11.64%
|
5/16/2016
|
$19.24
|
PP = $19.20
|
|
MB = $20.16
|
Most Recent Note - 9/1/2016 5:33:35 PM
G - Rebounded to its 50 DMA line ($19.55) which may act as resistance. Its 200 DMA line and prior lows in the $17 area define the next important support level where violations would raise serious concerns. See the latest FSU analysis for more details and a new annotated graph.
>>> FEATURED STOCK ARTICLE : Rebound to 50-Day Moving Average After Abrupt Drop to 200-Day Line - 9/1/2016 |
View all notes |
Set NEW NOTE alert |
Company Profile |
SEC
News |
Chart |
Request a new note
C
A
S
I |
Symbol/Exchange
Company Name
Industry Group |
PRICE |
CHANGE
(%Change) |
Day High |
Volume
(% DAV)
(% 50 day avg vol) |
52 Wk Hi
% From Hi |
Featured
Date |
Price
Featured |
Pivot Featured |
|
Max Buy |
PATK
-
NASDAQ
Patrick Industries Inc
WHOLESALE - Building Materials Wholesale
|
$66.11
|
+1.55
2.40% |
$66.20
|
166,240
74.88% of 50 DAV
50 DAV is 222,000
|
$69.53
-4.92%
|
5/24/2016
|
$53.45
|
PP = $50.68
|
|
MB = $53.21
|
Most Recent Note - 9/2/2016 3:24:16 PM
G - Quietly consolidating above the 50 DMA line ($63.30) and latest low ($59.51 on 8/16/16). Subsequent violations may raise concerns and trigger technical sell signals, meanwhile it may be forming a new base. See the latest FSU analysis for additional details and an annotated graph.
>>> FEATURED STOCK ARTICLE : Building a New Base Above 50-Day Moving Average Line - 8/31/2016 |
View all notes |
Set NEW NOTE alert |
Company Profile |
SEC
News |
Chart |
Request a new note
C
A
S
I |
FBHS
-
NYSE
Fortune Brands Hme & Sec
Bldg-Constr Prds/Misc
|
$63.79
|
-0.04
-0.06% |
$64.11
|
921,096
48.43% of 50 DAV
50 DAV is 1,902,000
|
$64.47
-1.05%
|
6/22/2016
|
$57.71
|
PP = $60.08
|
|
MB = $63.08
|
Most Recent Note - 9/1/2016 5:38:12 PM
G - Finished near the session high with today's gain backed by light volume. Volume totals have been cooling while stubbornly holding its ground in a tight range near its 52-week high. Prior highs and its 50 DMA line define near-term support in the $60-61 area.
>>> FEATURED STOCK ARTICLE : Perched Above "Max Buy" Level Following Volume-Driven Gain - 8/1/2016 |
View all notes |
Set NEW NOTE alert |
Company Profile |
SEC
News |
Chart |
Request a new note
C
A
S
I |
LGIH
-
NASDAQ
L G I Homes Inc
Bldg-Resident/Comml
|
$38.22
|
-0.37
-0.96% |
$38.95
|
300,622
56.51% of 50 DAV
50 DAV is 532,000
|
$39.23
-2.57%
|
8/29/2016
|
$37.08
|
PP = $36.44
|
|
MB = $38.26
|
Most Recent Note - 9/2/2016 3:27:08 PM
Y - Stubbornly holding its ground near its "max buy" level following considerable volume-driven gains for new highs. Highlighted in yellow in the 8/29/16 mid-day report with pivot point cited based on its 7/26/16 high, clearing a long cup-with-handle base and triggering a technical buy signal. Fundamentals remain strong. Group Relative Strength Rating of 62 reveals mediocre leadership (L criteria) in the industry group. Reported +45% earnings on +40% sales revenues for the second quarter ended June 30, 2016 versus the year ago period. See the latest FSU analysis for more details and an annotated graph.
>>> FEATURED STOCK ARTICLE : Finished Strong While Rallying From Cup-With-Handle Base - 8/29/2016 |
View all notes |
Set NEW NOTE alert |
Company Profile |
SEC
News |
Chart |
Request a new note
C
A
S
I |
NVEE
-
NASDAQ
N V 5 Global Inc
Comml Svcs-Consulting
|
$31.45
|
+0.16
0.51% |
$31.63
|
26,214
29.79% of 50 DAV
50 DAV is 88,000
|
$37.00
-15.00%
|
4/19/2016
|
$28.20
|
PP = $28.10
|
|
MB = $29.51
|
Most Recent Note - 9/1/2016 5:37:16 PM
G - Rebounded near its 50 DMA line ($31.33) with today's gain on near average volume. Prior highs in the $30 area also define important near-term support. More damaging losses may trigger worrisome technical sell signals.
>>> FEATURED STOCK ARTICLE : Technically Strong Despite Fundamental Concerns - 8/22/2016 |
View all notes |
Set NEW NOTE alert |
Company Profile |
SEC
News |
Chart |
Request a new note
C
A
S
I |
SFBS
-
NASDAQ
Servisfirst Bancshares
BANKING - Regional - Southeast Banks
|
$53.14
|
+0.73
1.39% |
$53.15
|
59,186
66.50% of 50 DAV
50 DAV is 89,000
|
$53.58
-0.82%
|
7/19/2016
|
$53.28
|
PP = $52.82
|
|
MB = $55.46
|
Most Recent Note - 8/31/2016 2:42:59 PM
Y - Still quietly consolidating within close striking distance of its 52-week high. Members were previously reminded - "A volume-driven gain and strong close above the pivot point are needed to clinch a convincing technical buy signal. It has been quietly consolidating since highlighted in yellow in the 7/19/16 mid-day report with pivot point cited based on the 6/01/16 high plus 10 cents."
>>> FEATURED STOCK ARTICLE : Still Consolidating Within Close Striking Distance of New Highs - 8/25/2016 |
View all notes |
Set NEW NOTE alert |
Company Profile |
SEC
News |
Chart |
Request a new note
C
A
S
I |
Symbol/Exchange
Company Name
Industry Group |
PRICE |
CHANGE
(%Change) |
Day High |
Volume
(% DAV)
(% 50 day avg vol) |
52 Wk Hi
% From Hi |
Featured
Date |
Price
Featured |
Pivot Featured |
|
Max Buy |
INGN
-
NASDAQ
Inogen Inc
HEALTH SERVICES - Medical Instruments and Supplies
|
$58.11
|
+0.16
0.28% |
$58.50
|
121,832
56.67% of 50 DAV
50 DAV is 215,000
|
$59.00
-1.51%
|
8/5/2016
|
$51.72
|
PP = $56.08
|
|
MB = $58.88
|
Most Recent Note - 8/29/2016 4:04:33 PM
Y - Posted a gain with light volume today and matched its best-ever close after touching a new 52-week high. Stalled after its 8/09/16 volume-driven gain triggered a technical buy signal.
>>> FEATURED STOCK ARTICLE : Perched Within Striking Distance of Highs Following Rebound - 8/5/2016 |
View all notes |
Set NEW NOTE alert |
Company Profile |
SEC
News |
Chart |
Request a new note
C
A
S
I |
OLLI
-
NASDAQ
Ollie's Bargain Outlet
Retail-DiscountandVariety
|
$27.48
|
-0.18
-0.65% |
$27.87
|
598,022
86.05% of 50 DAV
50 DAV is 695,000
|
$28.72
-4.32%
|
7/19/2016
|
$26.42
|
PP = $28.82
|
|
MB = $30.26
|
Most Recent Note - 9/1/2016 12:23:55 PM
Y - Reported earnings +50% on +16% sales revenues for the Jul '16 quarter. Gapped up today promptly rebounding above its 50 DMA line with a considerable volume-driven gain helping its outlook improve and its color code is changed to yellow. Members were repeatedly reminded in prior notes - "Volume-driven gains above the pivot point are still needed to trigger a convincing technical buy signal."
>>> FEATURED STOCK ARTICLE : Near High Awaiting Volume-Driven Gain to Trigger Technical Buy Signal - 8/24/2016 |
View all notes |
Set NEW NOTE alert |
Company Profile |
SEC
News |
Chart |
Request a new note
C
A
S
I |
|
|
|
THESE ARE NOT BUY RECOMMENDATIONS!
Comments contained in the body of this report are technical
opinions only. The material herein has been obtained
from sources believed to be reliable and accurate, however,
its accuracy and completeness cannot be guaranteed.
This site is not an investment advisor, hence it does
not endorse or recommend any securities or other investments.
Any recommendation contained in this report may not
be suitable for all investors and it is not to be deemed
an offer or solicitation on our part with respect to
the purchase or sale of any securities. All trademarks,
service marks and trade names appearing in this report
are the property of their respective owners, and are
likewise used for identification purposes only.
This report is a service available
only to active Paid Premium Members.
You may opt-out of receiving report notifications
at any time. Questions or comments may be submitted
by writing to Premium Membership Services 665 S.E. 10 Street, Suite 201 Deerfield Beach, FL 33441-5634 or by calling 1-800-965-8307
or 954-785-1121.
|
|
|