You are not logged in.
This means you
CAN ONLY VIEW reports that were published prior to Monday, April 7, 2025.
You
MUST UPGRADE YOUR MEMBERSHIP if you want to see any current reports.
AFTER MARKET UPDATE - TUESDAY, AUGUST 30TH, 2016
Previous After Market Report Next After Market Report >>>
|
|
|
|
DOW |
-48.69 |
18,454.30 |
-0.26% |
|
Volume |
736,011,250 |
+15% |
|
Volume |
1,430,131,040 |
+10% |
|
NASDAQ |
-9.34 |
5,222.99 |
-0.18% |
|
Advancers |
1,442 |
49% |
|
Advancers |
1,501 |
53% |
|
S&P 500 |
-4.26 |
2,176.12 |
-0.20% |
|
Decliners |
1,501 |
51% |
|
Decliners |
1,343 |
47% |
|
Russell 2000 |
+1.09 |
1,246.03 |
+0.09% |
|
52 Wk Highs |
162 |
|
|
52 Wk Highs |
176 |
|
|
S&P 600 |
+0.28 |
756.46 |
+0.04% |
|
52 Wk Lows |
6 |
|
|
52 Wk Lows |
34 |
|
|
 |
Major Indices Fell With Higher Volume
Kenneth J. Gruneisen - Passed the CAN SLIM® Master's Exam
Stocks finished lower on Tuesday. The Dow was down 48 points to 18454. The S&P 500 lost 4 points to 2176 and the Nasdaq Composite fell 9 points to 5222. Behind the losses the volume totals were higher than the prior session on the NYSE and on the Nasdaq exchange, indicating more distributional pressure. Advancers and decliners were evenly mixed on the NYSE and on the Nasdaq exchange. There were 46 high-ranked companies from the Leaders List that made new 52-week highs and were listed on the BreakOuts Page, versus the total of 47 on the prior session. New 52-week highs totals solidly outnumbered new 52-week lows on both the NYSE and the Nasdaq exchange. PICTURED: The Dow Jones Industrial Average is consolidating above the 50-day moving average (DMA) line and prior lows.
The "confirmed uptrend" for the market (M criteria) has recently encountered some distributional pressure. See the Featured Stocks Page which now lists a few noteworthy candidates that have made headway. The major averages declined on Tuesday as investors digested mixed economic releases and looked ahead to this week’s employment reports. On the data front, the Case-Shiller Index showed home prices in 20 U.S. cities increased 5.1% year-over-year in June, the slowest pace since last August. In a separate release, consumer sentiment rose in August to its highest level in 11 months. In M&A news, Hershey (HSY -10.76%) fell after Mondelez (MDLZ +3.95%) ended discussions of a potential merger with the chocolate company. Nine of 10 sectors in the S&P 500 finished in negative territory. In earnings, G-III Apparel (GIII -20.66%) tumbled as the retailer lowered its revenue outlook. In Tech, shares of Apple (AAPL -0.77) edged lower after the company was ordered to repay 13 billion euros ($14.5 billion) in back taxes to the Irish government. United Continental (UAL +8.60%) was a notable gainer as the airline announced the hiring of the No. 2 executive at rival American Airlines (AAL +2.42%). Treasuries finished mostly lower with the benchmark 10-year note down 2/32 to yield 1.56%. In commodities, NYMEX WTI crude declined 1.1% to $46.48/barrel. COMEX gold fell 1% to 1309.90/ounce. In FOREX, the Dollar Index advanced 0.5%. |
 Kenneth J. Gruneisen started out as a licensed stockbroker in August 1987, a couple of months prior to the historic stock market crash that took the Dow Jones Industrial Average down -22.6% in a single day. He has published daily fact-based fundamental and technical analysis on high-ranked stocks online for two decades. Through FACTBASEDINVESTING.COM, Kenneth provides educational articles, news, market commentary, and other information regarding proven investment systems that work in good times and bad.
Comments contained in the body of this report are technical opinions only and are not necessarily those of Gruneisen Growth Corp. The material herein has been obtained from sources believed to be reliable and accurate, however, its accuracy and completeness cannot be guaranteed. Our firm, employees, and customers may effect transactions, including transactions contrary to any recommendation herein, or have positions in the securities mentioned herein or options with respect thereto. Any recommendation contained in this report may not be suitable for all investors and it is not to be deemed an offer or solicitation on our part with respect to the purchase or sale of any securities. |
|
 |
Financials and Networking Index Bucked Widespread Weakness
Kenneth J. Gruneisen - Passed the CAN SLIM® Master's Exam
The Retail Index ($RLX -0.82%) fell while the Broker/Dealer Index ($XBD +1.63%) and Bank Index ($BKX +1.21%) both helped to offset broader pressures on the major averages Tuesday. The Gold & Silver Index ($XAU -5.25%) was a standout decliner and energy-linked groups were weak as the Oil Services Index ($OSX -1.06%) and the Integrated Oil Index ($XOI -0.23%) both edged lower. The Biotechnology Index ($BTK -0.68%) edged lower while the Semiconductor Index ($SOX -0.19%) also suffered a small loss. Charts courtesy www.stockcharts.com
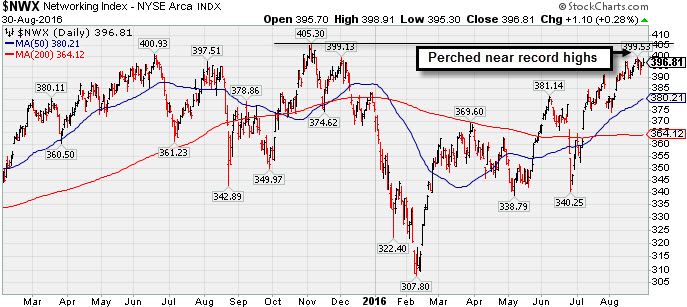
PICTURED: The Networking Index ($NWX +0.28%) bucked the pressure and edged higher. It is consolidating near record highs.
| Oil Services |
$OSX |
159.14 |
-1.71 |
-1.06% |
+0.89% |
| Integrated Oil |
$XOI |
1,145.31 |
-2.67 |
-0.23% |
+6.77% |
| Semiconductor |
$SOX |
802.07 |
-1.55 |
-0.19% |
+20.89% |
| Networking |
$NWX |
396.81 |
+1.10 |
+0.28% |
+5.55% |
| Broker/Dealer |
$XBD |
172.64 |
+2.76 |
+1.63% |
-3.06% |
| Retail |
$RLX |
1,345.82 |
-11.07 |
-0.82% |
+4.86% |
| Gold & Silver |
$XAU |
91.84 |
-5.09 |
-5.25% |
+102.74% |
| Bank |
$BKX |
72.48 |
+0.87 |
+1.21% |
-0.82% |
| Biotech |
$BTK |
3,266.00 |
-22.29 |
-0.68% |
-14.37% |
|
|
|
 |
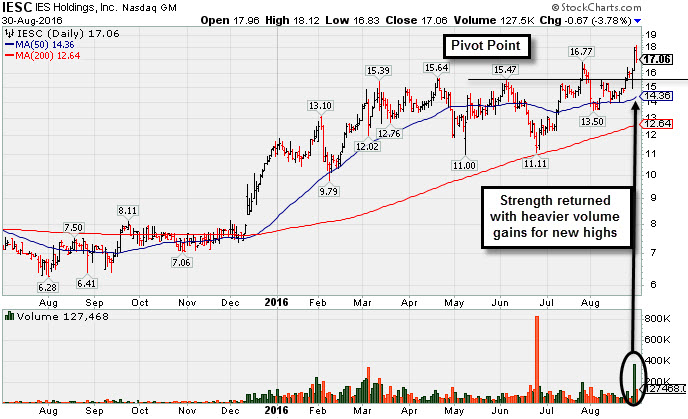
Strength Returned With Heavier Volume Gains for Highs
Kenneth J. Gruneisen - Passed the CAN SLIM® Master's Exam
I E S Holdings Inc (IESC -$0.67 or -3.78% to $17.06) pulled back today after hitting new highs above its "max buy" level with a considerable gain backed by +270% above average volume on the prior session. Members were recently reminded - "Under the fact-based system a stock which was previously sold can be bought back again if strength returns." The usual sell rules apply if a stock is repurchased, and in the Certification the teach investors to make a 10% larger purchase than on the prior entry.
IESC was last shown in this FSU section on 7/26/16 with an annotated graph under the headline, "Volume-Driven Gain for New Highs Clinched Technical Buy Signal". It cleared the pivot point cited based on its 4/20/16 high plus 10 cents. Subsequent losses raised concerns for investors and likely triggered the fact-based investment system's sell rule at -7% from the purchase price. It slumped in the prior base and undercut its 50-day moving average (DMA) line before finding support. It gapped up on 8/08/16.
The high-ranked Building - Maintenance & Service firm reported Jun '16 quarterly earnings +79% on +25% sales revenues, continuing its strong earnings track record. That marked its 4th consecutive quarterly earnings increase above the +25% minimum earnings guideline in addition to the fact its sales revenues growth rate showed encouraging acceleration, helping it better match the fact-based investment system's guidelines. Annual earnings (A criteria) growth has been strong for the past 3 years.
Today it has a Timeliness rating of A, but its Sponsorship rating is currently a D. It found support at its 200-day moving average (DMA) line and rebounded after previously dropped from the Featured Stocks list on 6/21/16. The number of top rated funds owning its shares rose from 52 in Jun '15 to 115 in Jun '16, a reassuring sign concerning the I criteria. Its small supply of only 7.51 million shares (S criteria) in the public float can contribute to greater price volatility in the event of institutional buying or selling
|
|
|
Color Codes Explained :
Y - Better candidates highlighted by our
staff of experts.
G - Previously featured
in past reports as yellow but may no longer be buyable under the
guidelines.
***Last / Change / Volume data in this table is the closing quote data***
Symbol/Exchange
Company Name
Industry Group |
PRICE |
CHANGE
(%Change) |
Day High |
Volume
(% DAV)
(% 50 day avg vol) |
52 Wk Hi
% From Hi |
Featured
Date |
Price
Featured |
Pivot Featured |
|
Max Buy |
TDG
-
NYSE
Transdigm Group Inc
AEROSPACE/DEFENSE - Aerospace/Defense Products and; Services
|
$287.22
|
-1.95
-0.67% |
$289.96
|
251,307
64.60% of 50 DAV
50 DAV is 389,000
|
$289.67
-0.85%
|
5/11/2016
|
$248.33
|
PP = $245.00
|
|
MB = $257.25
|
Most Recent Note - 8/29/2016 4:02:29 PM
G - Volume has been drying up while hovering in a tight range, and today's light volume gain led to a best-ever close. Its 50 DMA line and prior highs near $268 define important near-term support to watch on pullbacks.
>>> FEATURED STOCK ARTICLE : Gains Lack Great Volume While Wedging to New Highs - 7/27/2016 |
View all notes |
Set NEW NOTE alert |
Company Profile |
SEC
News |
Chart |
Request a new note
C
A
S
I |
IESC
-
NASDAQ
I E S Holdings Inc
Bldg-Maintenance and Svc
|
$17.06
|
-0.67
-3.78% |
$18.12
|
127,426
126.16% of 50 DAV
50 DAV is 101,000
|
$18.00
-5.23%
|
7/26/2016
|
$15.79
|
PP = $15.74
|
|
MB = $16.53
|
 Most Recent Note - 8/30/2016 5:57:59 PM
G - Pulled back today after hitting new highs well above its "max buy" level. Under the fact-based system a stock which was previously sold can be bought back again if strength returns. its 50 DMA line and the recent low (13.50 on 8/02/16) define important near-term support. See the latest FSU analysis for more details and a new annotated graph.
>>> FEATURED STOCK ARTICLE : Strength Returned With Heavier Volume Gains for Highs - 8/30/2016 |
View all notes |
Set NEW NOTE alert |
Company Profile |
SEC
News |
Chart |
Request a new note
C
A
S
I |
NTES
-
NASDAQ
Netease Inc Adr
INTERNET - Internet Information Providers
|
$211.00
|
-2.57
-1.20% |
$215.67
|
1,008,592
90.62% of 50 DAV
50 DAV is 1,113,000
|
$218.77
-3.55%
|
6/29/2016
|
$182.42
|
PP = $186.55
|
|
MB = $195.88
|
Most Recent Note - 8/26/2016 5:42:57 PM
G - Hit a new all-time high and finished strong with today's gain on near average volume, getting more extended from any sound base. Its 50 DMA line ($195) and prior highs near $186 define support to watch on pullbacks.
>>> FEATURED STOCK ARTICLE : Pulled Back on Higher Volume Following Earnings Report - 8/18/2016 |
View all notes |
Set NEW NOTE alert |
Company Profile |
SEC
News |
Chart |
Request a new note
C
A
S
I |
HTHT
-
NASDAQ
China Lodging Group Ads
LEISURE - Lodging
|
$45.46
|
-1.44
-3.07% |
$46.97
|
222,341
94.61% of 50 DAV
50 DAV is 235,000
|
$47.72
-4.74%
|
7/13/2016
|
$38.87
|
PP = $39.29
|
|
MB = $41.25
|
Most Recent Note - 8/30/2016 6:00:20 PM
G - Pulled back today with lighter (near average) volume. Extended from any sound base after rallying well above its "max buy" level. Prior highs and its 50 DMA line define near term support to watch on pullbacks.
>>> FEATURED STOCK ARTICLE : Volume-Driven Gains for New Highs Signal Institutional Demand - 8/17/2016 |
View all notes |
Set NEW NOTE alert |
Company Profile |
SEC
News |
Chart |
Request a new note
C
A
S
I |
MXL
-
NYSE
Maxlinear Inc Cl A
Telecom-Infrastructure
|
$19.04
|
-0.15
-0.78% |
$19.40
|
770,121
55.09% of 50 DAV
50 DAV is 1,398,000
|
$22.50
-15.38%
|
5/16/2016
|
$19.24
|
PP = $19.20
|
|
MB = $20.16
|
Most Recent Note - 8/26/2016 5:49:32 PM
G - A rebound above the 50 DMA line ($19.55) is needed for its outlook to improve. Its 200 DMA line and prior lows in the $17 area define the next important support level where violations would raise serious concerns.
>>> FEATURED STOCK ARTICLE : Consolidating Near Highs Above its "Max Buy" Level - 7/29/2016 |
View all notes |
Set NEW NOTE alert |
Company Profile |
SEC
News |
Chart |
Request a new note
C
A
S
I |
Symbol/Exchange
Company Name
Industry Group |
PRICE |
CHANGE
(%Change) |
Day High |
Volume
(% DAV)
(% 50 day avg vol) |
52 Wk Hi
% From Hi |
Featured
Date |
Price
Featured |
Pivot Featured |
|
Max Buy |
PATK
-
NASDAQ
Patrick Industries Inc
WHOLESALE - Building Materials Wholesale
|
$64.40
|
-0.05
-0.08% |
$64.99
|
145,082
65.95% of 50 DAV
50 DAV is 220,000
|
$69.53
-7.38%
|
5/24/2016
|
$53.45
|
PP = $50.68
|
|
MB = $53.21
|
Most Recent Note - 8/29/2016 5:56:59 PM
G - Posted a gain with higher (near average) volume while consolidating above the 50 DMA line ($62.64) and latest low ($59.51 on 8/16/16). Subsequent violations would raise concerns and trigger technical sell signals.
>>> FEATURED STOCK ARTICLE : Rallied +30% in 2 Months Since Breakout Was Featured - 7/28/2016 |
View all notes |
Set NEW NOTE alert |
Company Profile |
SEC
News |
Chart |
Request a new note
C
A
S
I |
FBHS
-
NYSE
Fortune Brands Hme & Sec
Bldg-Constr Prds/Misc
|
$63.66
|
-0.17
-0.27% |
$63.90
|
671,342
34.43% of 50 DAV
50 DAV is 1,950,000
|
$64.47
-1.26%
|
6/22/2016
|
$57.71
|
PP = $60.08
|
|
MB = $63.08
|
Most Recent Note - 8/26/2016 5:45:46 PM
G - Volume totals have been cooling while stubbornly holding its ground in a tight range near its 52-week high. Prior highs and its 50 DMA line define near-term support in the $60-61 area.
>>> FEATURED STOCK ARTICLE : Perched Above "Max Buy" Level Following Volume-Driven Gain - 8/1/2016 |
View all notes |
Set NEW NOTE alert |
Company Profile |
SEC
News |
Chart |
Request a new note
C
A
S
I |
LGIH
-
NASDAQ
L G I Homes Inc
Bldg-Resident/Comml
|
$38.89
|
+1.38
3.68% |
$39.23
|
1,067,668
204.53% of 50 DAV
50 DAV is 522,000
|
$37.68
3.21%
|
8/29/2016
|
$37.08
|
PP = $36.44
|
|
MB = $38.26
|
Most Recent Note - 8/30/2016 12:23:44 PM
Y - Rallying further today near its "max buy" level after finishing strong on the prior session. Highlighted in yellow in the 8/29/16 mid-day report with pivot point cited based on its 7/26/16 high, it hit a new 52-week high with +130% above average volume while rising from a 39-week long cup-with-handle base triggering a technical buy signal. Fundamentals remain strong. Group Relative Strength Rating of 62 reveals mediocre leadership (L criteria) in the industry group. Reported +45% earnings on +40% sales revenues for the second quarter ended June 30, 2016 versus the year ago period. See the latest FSU analysis for more details and an annotated graph.
>>> FEATURED STOCK ARTICLE : Finished Strong While Rallying From Cup-With-Handle Base - 8/29/2016 |
View all notes |
Set NEW NOTE alert |
Company Profile |
SEC
News |
Chart |
Request a new note
C
A
S
I |
NVEE
-
NASDAQ
N V 5 Global Inc
Comml Svcs-Consulting
|
$31.30
|
-0.15
-0.48% |
$31.56
|
41,826
47.53% of 50 DAV
50 DAV is 88,000
|
$37.00
-15.41%
|
4/19/2016
|
$28.20
|
PP = $28.10
|
|
MB = $29.51
|
Most Recent Note - 8/29/2016 4:09:29 PM
G - Sputtering near its 50 DMA line ($31.12) and prior highs in the $30 defining important near-term support. More damaging losses would raise concerns and trigger technical sell signals.
>>> FEATURED STOCK ARTICLE : Technically Strong Despite Fundamental Concerns - 8/22/2016 |
View all notes |
Set NEW NOTE alert |
Company Profile |
SEC
News |
Chart |
Request a new note
C
A
S
I |
SFBS
-
NASDAQ
Servisfirst Bancshares
BANKING - Regional - Southeast Banks
|
$52.40
|
+0.11
0.21% |
$52.45
|
40,193
44.66% of 50 DAV
50 DAV is 90,000
|
$53.58
-2.20%
|
7/19/2016
|
$53.28
|
PP = $52.82
|
|
MB = $55.46
|
Most Recent Note - 8/25/2016 5:04:41 PM
Y - Quietly consolidating within close striking distance of its 52-week high. Members were previously reminded - "A volume-driven gain and strong close above the pivot point are needed to clinch a convincing technical buy signal. It has been quietly consolidating since highlighted in yellow in the 7/19/16 mid-day report with pivot point cited based on the 6/01/16 high plus 10 cents." See the latest FSU analysis for more details and a new annotated graph.
>>> FEATURED STOCK ARTICLE : Still Consolidating Within Close Striking Distance of New Highs - 8/25/2016 |
View all notes |
Set NEW NOTE alert |
Company Profile |
SEC
News |
Chart |
Request a new note
C
A
S
I |
Symbol/Exchange
Company Name
Industry Group |
PRICE |
CHANGE
(%Change) |
Day High |
Volume
(% DAV)
(% 50 day avg vol) |
52 Wk Hi
% From Hi |
Featured
Date |
Price
Featured |
Pivot Featured |
|
Max Buy |
INGN
-
NASDAQ
Inogen Inc
HEALTH SERVICES - Medical Instruments and Supplies
|
$58.46
|
+0.11
0.19% |
$59.00
|
129,167
59.25% of 50 DAV
50 DAV is 218,000
|
$58.98
-0.88%
|
8/5/2016
|
$51.72
|
PP = $56.08
|
|
MB = $58.88
|
Most Recent Note - 8/29/2016 4:04:33 PM
Y - Posted a gain with light volume today and matched its best-ever close after touching a new 52-week high. Stalled after its 8/09/16 volume-driven gain triggered a technical buy signal.
>>> FEATURED STOCK ARTICLE : Perched Within Striking Distance of Highs Following Rebound - 8/5/2016 |
View all notes |
Set NEW NOTE alert |
Company Profile |
SEC
News |
Chart |
Request a new note
C
A
S
I |
OLLI
-
NASDAQ
Ollie's Bargain Outlet
Retail-DiscountandVariety
|
$25.72
|
-0.36
-1.38% |
$26.10
|
1,038,522
169.69% of 50 DAV
50 DAV is 612,000
|
$28.72
-10.45%
|
7/19/2016
|
$26.42
|
PP = $28.82
|
|
MB = $30.26
|
Most Recent Note - 8/30/2016 12:31:10 PM
G - Color code is changed to green while slumping below its 50 DMA line ($25.80) with today's 5th consecutive loss. Members were repeatedly reminded in prior notes - "Volume-driven gains above the pivot point are still needed to trigger a convincing technical buy signal." See the latest FSU analysis for additional details and an annotated graph.
>>> FEATURED STOCK ARTICLE : Near High Awaiting Volume-Driven Gain to Trigger Technical Buy Signal - 8/24/2016 |
View all notes |
Set NEW NOTE alert |
Company Profile |
SEC
News |
Chart |
Request a new note
C
A
S
I |
|
|
|
THESE ARE NOT BUY RECOMMENDATIONS!
Comments contained in the body of this report are technical
opinions only. The material herein has been obtained
from sources believed to be reliable and accurate, however,
its accuracy and completeness cannot be guaranteed.
This site is not an investment advisor, hence it does
not endorse or recommend any securities or other investments.
Any recommendation contained in this report may not
be suitable for all investors and it is not to be deemed
an offer or solicitation on our part with respect to
the purchase or sale of any securities. All trademarks,
service marks and trade names appearing in this report
are the property of their respective owners, and are
likewise used for identification purposes only.
This report is a service available
only to active Paid Premium Members.
You may opt-out of receiving report notifications
at any time. Questions or comments may be submitted
by writing to Premium Membership Services 665 S.E. 10 Street, Suite 201 Deerfield Beach, FL 33441-5634 or by calling 1-800-965-8307
or 954-785-1121.
|
|
|