You are not logged in.
This means you
CAN ONLY VIEW reports that were published prior to Monday, April 14, 2025.
You
MUST UPGRADE YOUR MEMBERSHIP if you want to see any current reports.
AFTER MARKET UPDATE - THURSDAY, JULY 28TH, 2016
Previous After Market Report Next After Market Report >>>
|
|
|
|
DOW |
-15.82 |
18,456.35 |
-0.09% |
|
Volume |
853,057,130 |
-11% |
|
Volume |
1,800,696,970 |
-7% |
|
NASDAQ |
+15.17 |
5,154.98 |
+0.30% |
|
Advancers |
1,527 |
52% |
|
Advancers |
1,381 |
47% |
|
S&P 500 |
+3.48 |
2,170.06 |
+0.16% |
|
Decliners |
1,429 |
48% |
|
Decliners |
1,577 |
53% |
|
Russell 2000 |
-1.60 |
1,217.33 |
-0.13% |
|
52 Wk Highs |
211 |
|
|
52 Wk Highs |
140 |
|
|
S&P 600 |
-2.45 |
742.86 |
-0.33% |
|
52 Wk Lows |
15 |
|
|
52 Wk Lows |
26 |
|
|
 |
Major Indices Ended Mixed With Volume Totals Lighter
Kenneth J. Gruneisen - Passed the CAN SLIM® Master's Exam
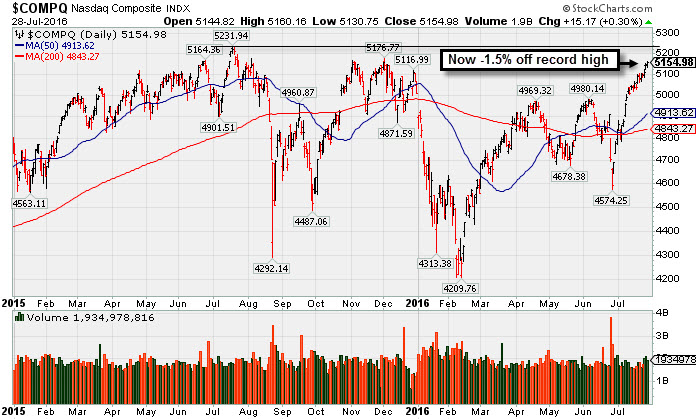
Stocks were broadly higher Thursday. The S&P 500 gained 3 points to 2170. The Nasdaq Composite advanced 15 points to 5154. The Dow fell 16 points to 18456. The benchmark S&P 500 Index and the Dow Jones Industrial Average both remain perched at record highs. Big gains for the major indices were noted in prior commentaries and that bullish action signaled a new "confirmed uptrend" for the market (M criteria). Volume totals were lighter than the prior session on the NYSE and on the Nasdaq exchange. Advancers led decliners by a narrow margin on the NYSE but decliners led advancers slightly on the Nasdaq exchange. There were 62 high-ranked companies from the Leaders List that made new 52-week highs and were listed on the BreakOuts Page, versus the total of 74 on the prior session. New 52-week highs outnumbered new 52-week lows on both the NYSE and the Nasdaq exchange. PICTURED: The Nasdaq Composite Index is perched -1.5% from its record high.
The U.S. equity market finished generally in positive territory amid another busy day of corporate earnings releases. Gains were muted as investors appeared cautious before the release of the second-quarter U.S. GDP figure Friday morning. A report before the open showed initial jobless claims increased 14,000 to 266,000 in the most recent week, slightly above the consensus estimate of 262,000. Shares of Ford (F -8.16%) fell after the automaker posted quarterly results below analyst projections. Facebook (FB +1.35%) rose as profits topped consensus forecasts. On the M&A front, NetSuite (N +18.39%) rose after agreeing to be bought by Oracle (ORCL +0.64%) for $9.3 billion. 6 of 10 sectors were up on the session. Utilities and Consumer Staples were the best performing groups. Dominion Resources (D +0.55%) inched higher. Shares of Hershey (HSY +2.92%) rose following a better-than-expected profit report. Telecom was down the most led by Level 3 Communications (LVLT -3.34%). Energy also provided a market headwind with Exxon (XOM -0.78%) amid a drop in oil prices. Treasuries were down with the 10-year note off 2/32 to yield 1.50%. In commodities, COMEX gold rose 0.5% to $1333.60/ounce. WTI crude fell to a three month low, losing 2.0% to $41.10/barrel. |
 Kenneth J. Gruneisen started out as a licensed stockbroker in August 1987, a couple of months prior to the historic stock market crash that took the Dow Jones Industrial Average down -22.6% in a single day. He has published daily fact-based fundamental and technical analysis on high-ranked stocks online for two decades. Through FACTBASEDINVESTING.COM, Kenneth provides educational articles, news, market commentary, and other information regarding proven investment systems that work in good times and bad.
Comments contained in the body of this report are technical opinions only and are not necessarily those of Gruneisen Growth Corp. The material herein has been obtained from sources believed to be reliable and accurate, however, its accuracy and completeness cannot be guaranteed. Our firm, employees, and customers may effect transactions, including transactions contrary to any recommendation herein, or have positions in the securities mentioned herein or options with respect thereto. Any recommendation contained in this report may not be suitable for all investors and it is not to be deemed an offer or solicitation on our part with respect to the purchase or sale of any securities. |
|
 |
Retail and Financial Groups Rose
Kenneth J. Gruneisen - Passed the CAN SLIM® Master's Exam
The Retail Index ($RLX +1.18%) rose and the Broker/Dealer Index ($XBD +0.84%) outpaced the Bank Index ($BKX +0.14%) while all gave a boost to the major averages on Thursday. The Biotechnology Index ($BTK -0.14%) and Semiconductor Index ($SOX -0.57%) both edged lower while the Networking Index ($NWX -2.06%) dragged the most on the tech sector. The Integrated Oil Index ($XOI -0.23%) and the Oil Services Index ($OSX -0.70%) both edged lower, and the Gold & Silver Index ($XAU +0.14%) posted a small gain. Charts courtesy www.stockcharts.com
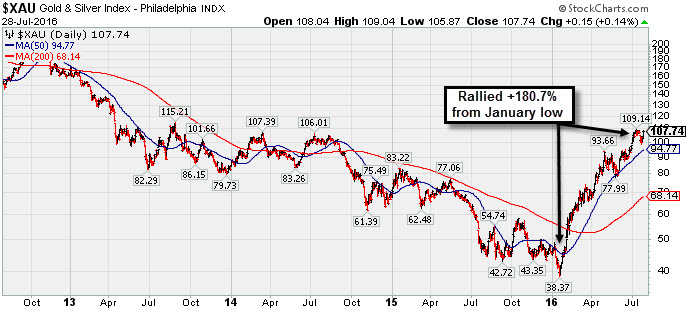
PICTURED: The Gold & Silver Index ($XAU +0.14%) is consolidating after rallying +180.7% from its January low.
| Oil Services |
$OSX |
158.76 |
-1.11 |
-0.69% |
+0.65% |
| Integrated Oil |
$XOI |
1,104.92 |
-2.56 |
-0.23% |
+3.00% |
| Semiconductor |
$SOX |
770.52 |
-4.41 |
-0.57% |
+16.13% |
| Networking |
$NWX |
378.75 |
-7.99 |
-2.06% |
+0.75% |
| Broker/Dealer |
$XBD |
163.76 |
+1.37 |
+0.84% |
-8.04% |
| Retail |
$RLX |
1,360.22 |
+15.92 |
+1.18% |
+5.98% |
| Gold & Silver |
$XAU |
107.74 |
+0.15 |
+0.14% |
+137.84% |
| Bank |
$BKX |
68.21 |
+0.09 |
+0.13% |
-6.66% |
| Biotech |
$BTK |
3,326.39 |
-4.72 |
-0.14% |
-12.78% |
|
|
|
 |
Rallied +30% in 2 Months Since Breakout Was Featured
Kenneth J. Gruneisen - Passed the CAN SLIM® Master's Exam
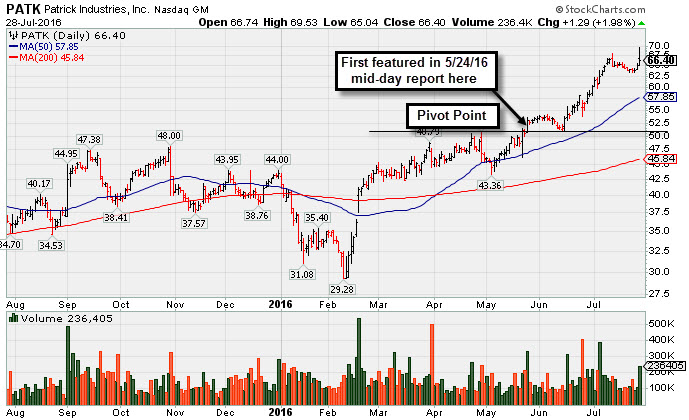
Patrick Industries Inc (PATK +$1.29 or +1.98% to $62.40) hit yet another new high with today's volume-driven gain. Rallying with no resistance due to overhead supply, it has been getting very extended from any sound base. Disciplined investors avoid chasing stocks more than +5% above prior highs. Its 50-day moving average DMA line ($57.85) defines near-term support to watch on pullbacks.
It reported earnings +41% on +35% sales revenues for the Jun '16 quarter, continuing its streak of quarterly comparisons steadily above the +25% minimum earnings guideline (C criteria). A small downturn in FY '13 was a flaw previously noted in its annual earnings (A criteria) history. It was last shown in this FSU section on 7/06/16 with an annotated graph under the headline, "Getting Extended From Prior Base After More Volume-Driven Gains". It has traded up as much as +30% since first highlighted in yellow with pivot point based on its 4/28/16 high plus 10 cents in the 5/24/16 mid-day report (read here). It finished strong with +132% above average volume as it hit new all-time highs confirming a technical buy signal.
Its current Up/Down Volume ratio of 1.4 is an unbiased indication that its shares were under accumulation over the past 50 days. The number of top-rated funds owning its share rose from 218 in Jun '15 to 256 in Jun '16, a reassuring trend concerning the I criteria. Its small supply of 14.2 million shares (S criteria) in the public float can contribute to greater price volatility in the event of institutional buying or selling. |
|
|
Color Codes Explained :
Y - Better candidates highlighted by our
staff of experts.
G - Previously featured
in past reports as yellow but may no longer be buyable under the
guidelines.
***Last / Change / Volume data in this table is the closing quote data***
Symbol/Exchange
Company Name
Industry Group |
PRICE |
CHANGE
(%Change) |
Day High |
Volume
(% DAV)
(% 50 day avg vol) |
52 Wk Hi
% From Hi |
Featured
Date |
Price
Featured |
Pivot Featured |
|
Max Buy |
TDG
-
NYSE
Transdigm Group Inc
AEROSPACE/DEFENSE - Aerospace/Defense Products and; Services
|
$278.99
|
+0.84
0.30% |
$279.52
|
422,358
56.92% of 50 DAV
50 DAV is 742,000
|
$279.18
-0.07%
|
5/11/2016
|
$248.33
|
PP = $245.00
|
|
MB = $257.25
|
Most Recent Note - 7/27/2016 5:46:35 PM
G - Volume totals still have been cooling while wedging further into new all-time high territory. Its 50 DMA line ($263) defines important near-term support to watch on pullbacks. See the latest FSU analysis for more details and a new annotated graph.
>>> FEATURED STOCK ARTICLE : Gains Lack Great Volume While Wedging to New Highs - 7/27/2016 |
View all notes |
Set NEW NOTE alert |
Company Profile |
SEC
News |
Chart |
Request a new note
C
A
S
I |
IESC
-
NASDAQ
I E S Holdings Inc
Bldg-Maintenance and Svc
|
$15.73
|
-0.56
-3.44% |
$16.18
|
84,413
95.92% of 50 DAV
50 DAV is 88,000
|
$16.77
-6.20%
|
7/26/2016
|
$15.79
|
PP = $15.74
|
|
MB = $16.53
|
 Most Recent Note - 7/28/2016 5:31:20 PM
Y - Consolidating near prior highs which define initial support to watch. The gain above the pivot point backed by +140% above average volume when highlighted on 7/26/16 clinched a technical buy signal. Fundamentals remain strong and it found support at its 200 DMA line and rebounded after dropped from the Featured Stocks list on 6/21/16. See the latest FSU analysis for additional details and an annotated graph.
>>> FEATURED STOCK ARTICLE : Volume-Driven Gain for New Highs Clinched Technical Buy Signal - 7/26/2016 |
View all notes |
Set NEW NOTE alert |
Company Profile |
SEC
News |
Chart |
Request a new note
C
A
S
I |
NTES
-
NASDAQ
Netease Inc Adr
INTERNET - Internet Information Providers
|
$206.03
|
-1.14
-0.55% |
$210.27
|
759,936
56.58% of 50 DAV
50 DAV is 1,343,000
|
$207.94
-0.92%
|
6/29/2016
|
$182.42
|
PP = $186.55
|
|
MB = $195.88
|
Most Recent Note - 7/25/2016 5:14:11 PM
G - Rallied with light volume today for a new high close well above its "max buy" level. Disciplined investors avoid chasing stocks more than +5% above the prior high or pivot point. Prior highs near $186 define initial support to watch on pullbacks.
>>> FEATURED STOCK ARTICLE : Perched +5% Above Prior Highs Following Volume-Driven Gains - 7/15/2016 |
View all notes |
Set NEW NOTE alert |
Company Profile |
SEC
News |
Chart |
Request a new note
C
A
S
I |
HTHT
-
NASDAQ
China Lodging Group Ads
LEISURE - Lodging
|
$38.53
|
+0.47
1.23% |
$38.70
|
136,919
60.05% of 50 DAV
50 DAV is 228,000
|
$41.76
-7.73%
|
7/13/2016
|
$38.87
|
PP = $39.29
|
|
MB = $41.25
|
Most Recent Note - 7/26/2016 5:05:11 PM
Y - Pulled back today for a small loss with higher (near average) volume. Sputtering since the 7/15/16 gain backed by +57% above average volume clinched a technical buy signal.
>>> FEATURED STOCK ARTICLE : Negative Reversal After Touching New High - 7/13/2016 |
View all notes |
Set NEW NOTE alert |
Company Profile |
SEC
News |
Chart |
Request a new note
C
A
S
I |
MXL
-
NYSE
Maxlinear Inc Cl A
Telecom-Infrastructure
|
$22.07
|
-0.19
-0.85% |
$22.45
|
695,026
67.48% of 50 DAV
50 DAV is 1,030,000
|
$22.50
-1.91%
|
5/16/2016
|
$19.24
|
PP = $19.20
|
|
MB = $20.16
|
Most Recent Note - 7/25/2016 5:13:04 PM
G - Rallied further above its "max buy" level for another new high. Recent lows and the 200 DMA line in the $16.85 area define important support to watch on pullbacks.
>>> FEATURED STOCK ARTICLE : Slump Into Prior Base and Below 50-Day Moving Average Raised Concerns - 7/5/2016 |
View all notes |
Set NEW NOTE alert |
Company Profile |
SEC
News |
Chart |
Request a new note
C
A
S
I |
Symbol/Exchange
Company Name
Industry Group |
PRICE |
CHANGE
(%Change) |
Day High |
Volume
(% DAV)
(% 50 day avg vol) |
52 Wk Hi
% From Hi |
Featured
Date |
Price
Featured |
Pivot Featured |
|
Max Buy |
PATK
-
NASDAQ
Patrick Industries Inc
WHOLESALE - Building Materials Wholesale
|
$66.40
|
+1.29
1.98% |
$69.53
|
236,405
155.53% of 50 DAV
50 DAV is 152,000
|
$68.13
-2.54%
|
5/24/2016
|
$53.45
|
PP = $50.68
|
|
MB = $53.21
|
Most Recent Note - 7/28/2016 5:29:04 PM
G - Reported strong earnings for the Jun '16 quarter and hit a new all-time high today, getting more extended from any sound base. Disciplined investors avoid chasing stocks more than +5% above prior highs. Its 50 DMA line ($57.85) defines near-term support to watch on pullbacks. See the latest FSU analysis for more details and a new annotated graph.
>>> FEATURED STOCK ARTICLE : Rallied +30% in 2 Months Since Breakout Was Featured - 7/28/2016 |
View all notes |
Set NEW NOTE alert |
Company Profile |
SEC
News |
Chart |
Request a new note
C
A
S
I |
FBHS
-
NYSE
Fortune Brands Hme & Sec
Bldg-Constr Prds/Misc
|
$63.84
|
+2.08
3.37% |
$64.47
|
3,085,211
170.45% of 50 DAV
50 DAV is 1,810,000
|
$62.84
1.59%
|
6/22/2016
|
$57.71
|
PP = $60.08
|
|
MB = $63.08
|
Most Recent Note - 7/28/2016 12:46:48 PM
Y - Volume is running at an above average pace while hitting new highs above its "max buy" level after gapping up. Reported earnings +39% on +11% sales revenues for the Jun '16 quarter. Volume and volatility often increase near earnings news.
>>> FEATURED STOCK ARTICLE : New Highs Lack Important Institutional Volume Punch - 7/11/2016 |
View all notes |
Set NEW NOTE alert |
Company Profile |
SEC
News |
Chart |
Request a new note
C
A
S
I |
NVEE
-
NASDAQ
N V 5 Global Inc
Comml Svcs-Consulting
|
$32.65
|
-0.26
-0.79% |
$32.95
|
41,282
39.69% of 50 DAV
50 DAV is 104,000
|
$33.14
-1.48%
|
4/19/2016
|
$28.20
|
PP = $28.10
|
|
MB = $29.51
|
Most Recent Note - 7/25/2016 5:18:51 PM
G - Volume totals have been cooling while holding its ground near all-time highs after an impressive streak of 10 consecutive gains. Its 50 DMA line ($28.17) and recent lows in the $24-25 area define near-term support to watch.
>>> FEATURED STOCK ARTICLE : Winning Streak Leaves Leader Extended From Prior Base Pattern - 7/18/2016 |
View all notes |
Set NEW NOTE alert |
Company Profile |
SEC
News |
Chart |
Request a new note
C
A
S
I |
SFBS
-
NASDAQ
Servisfirst Bancshares
BANKING - Regional - Southeast Banks
|
$50.93
|
-0.67
-1.30% |
$51.39
|
45,649
40.76% of 50 DAV
50 DAV is 112,000
|
$53.58
-4.95%
|
7/19/2016
|
$53.28
|
PP = $52.82
|
|
MB = $55.46
|
Most Recent Note - 7/26/2016 5:02:48 PM
Y - A volume-driven gain and strong close above the pivot point may help clinch a convincing technical buy signal. It has been quietly consolidating since highlighted in yellow in the 7/19/16 mid-day report with pivot point cited based on the 6/01/16 high plus 10 cents.
>>> FEATURED STOCK ARTICLE : Meeting Resistance Near Prior Highs - 7/20/2016 |
View all notes |
Set NEW NOTE alert |
Company Profile |
SEC
News |
Chart |
Request a new note
C
A
S
I |
OLLI
-
NASDAQ
Ollie's Bargain Outlet
Retail-DiscountandVariety
|
$25.58
|
-0.14
-0.54% |
$25.77
|
238,554
25.19% of 50 DAV
50 DAV is 947,000
|
$28.72
-10.93%
|
7/19/2016
|
$26.42
|
PP = $28.82
|
|
MB = $30.26
|
Most Recent Note - 7/25/2016 5:17:38 PM
Y - Volume-driven gains for new highs are still needed to trigger a technical buy signal. Completed another Secondary Offering on 6/06/16. Such offerings often hinder upward price progress for the short term, yet they also help to attract more institutional sponsorship. Prior mid-day reports noted - "Reported earnings +82% on +19% sales revenues for the Apr '16 quarter, continuing its strong earnings track record. Completed a Secondary Offering on 2/18/16, and it completed its $16 IPO on 7/16/15."
>>> FEATURED STOCK ARTICLE : Retail Firm Approaching Pivot Point - 7/19/2016 |
View all notes |
Set NEW NOTE alert |
Company Profile |
SEC
News |
Chart |
Request a new note
C
A
S
I |
Symbol/Exchange
Company Name
Industry Group |
PRICE |
CHANGE
(%Change) |
Day High |
Volume
(% DAV)
(% 50 day avg vol) |
52 Wk Hi
% From Hi |
Featured
Date |
Price
Featured |
Pivot Featured |
|
Max Buy |
|
|
|
THESE ARE NOT BUY RECOMMENDATIONS!
Comments contained in the body of this report are technical
opinions only. The material herein has been obtained
from sources believed to be reliable and accurate, however,
its accuracy and completeness cannot be guaranteed.
This site is not an investment advisor, hence it does
not endorse or recommend any securities or other investments.
Any recommendation contained in this report may not
be suitable for all investors and it is not to be deemed
an offer or solicitation on our part with respect to
the purchase or sale of any securities. All trademarks,
service marks and trade names appearing in this report
are the property of their respective owners, and are
likewise used for identification purposes only.
This report is a service available
only to active Paid Premium Members.
You may opt-out of receiving report notifications
at any time. Questions or comments may be submitted
by writing to Premium Membership Services 665 S.E. 10 Street, Suite 201 Deerfield Beach, FL 33441-5634 or by calling 1-800-965-8307
or 954-785-1121.
|
|
|