You are not logged in.
This means you
CAN ONLY VIEW reports that were published prior to Wednesday, April 16, 2025.
You
MUST UPGRADE YOUR MEMBERSHIP if you want to see any current reports.
AFTER MARKET UPDATE - TUESDAY, MAY 9TH, 2023
Previous After Market Report Next After Market Report >>>
|
|
|
|
DOW |
-56.88 |
33,561.81 |
-0.17% |
|
Volume |
882,159,269 |
+8% |
|
Volume |
4,211,831,800 |
-2% |
|
NASDAQ |
-77.36 |
12,179.55 |
-0.63% |
|
Advancers |
1,167 |
40% |
|
Advancers |
1,871 |
43% |
|
S&P 500 |
-18.95 |
4,119.17 |
-0.46% |
|
Decliners |
1,723 |
60% |
|
Decliners |
2,528 |
57% |
|
Russell 2000 |
-4.79 |
1,749.68 |
-0.27% |
|
52 Wk Highs |
46 |
|
|
52 Wk Highs |
87 |
|
|
S&P 600 |
-7.01 |
1,126.23 |
-0.62% |
|
52 Wk Lows |
74 |
|
|
52 Wk Lows |
189 |
|
|
 |
Indices Slip Further as Optimism Falls and Default Concerns Grow
Kenneth J. Gruneisen - Passed the CAN SLIM® Master's Exam
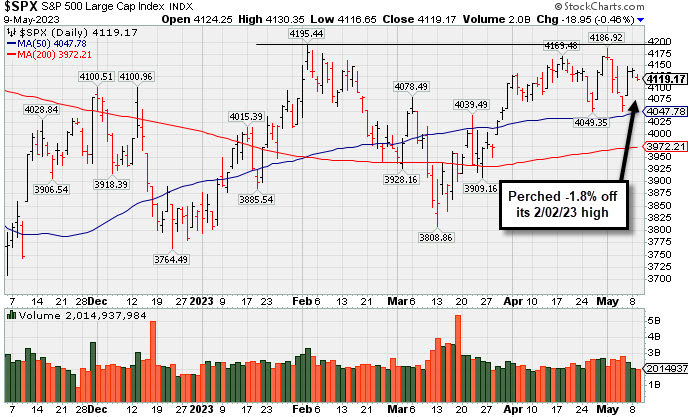
The Dow slipped 56 points (0.2%) while the Nasdaq Composite fell 0.6% and the S&P 500 shed 0.5%. Volume totals reported were mixed, higher on the NYSE and lightrer on the Nasdaq exchange. Decliners led advancers by a 3-2 margin on the NYSE and almost 3-2 on the Nasdaq exchange. There were 34 high-ranked companies from the Leaders List that hit a new 52-week high and were listed on the BreakOuts Page, versus the total of 28 on the prior session. New 52-week lows outnumbered new highs on the NYSE and on the Nasdaq exchange.The major indices are in an uptrend under pressure (M criteria). Appropriate new buying efforts may be considered under the fact-based investment system.
PICTURED: The S&P 500 Index found support above its 50-day moving average (DMA) line recently and is perched -1.8% off its February 2, 2023 high.
Eight of 11 sectors closed in negative territory U.S. equities finished lower Tuesday. Investors awaited Wednesday’s Consumer Price Index (CPI) data and progress on the debt ceiling. President Biden and House Speaker Kevin McCarthy met late this afternoon to initiate discussions on how to best avoid a default. Biden and McCarthy have been divided on the best course of action in recent months, leading to a stand-off on the issue. Meanwhile, market participants will closely monitor tomorrow’s CPI report for any insights into the impact of the Federal Reserve’s (Fed) monetary policy.
On the data front today, the National Federation of Independent Business (NFIB) Small Business Optimism Index fell more than expected in April to notch its lowest level in a decade. The report noted elevated inflation, higher interest rates, tighter credit conditions, and recession concerns continued to weigh heavily on sentiment. Treasuries were little changed, with the yield on the 10-year note holding steady at 3.52%, while the 30-year bond yield ticked up one basis point (0.01%) to 3.84%. The yield on the two-year note climbed two basis points (0.02%) to 4.03%. In commodities, West Texas Intermediate (WTI) crude reversed earlier losses to climb 0.5% to $73.51/barrel amid reports the Biden Administration plans to commence purchasing oil to refill the Strategic Petroleum Reserve (SPR). The Energy Information Administration (EIA) has reported they anticipate higher seasonal demand and lower-than-forecasted output. However, weak trade data from China is capping gains.
|
 Kenneth J. Gruneisen started out as a licensed stockbroker in August 1987, a couple of months prior to the historic stock market crash that took the Dow Jones Industrial Average down -22.6% in a single day. He has published daily fact-based fundamental and technical analysis on high-ranked stocks online for two decades. Through FACTBASEDINVESTING.COM, Kenneth provides educational articles, news, market commentary, and other information regarding proven investment systems that work in good times and bad.
Comments contained in the body of this report are technical opinions only and are not necessarily those of Gruneisen Growth Corp. The material herein has been obtained from sources believed to be reliable and accurate, however, its accuracy and completeness cannot be guaranteed. Our firm, employees, and customers may effect transactions, including transactions contrary to any recommendation herein, or have positions in the securities mentioned herein or options with respect thereto. Any recommendation contained in this report may not be suitable for all investors and it is not to be deemed an offer or solicitation on our part with respect to the purchase or sale of any securities. |
|
 |
Retail Index Edged Higher as Semiconductor Index Led Decliners
Kenneth J. Gruneisen - Passed the CAN SLIM® Master's Exam
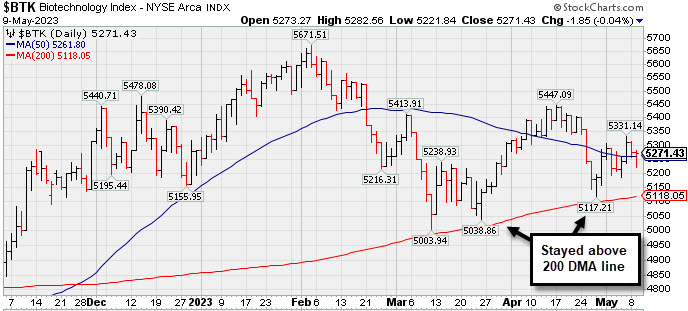
The Retail Index ($RLX +0.66%) edged higher and the Broker/Dealer Index ($XBD +0.27%) inched hihger whie the Bank Index ($BKX +0.03%) finished flat. The Semiconductor Index ($SOX -1.87%) led the tech sector lower while the Networking Index ($NWX -0.67%) also slumped and the Biotech Index ($BTK -0.04%) finished flat. Commodity-liniked groups were quiet as the Gold & Silver Index ($XAU -0.06%), Oil Services Index ($OSX +0.12%), and Integrated Oil Index ($XOI +0.05%) each finished flat.
PICTURED: The Biotech Index ($BTK -0.04%) is consolidating near its 50-day moving average (DMA) line. It found support above its 200 DMA line on recent pullbacks. More damaging losses woud raise greater concerns.
| Oil Services |
$OSX |
74.81 |
+0.09 |
+0.12% |
-10.79% |
| Integrated Oil |
$XOI |
1,657.01 |
+0.76 |
+0.05% |
-7.29% |
| Semiconductor |
$SOX |
2,967.84 |
-56.57 |
-1.87% |
+17.21% |
| Networking |
$NWX |
730.07 |
-4.92 |
-0.67% |
-6.80% |
| Broker/Dealer |
$XBD |
433.58 |
+1.19 |
+0.27% |
-3.46% |
| Retail |
$RLX |
3,056.88 |
+20.15 |
+0.66% |
+11.00% |
| Gold & Silver |
$XAU |
140.06 |
-0.09 |
-0.06% |
+15.89% |
| Bank |
$BKX |
75.10 |
+0.03 |
+0.03% |
-25.53% |
| Biotech |
$BTK |
5,271.43 |
-1.85 |
-0.04% |
-0.18% |
|
|
|
 |
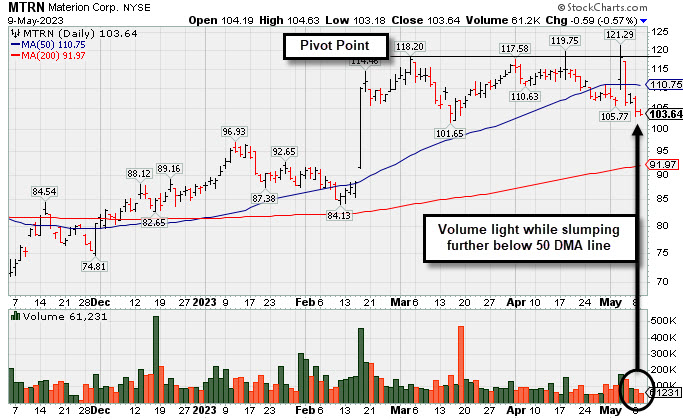
Materion Sputtering Below 50 DMA Line After Subpar Earnings
Kenneth J. Gruneisen - Passed the CAN SLIM® Master's Exam
Materion Corp (MTRN -$0.59 or -0.57% to $103.64) has slumped further with lighter volume. It abruptly retreated for a damaging loss with above average volume on 5/04/23 as it again violated its 50-day moving average (DMA) line ($110.75) raising concerns as its color code was changed to green. Disciplined investors may note that on the prior session (5/03/23) it did not quite produce a gain and a strong close above the pivot point backed by at least +40% above average volume to trigger a proper technical buy signal.
MTRN reported Mar '23 quarterly earnings +13% versus the year-ago period, below the +25% minimum guideline (C criteria) raising fundamental concerns. Volume and volatility often increase near earnings news. It was highlighted in yellow with pivot point cited based on its 3/03/23 high plus 10 cents in the 4/18/23 mid-day report (read here) and shown in greater detail that evening with an annotated graph under the headline, "Encountered Distributional Pressure When Poised for Breakout".
MTRN has a 92 Earnings Per Share Rating, above the 80+ minimum guideline for buy candidates. Only 2 of the past 4 quarterly comparisons were above the +25% minimum earnings guideline (C criteria). A downturn in its FY '20 annual earnings history (A criteria) has been followed by much stronger '21 and '22 results.
The company has a small supply of only 20.6 million shares outstanding (S criteria). That can lead to greater price volatility in the event of institutional buying or selling. The number of top-rated funds owning its shares reportedly fell from 436 in Jun '22 to 401 in Mar '23. Its current Up/Down Volume Ratio of 1.1 is an unbiased indication its shares have been under slight accumulation over the past 50 days, a reassuring sign concerning the I criteria. It has a Timeliness Rating of B and a Sponsorship Rating of A.
|
|
|
Color Codes Explained :
Y - Better candidates highlighted by our
staff of experts.
G - Previously featured
in past reports as yellow but may no longer be buyable under the
guidelines.
***Last / Change / Volume data in this table is the closing quote data***
Symbol/Exchange
Company Name
Industry Group |
PRICE |
CHANGE
(%Change) |
Day High |
Volume
(% DAV)
(% 50 day avg vol) |
52 Wk Hi
% From Hi |
Featured
Date |
Price
Featured |
Pivot Featured |
|
Max Buy |
 GPK
-
NYSE
GPK
-
NYSE
Graphic Packaging
CONSUMER NON-DURABLES - Packaging and Containers
|
$25.72
|
-0.21
-0.81% |
$26.04
|
2,701,938
88.53% of 50 DAV
50 DAV is 3,052,000
|
$26.11
-1.49%
|
10/25/2022
|
$22.75
|
PP = $24.17
|
|
MB = $25.38
|
 Most Recent Note - 5/9/2023 3:02:57 PM
G - Color code is changed to green while hovering above its "max buy" level near its all-time high with volume totals cooling. Reported Mar '23 quarterly earnings +60% on +9% sales revenues versus the year-ago period. Its 50 DMA line ($24.64) defines important near-term support to watch on pullbacks.
>>> FEATURED STOCK ARTICLE : Packaging Firm Due to Report Earnings News - 5/1/2023 |
View all notes |
Set NEW NOTE alert |
Company Profile |
SEC
News |
Chart |
Request a new note
C
A
S
I |
STRL
-
NASDAQ
Sterling Infrastructure
MATERIALS and; CONSTRUCTION - Heavy Construction
|
$42.92
|
+0.65
1.54% |
$43.05
|
183,275
71.04% of 50 DAV
50 DAV is 258,000
|
$43.05
-0.30%
|
12/14/2022
|
$32.41
|
PP = $33.72
|
|
MB = $35.41
|
Most Recent Note - 5/4/2023 6:11:46 PM
G - Pulled back today after hitting a new all-time high with 5 consecutive gains backed by ever-increasing volume. Rebound above the 50 DMA line ($38) this week helped its technical stance improve. Reported Mar '23 quarterly earnings +0% on +10% sales revenues versus the year-ago period, below the +25% minimum earnings guideline (C criteria) raising fundamental concerns. Volume and volatility often increase near earnings news.
>>> FEATURED STOCK ARTICLE : 50-Day Moving Average Line Acted as Recent Resistance - 4/28/2023 |
View all notes |
Set NEW NOTE alert |
Company Profile |
SEC
News |
Chart |
Request a new note
C
A
S
I |
FIX
-
NYSE
Comfort Systems USA
MATERIALS and CONSTRUCTION - General Contractors
|
$148.35
|
+0.43
0.29% |
$149.40
|
161,391
53.09% of 50 DAV
50 DAV is 304,000
|
$154.15
-3.76%
|
4/27/2023
|
$148.85
|
PP = $152.23
|
|
MB = $159.84
|
Most Recent Note - 5/8/2023 7:38:49 PM
Y - Pulled back today with lighter volume after hitting a new high on the prior session with a volume-driven gain. Previously noted - "Bullish action came after it reported Mar '23 quarterly earnings +66% on +33% sales revenues versus the year-ago period. Powered above its 50 DMA line ($140.70) with a considerable gain backed by twice its average volume. Its color code was changed to yellow with pivot point cited based on its 3/03/23 high plus 10 cents. Very little resistance remains due to overhead supply up to the $152 level. A gain and new high backed by at least +40% above average volume may trigger a technical buy signal."
>>> FEATURED STOCK ARTICLE : Consolidating Near 50-Day Moving Average and -10.5% off High - 4/21/2023 |
View all notes |
Set NEW NOTE alert |
Company Profile |
SEC
News |
Chart |
Request a new note
C
A
S
I |
KOF
-
NYSE
Coca-Cola Femsa ADR
FOOD and BEVERAGE - Beverages - Soft Drinks
|
$90.33
|
+0.45
0.50% |
$91.23
|
183,495
94.59% of 50 DAV
50 DAV is 194,000
|
$90.50
-0.19%
|
3/7/2023
|
$76.63
|
PP = $77.11
|
|
MB = $80.97
|
Most Recent Note - 5/8/2023 7:41:17 PM
G - Hit another new all-time high with above-average volume behind today's 5th consecutive gain. Reported Mar '23 quarterly earnings +53% on +24% sales revenues versus the year-ago period. On pullbacks, prior highs in the $79-$77 area define initial support to watch along with its 50 DMA line ($80.14).
>>> FEATURED STOCK ARTICLE : Posted Gain Afrer Reporting Strong Mar '23 Quarterly Results - 5/2/2023 |
View all notes |
Set NEW NOTE alert |
Company Profile |
SEC
News |
Chart |
Request a new note
C
A
S
I |
CLH
-
NYSE
Clean Harbors
Pollution Control
|
$139.04
|
+2.27
1.66% |
$139.49
|
346,651
77.03% of 50 DAV
50 DAV is 450,000
|
$147.76
-5.90%
|
3/10/2023
|
$136.89
|
PP = $136.74
|
|
MB = $143.58
|
Most Recent Note - 5/9/2023 3:07:07 PM
Y - Color code is changed to yellow while finding support near its 50 DMA line ($138) after a big loss last week triggered a technical sell signal. More damaging losses would raise greater concerns. Reported Mar '23 quarterly earnings +64% on +12% sales revenues versus the year-ago period. Recently wedged up above its "max buy" level with gains backed by lackluster volume, not action considered indicative of fresh institutional buying demand. Fundamentals remain strong.
>>> FEATURED STOCK ARTICLE : Wedged to a New High Close Above "Max Buy" Level - 4/19/2023 |
View all notes |
Set NEW NOTE alert |
Company Profile |
SEC
News |
Chart |
Request a new note
C
A
S
I |
Symbol/Exchange
Company Name
Industry Group |
PRICE |
CHANGE
(%Change) |
Day High |
Volume
(% DAV)
(% 50 day avg vol) |
52 Wk Hi
% From Hi |
Featured
Date |
Price
Featured |
Pivot Featured |
|
Max Buy |
MTRN
-
NYSE
Materion
METALS and MINING - Industrial Metals and Minerals
|
$103.64
|
-0.59
-0.57% |
$104.63
|
61,231
57.77% of 50 DAV
50 DAV is 106,000
|
$121.29
-14.55%
|
4/18/2023
|
$114.52
|
PP = $118.30
|
|
MB = $124.22
|
Most Recent Note - 5/9/2023 6:54:29 PM
G - Fell with lighter volume after abruptly retreating on 5/04/23 for damaging loss with above-average volume as it again violated its 50 DMA line ($110.75) raising concerns. Disciplined investors may note that it did not quite produce a gain and a strong close above the pivot point backed by at least +40% above average volume to trigger a proper technical buy signal. Reported Mar '23 quarterly earnings +13% versus the year-ago period, below the +25% minimum guideline (C criteria) raising fundamental concerns. See the latest FSU analysis for more details and a new annotated graph.
>>> FEATURED STOCK ARTICLE : Materion Sputtering Below 50 DMA Line After Subpar Earnings - 5/9/2023 |
View all notes |
Set NEW NOTE alert |
Company Profile |
SEC
News |
Chart |
Request a new note
C
A
S
I |
SPSC
-
NASDAQ
SPS Commerce
COMPUTER SOFTWARE and SERVICES - Application Software
|
$154.12
|
+1.12
0.73% |
$155.51
|
189,040
126.03% of 50 DAV
50 DAV is 150,000
|
$157.46
-2.12%
|
4/24/2023
|
$150.01
|
PP = $157.56
|
|
MB = $165.44
|
Most Recent Note - 5/4/2023 6:10:28 PM
Y - Although it pulled back today with lighter volume, its color code is changed to yellow after rebounding above its 50 DMA line ($148.35) which had acted as resistance. Subsequent gains above the pivot point backed by at least +40% above average volume may trigger a technical buy signal. Reported Mar '23 quarterly earnings +22% on +20% versus the year-ago period, below the +25% minimum earnings guideline (C criteria) raising some fundamental concerns. Volume and volatility often increase near earnings news.
>>> FEATURED STOCK ARTICLE : Sputtered While Perched in Striking Distance of 52-Week HIgh - 4/24/2023 |
View all notes |
Set NEW NOTE alert |
Company Profile |
SEC
News |
Chart |
Request a new note
C
A
S
I |
HUBB
-
NYSE
Hubbell
Electrical-Power/Equipmt
|
$270.92
|
+0.36
0.13% |
$272.86
|
377,201
92.91% of 50 DAV
50 DAV is 406,000
|
$282.19
-3.99%
|
4/25/2023
|
$262.85
|
PP = $257.51
|
|
MB = $270.39
|
Most Recent Note - 5/9/2023 3:04:04 PM
G - Holding its ground near its all-time high with volume totals cooling. Bullish action came after its strong Mar '23 quarterly results. Prior highs in the $263 area define initial support to watch on pullbacks.
>>> FEATURED STOCK ARTICLE : Gap Up Following Earnings Triggered Technical Buy Signal - 4/25/2023 |
View all notes |
Set NEW NOTE alert |
Company Profile |
SEC
News |
Chart |
Request a new note
C
A
S
I |
NVR
-
NYSE
NVR Inc
MATERIALS and CONSTRUCTION - Residential Construction
|
$5,875.45
|
+21.98
0.38% |
$5,933.00
|
17,817
77.47% of 50 DAV
50 DAV is 23,000
|
$5,986.96
-1.86%
|
4/25/2023
|
$5,882.18
|
PP = $5,978.25
|
|
MB = $6,277.16
|
Most Recent Note - 5/3/2023 10:08:59 AM
G - Still perched near its all-time high with today's 5th consecutive gain. Reported Mar '23 quarterly earnings -14% on -3% sales revenues versus the year-ago period, below the +25% minimum earnings guideline (C criteria) raising fundamental concerns, and its color code was changed to green. Confirming gains and a close above the pivot point backed by at least +40% above average volume may clinch a proper technical buy signal. Prior quarterly comparisons were well above the +25% minimum earnings guideline (C criteria). Annual earnings (A criteria) growth has been very strong.
>>> FEATURED STOCK ARTICLE : Fell From High and Raised Concern With Subpar Mar '23 Report - 4/27/2023 |
View all notes |
Set NEW NOTE alert |
Company Profile |
SEC
News |
Chart |
Request a new note
C
A
S
I |
PHM
-
NYSE
PulteGroup
MATERIALS and CONSTRUCTION - Residential Construction
|
$67.73
|
-0.05
-0.07% |
$68.73
|
3,535,122
118.43% of 50 DAV
50 DAV is 2,985,000
|
$67.91
-0.27%
|
4/25/2023
|
$65.17
|
PP = $64.01
|
|
MB = $67.21
|
Most Recent Note - 5/3/2023 10:07:19 AM
Y - Churning above-average volume for the past week yet it remains perched near its all-time high and "max buy" level. Highlighted in yellow with pivot point cited based on its May 2021 high in the 4/25/23 mid-day report. Bullish action came after it reported earnings +28% for the Mar '23 quarter versus the year-ago period. Prior highs in the $64-60 area define initial support to watch above its 50 DMA line ($58.26).
>>> FEATURED STOCK ARTICLE : Recently Rallying to New All-Time Highs - 4/26/2023 |
View all notes |
Set NEW NOTE alert |
Company Profile |
SEC
News |
Chart |
Request a new note
C
A
S
I |
Symbol/Exchange
Company Name
Industry Group |
PRICE |
CHANGE
(%Change) |
Day High |
Volume
(% DAV)
(% 50 day avg vol) |
52 Wk Hi
% From Hi |
Featured
Date |
Price
Featured |
Pivot Featured |
|
Max Buy |
COKE
-
NASDAQ
Coca-Cola Consolidated
FOOD and BEVERAGE - Beverages - Soft Drinks
|
$629.74
|
-22.23
-3.41% |
$653.00
|
46,235
128.43% of 50 DAV
50 DAV is 36,000
|
$694.20
-9.29%
|
5/4/2023
|
$646.66
|
PP = $656.21
|
|
MB = $689.02
|
Most Recent Note - 5/9/2023 3:09:26 PM
Y - Pulling back today for a 3rd consecutive loss, raising concerns while slumping back below the pivot point cited. Solid gain on 5/04/23 backed by +128% above average volume as it closed above the new pivot point cited based on its 6/07/22 high plus 10 cents triggered a technical buy signal. Bullish action came after it reported Mar '23 quarterly earnings +93% on +12% sales revenues versus the year-ago period, continuing its strong earnings track record.
>>> FEATURED STOCK ARTICLE : COKE is Showing Real Strength - 5/4/2023 |
View all notes |
Set NEW NOTE alert |
Company Profile |
SEC
News |
Chart |
Request a new note
C
A
S
I |
|
|
|
THESE ARE NOT BUY RECOMMENDATIONS!
Comments contained in the body of this report are technical
opinions only. The material herein has been obtained
from sources believed to be reliable and accurate, however,
its accuracy and completeness cannot be guaranteed.
This site is not an investment advisor, hence it does
not endorse or recommend any securities or other investments.
Any recommendation contained in this report may not
be suitable for all investors and it is not to be deemed
an offer or solicitation on our part with respect to
the purchase or sale of any securities. All trademarks,
service marks and trade names appearing in this report
are the property of their respective owners, and are
likewise used for identification purposes only.
This report is a service available
only to active Paid Premium Members.
You may opt-out of receiving report notifications
at any time. Questions or comments may be submitted
by writing to Premium Membership Services 665 S.E. 10 Street, Suite 201 Deerfield Beach, FL 33441-5634 or by calling 1-800-965-8307
or 954-785-1121.
|
|
|