You are not logged in.
This means you
CAN ONLY VIEW reports that were published prior to Thursday, April 17, 2025.
You
MUST UPGRADE YOUR MEMBERSHIP if you want to see any current reports.
AFTER MARKET UPDATE - TUESDAY, APRIL 18TH, 2023
Previous After Market Report Next After Market Report >>>
|
|
|
|
DOW |
-10.55 |
33,976.63 |
-0.03% |
|
Volume |
778,153,781 |
-4% |
|
Volume |
4,820,156,600 |
+0% |
|
NASDAQ |
-4.31 |
12,153.41 |
-0.04% |
|
Advancers |
1,316 |
45% |
|
Advancers |
1,916 |
43% |
|
S&P 500 |
+3.55 |
4,154.87 |
+0.09% |
|
Decliners |
1,577 |
54% |
|
Decliners |
2,546 |
57% |
|
Russell 2000 |
-7.29 |
1,795.55 |
-0.40% |
|
52 Wk Highs |
65 |
|
|
52 Wk Highs |
73 |
|
|
S&P 600 |
-6.26 |
1,164.36 |
-0.53% |
|
52 Wk Lows |
32 |
|
|
52 Wk Lows |
152 |
|
|
 |
Major Indices Were Little Changed on Mixed Session
Kenneth J. Gruneisen - Passed the CAN SLIM® Master's Exam
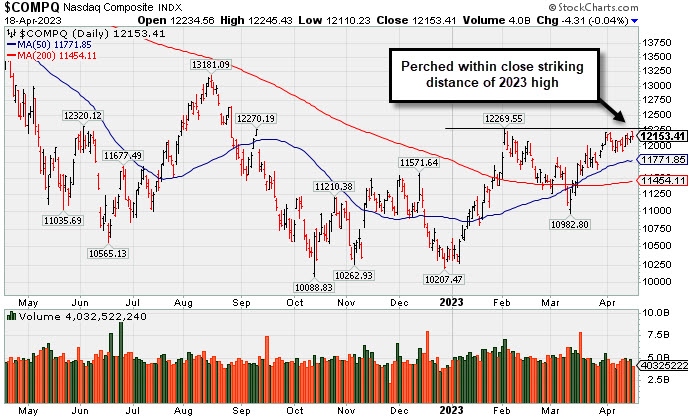
The Dow lost 10 points (0.0%), while the Nasdaq Composite hovered around the flat line and the S&P 500 advanced 0.1%. Volume totals reported were mixed, lighter than the prior session on the NYSE and slightly higher on the Nasdaq exchange. Breadth was negative as decliners led advancers by an 8-7 margin on the NYSE and by a 5-4 margin on the Nasdaq exchange. There were 35 high-ranked companies from the Leaders List that hit a new 52-week high and were listed on the BreakOuts Page, versus the total of 34 on the prior session. New 52-week highs outnumbered new 52-week lows on the NYSE but new lows still solidly outnumbered new highs on the Nasdaq exchange.The major indices are in a confirmed uptrend (M criteria). Appropriate new buying efforts may be considered under the fact-based investment system.
PICTURED: The Nasdaq Composite Index is perched withing striking distance of its February 2023 high.
Seven of 11 sectors finished in positive territory as U.S. equities finished mixed Tuesday after a volatile trading day. In earnings, Netflix Inc. (NFLX +0.29%) beat earnings estimates but slightly missed revenue after the streaming giant announced it will end its DVD mailing business. United Airlines Holdings Inc. (UAL +1.56%) rose after it reported a first quarter earnings loss while slightly topping revenues estimates. The company also stated they are forecasting a profitable second quarter as the peak summer travel season starts to pick up. Elsewhere, Atlanta Federal Reserve (Fed) President Raphael Bostic announced his anticipation of one more quarter point rate hike followed by holding rates at that new level for “quite some time”.
On the data front, March’s housing starts declined 0.8% from the prior month to 1.42 million units, both being better than the estimated 3.5% decline and 1.4 million units respectively. March’s decline originated from a pullback in multifamily projects outweighing the uptick in single-family home construction. Meanwhile, building permits fell more than expected coming in at an 8.8% monthly decline to 1.413 million units, compared to February’s upwardly revised 15.8% growth.
Treasuries were mixed, with the yield on the 10-year note declining two basis points (0.02%) to 3.58%, while the 30-year bond yield dropped three basis points (0.03%) to 3.78%. The yield on the two-year note advanced two basis points (0.02%) to 4.21%. In commodities, West Texas Intermediate (WTI) crude fell 0.1% to $80.74/barrel as a gloomy U.S. economic outlook overshadowed upbeat Chinese economic data.
|
 Kenneth J. Gruneisen started out as a licensed stockbroker in August 1987, a couple of months prior to the historic stock market crash that took the Dow Jones Industrial Average down -22.6% in a single day. He has published daily fact-based fundamental and technical analysis on high-ranked stocks online for two decades. Through FACTBASEDINVESTING.COM, Kenneth provides educational articles, news, market commentary, and other information regarding proven investment systems that work in good times and bad.
Comments contained in the body of this report are technical opinions only and are not necessarily those of Gruneisen Growth Corp. The material herein has been obtained from sources believed to be reliable and accurate, however, its accuracy and completeness cannot be guaranteed. Our firm, employees, and customers may effect transactions, including transactions contrary to any recommendation herein, or have positions in the securities mentioned herein or options with respect thereto. Any recommendation contained in this report may not be suitable for all investors and it is not to be deemed an offer or solicitation on our part with respect to the purchase or sale of any securities. |
|
 |
Financial, Retail, Semiconductor, and Gold & Silver Indexes Rose
Kenneth J. Gruneisen - Passed the CAN SLIM® Master's Exam
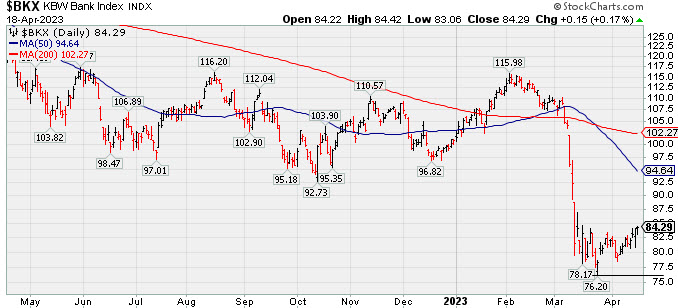
The Broker/Dealer Index ($XBD +0.67%), Bank Index ($BKX +0.17%), and Retail Index ($RLX +0.21%) each edged higher. The Semiconductor Index ($SOX +0.36%) posted a small gain while the Networking Index ($NWX -1.39%) and Biotech Index ($BTK -0.88%) both lost ground. The Gold & Silver Index ($XAU +0.47%) posted a small gain while the Oil Services Index ($OSX +0.05%) and Integrated Oil Index ($XOI -0.16%) were little changed.
PICTURED: The Bank Index ($BKX +0.17%) halted its slide in March and has been rebounding, but it remains well below its 50-day and 200-day moving average (DMA) lines.
| Oil Services |
$OSX |
82.34 |
+0.05 |
+0.05% |
-1.82% |
| Integrated Oil |
$XOI |
1,797.80 |
-2.95 |
-0.16% |
+0.59% |
| Semiconductor |
$SOX |
3,077.72 |
+11.04 |
+0.36% |
+21.55% |
| Networking |
$NWX |
805.15 |
-11.31 |
-1.39% |
+2.79% |
| Broker/Dealer |
$XBD |
462.28 |
+3.09 |
+0.67% |
+2.93% |
| Retail |
$RLX |
3,000.79 |
+6.29 |
+0.21% |
+8.96% |
| Gold & Silver |
$XAU |
138.92 |
+0.66 |
+0.47% |
+14.94% |
| Bank |
$BKX |
84.29 |
+0.15 |
+0.17% |
-16.42% |
| Biotech |
$BTK |
5,392.09 |
-47.62 |
-0.88% |
+2.10% |
|
|
|
 |
Encountered Distributional Pressure When Poised for Breakout
Kenneth J. Gruneisen - Passed the CAN SLIM® Master's Exam
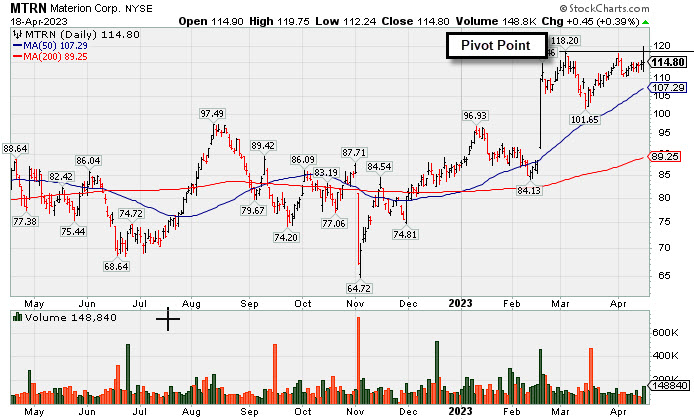
Materion Corp (MTRN +$0.45 or +0.39% to $114.80) finished in the lower half of its intra-day raneg after highlighted in yellow with pivot point cited based on its 3/03/23 high plus 10 cents in the earlier mid-day report (read here). It hit a new all-time high with today's early gain. Subsequent gains and a strong close above the pivot point backed by at least +40% above average volume may trigger a proper technical buy signal.
MTRN has a 90 Earnings Per Share Rating, above the 80+ minimum guideline for buy candidates. . Reported earnings +33% on +9% sales revenues for the Dec '22 quarter versus the year-ago period. Three of the past 4 quarterly comparisons were above the +25% minimum earnings guideline (C criteria). A downturn in its FY '20 annual earnings history (A criteria) has been followed by much stronger '21 and '22 results.
The company has a small supply of only 20.5 million shares outstanding (S criteria). That can lead to greater price volatility in the event of institutional buying or selling. The number of top-rated funds owning its shares reportedly fell from 436 in Jun '22 to 403 in Mar '23. However, its current Up/Down Volume Ratio of 1.8 is an unbiased indication its shares have been under accumulation over the past 50 days, a reassuring sign concerning the I criteria. It has a Timeliness Rating of A and a Sponsorship Rating of A.
|
|
|
Color Codes Explained :
Y - Better candidates highlighted by our
staff of experts.
G - Previously featured
in past reports as yellow but may no longer be buyable under the
guidelines.
***Last / Change / Volume data in this table is the closing quote data***
Symbol/Exchange
Company Name
Industry Group |
PRICE |
CHANGE
(%Change) |
Day High |
Volume
(% DAV)
(% 50 day avg vol) |
52 Wk Hi
% From Hi |
Featured
Date |
Price
Featured |
Pivot Featured |
|
Max Buy |
 GPK
-
NYSE
GPK
-
NYSE
Graphic Packaging
CONSUMER NON-DURABLES - Packaging and Containers
|
$25.02
|
+0.11
0.44% |
$25.06
|
2,765,432
87.82% of 50 DAV
50 DAV is 3,149,000
|
$25.62
-2.34%
|
10/25/2022
|
$22.75
|
PP = $24.17
|
|
MB = $25.38
|
Most Recent Note - 4/17/2023 3:47:51 PM
Y - Volume totals have been near average or lighter than average while consolidating below its "max buy" level and just -3% below its all-time high. Recent gains lacked great volume conviction. Its 50 DMA line ($24.16) and recent low ($22.99 on 3/16/23) define important near-term support to watch.
>>> FEATURED STOCK ARTICLE : Quietly Consolidating Just Below "Max Buy" Level - 4/10/2023 |
View all notes |
Set NEW NOTE alert |
Company Profile |
SEC
News |
Chart |
Request a new note
C
A
S
I |
STRL
-
NASDAQ
Sterling Infrastructure
MATERIALS and; CONSTRUCTION - Heavy Construction
|
$36.83
|
-0.55
-1.47% |
$37.95
|
184,590
73.25% of 50 DAV
50 DAV is 252,000
|
$42.00
-12.31%
|
12/14/2022
|
$32.41
|
PP = $33.72
|
|
MB = $35.41
|
 Most Recent Note - 4/18/2023 5:56:46 PM
G - Met resistance at its 50 DMA line today and ended with a loss and near the session low breaking a streak of 6 consecutive gains with below-average volume. A rebound above the 50 DMA line ($37.74) is needed for its outlook to improve.
>>> FEATURED STOCK ARTICLE : Volume-Driven 50-Day Moving Average Violation Triggered Sell Signal - 4/5/2023 |
View all notes |
Set NEW NOTE alert |
Company Profile |
SEC
News |
Chart |
Request a new note
C
A
S
I |
PERI
-
NASDAQ
Perion Network
Comml Svcs-Advertising
|
$41.50
|
-0.35
-0.84% |
$42.36
|
604,300
79.30% of 50 DAV
50 DAV is 762,000
|
$42.75
-2.92%
|
1/25/2023
|
$31.79
|
PP = $33.19
|
|
MB = $34.85
|
Most Recent Note - 4/17/2023 12:21:08 PM
G - Hitting another new all-time high with today's 3rd consecutive gain. Its 50 DMA line ($36) defines important near-term support to watch.
>>> FEATURED STOCK ARTICLE : Hit Another New High With Gain Backed by Light Volume - 3/31/2023 |
View all notes |
Set NEW NOTE alert |
Company Profile |
SEC
News |
Chart |
Request a new note
C
A
S
I |
ALGM
-
NASDAQ
Allegro MicroSystems
Elec-Semiconductor Mfg
|
$44.34
|
+0.98
2.26% |
$44.40
|
1,073,428
76.45% of 50 DAV
50 DAV is 1,404,000
|
$48.72
-8.99%
|
1/31/2023
|
$37.80
|
PP = $38.38
|
|
MB = $40.30
|
Most Recent Note - 4/18/2023 5:58:14 PM
G - Posted a gain today with lighter volume after violating its 50 DMA line ($44.86) on the prior session with a damaging loss raising concerns and triggering a technical sell signal. Only a prompt rebound above the 50 DMA line would help its outlook improve.
>>> FEATURED STOCK ARTICLE : Consolidating Near 50 DMA Line After Recent Rally - 4/11/2023 |
View all notes |
Set NEW NOTE alert |
Company Profile |
SEC
News |
Chart |
Request a new note
C
A
S
I |
FIX
-
NYSE
Comfort Systems USA
MATERIALS and CONSTRUCTION - General Contractors
|
$132.75
|
+0.29
0.22% |
$134.74
|
137,111
48.28% of 50 DAV
50 DAV is 284,000
|
$152.13
-12.74%
|
2/23/2023
|
$136.52
|
PP = $128.78
|
|
MB = $135.22
|
Most Recent Note - 4/18/2023 5:59:04 PM
G - Volume totals have still been cooling while sputtering above prior highs in the $128 area which are acting as support. Only a prompt rebound above the 50 DMA line ($135.77) would help its outlook improve. Fundamentals remain strong.
>>> FEATURED STOCK ARTICLE : Pullback With Higher Volume While Consolidating - 4/4/2023 |
View all notes |
Set NEW NOTE alert |
Company Profile |
SEC
News |
Chart |
Request a new note
C
A
S
I |
Symbol/Exchange
Company Name
Industry Group |
PRICE |
CHANGE
(%Change) |
Day High |
Volume
(% DAV)
(% 50 day avg vol) |
52 Wk Hi
% From Hi |
Featured
Date |
Price
Featured |
Pivot Featured |
|
Max Buy |
KOF
-
NYSE
Coca-Cola Femsa ADR
FOOD and BEVERAGE - Beverages - Soft Drinks
|
$83.47
|
-0.04
-0.05% |
$84.08
|
183,371
100.20% of 50 DAV
50 DAV is 183,000
|
$84.57
-1.30%
|
3/7/2023
|
$76.63
|
PP = $77.11
|
|
MB = $80.97
|
Most Recent Note - 4/17/2023 3:43:23 PM
G - Hovering at its all-time high following a noted streak of 12 consecutive gains. Extended from the prior base. On pullbacks, prior highs in the $79-$77 area define initial support to watch above its 50 DMA line ($76.15).
>>> FEATURED STOCK ARTICLE : Streak of 11 Straight Gains into New High Territory - 4/12/2023 |
View all notes |
Set NEW NOTE alert |
Company Profile |
SEC
News |
Chart |
Request a new note
C
A
S
I |
ANET
-
NYSE
Arista Networks
Computer-Networking
|
$162.69
|
-0.73
-0.45% |
$165.75
|
1,633,989
63.36% of 50 DAV
50 DAV is 2,579,000
|
$171.44
-5.10%
|
3/8/2023
|
$147.59
|
PP = $148.67
|
|
MB = $156.10
|
Most Recent Note - 4/17/2023 5:48:38 PM
G - Ended lower for a 2nd small loss today with below-average volume. It is extended from any sound base after an impressive spurt of volume-driven gains. Prior highs in the $148-145 area define important support to watch along with its 50 DMA line ($150.77). See the latest FSU analysis for more details and a new annotated graph.
>>> FEATURED STOCK ARTICLE : Near High With Volume Cooling Following Volume-Driven Gains - 4/17/2023 |
View all notes |
Set NEW NOTE alert |
Company Profile |
SEC
News |
Chart |
Request a new note
C
A
S
I |
CLH
-
NYSE
Clean Harbors
Pollution Control
|
$143.20
|
-0.11
-0.08% |
$146.05
|
291,111
67.23% of 50 DAV
50 DAV is 433,000
|
$146.00
-1.92%
|
3/10/2023
|
$136.89
|
PP = $136.74
|
|
MB = $143.58
|
Most Recent Note - 4/17/2023 3:45:46 PM
Y - Perched at its all-time high and near its "max buy" level, holding its ground with volume totals cooling. Found prompt support near its 50 DMA line ($135.35). Below that important short-term average, the recent low ($129.93 on 3/24/23) defines the next important support where a violation would raise concerns and trigger a more worrisome technical sell signal. Fundamentals remain strong.
>>> FEATURED STOCK ARTICLE : Finding Support Recently at 50-Day Moving Average Line - 3/29/2023 |
View all notes |
Set NEW NOTE alert |
Company Profile |
SEC
News |
Chart |
Request a new note
C
A
S
I |
MTRN
-
NYSE
Materion
METALS and MINING - Industrial Metals and Minerals
|
$114.80
|
+0.45
0.39% |
$119.75
|
148,301
113.21% of 50 DAV
50 DAV is 131,000
|
$119.70
-4.09%
|
4/18/2023
|
$114.52
|
PP = $118.30
|
|
MB = $124.22
|
Most Recent Note - 4/18/2023 5:54:49 PM
Y - Finished in the lower half of its intra-day range today after highlighted in yellow with pivot point cited based on its 3/03/23 high plus 10 cents in the earlier mid-day report. Hit a new all-time high with today's early gain, but encountered distributional pressure. Subsequent gains and a strong close above the pivot point backed by at least +40% above average volume may trigger a proper technical buy signal. Reported earnings +33% on +9% sales revenues for the Dec '22 quarter versus the year-ago period. Three of the past 4 quarterly comparisons were above the +25% minimum earnings guideline (C criteria). A downturn in its FY '20 annual earnings history (A criteria) has been followed by much stronger '21 and '22 results. See the latest FSU analysis for more details and a new annotated graph.
>>> FEATURED STOCK ARTICLE : Encountered Distributional Pressure When Poised for Breakout - 4/18/2023 |
View all notes |
Set NEW NOTE alert |
Company Profile |
SEC
News |
Chart |
Request a new note
C
A
S
I |
|
|
|
THESE ARE NOT BUY RECOMMENDATIONS!
Comments contained in the body of this report are technical
opinions only. The material herein has been obtained
from sources believed to be reliable and accurate, however,
its accuracy and completeness cannot be guaranteed.
This site is not an investment advisor, hence it does
not endorse or recommend any securities or other investments.
Any recommendation contained in this report may not
be suitable for all investors and it is not to be deemed
an offer or solicitation on our part with respect to
the purchase or sale of any securities. All trademarks,
service marks and trade names appearing in this report
are the property of their respective owners, and are
likewise used for identification purposes only.
This report is a service available
only to active Paid Premium Members.
You may opt-out of receiving report notifications
at any time. Questions or comments may be submitted
by writing to Premium Membership Services 665 S.E. 10 Street, Suite 201 Deerfield Beach, FL 33441-5634 or by calling 1-800-965-8307
or 954-785-1121.
|
|
|