You are not logged in.
This means you
CAN ONLY VIEW reports that were published prior to Saturday, April 5, 2025.
You
MUST UPGRADE YOUR MEMBERSHIP if you want to see any current reports.
AFTER MARKET UPDATE - FRIDAY, APRIL 16TH, 2021
Previous After Market Report Next After Market Report >>>
|
|
|
|
DOW |
+164.68 |
34,200.67 |
+0.48% |
|
Volume |
1,154,096,212 |
+36% |
|
Volume |
4,409,792,200 |
+1% |
|
NASDAQ |
+13.58 |
14,052.34 |
+0.10% |
|
Advancers |
1,828 |
56% |
|
Advancers |
1,887 |
45% |
|
S&P 500 |
+15.05 |
4,185.47 |
+0.36% |
|
Decliners |
1,424 |
44% |
|
Decliners |
2,261 |
54% |
|
Russell 2000 |
+5.60 |
2,262.67 |
+0.25% |
|
52 Wk Highs |
433 |
|
|
52 Wk Highs |
258 |
|
|
S&P 600 |
+4.06 |
1,347.95 |
+0.30% |
|
52 Wk Lows |
21 |
|
|
52 Wk Lows |
95 |
|
|
 |
Major Indices Rose While Broader Market Action Was Mixed
Kenneth J. Gruneisen - Passed the CAN SLIM® Master's Exam
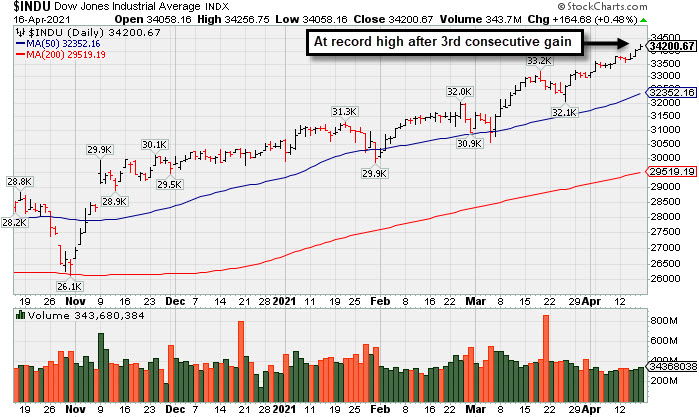
The Dow and S&P 500 each closed at fresh record levels, rising 164 points and 0.4%, respectively. Both major averages climbed for a fourth consecutive week, with the 30-stock index rising 1.2% and the large-cap benchmark rallying 1.4%. The Nasdaq Composite reversed earlier losses, rising 0.1% to cap a 1.1% weekly advance. The volume totals were higher than the prior session on the NYSE and on the Nasdaq exchange. Advancers led decliners by a 9-7 margin on the NYSE, but decliners led advancers by 11-9 on the Nasdaq exchange. There were 79 high-ranked companies from the Leaders List that hit new 52-week highs and were listed on the BreakOuts Page, versus the total of 39 on the prior session. New 52-week highs totals expanded and solidly outnumbered new 52-week lows on the NYSE on the Nasdaq exchange. The major indices (M criteria) are in a confirmed uptrend. Investors are reminded to always make buying and selling decisions on case-by-case basis under the strict criteria and rules of the fact-based investment system.
PICTURED: The Dow Jones Industrial Average is at a new record high after 3 consecutive gains.
U.S. stocks finished higher on Friday as investors digested another influx of corporate earnings results and economic data. Data out of China supported sentiment, with an update showing the world’s second largest economy grew a record 18.3% year-over-year in the first quarter. Domestic data also continued to signal a recovery, with housing starts soaring 19.4% in March, jumping to the highest level since 2006. Meanwhile, building permits rose 2.7%, topping consensus estimates of 1.7% and rebounding from a 10.8% decline in February. Separately, a preliminary reading of consumer sentiment from the University of Michigan improved to 86.5 in April from prior month’s 84.9 figure. Treasuries weakened, with the yield on the 10-year note rising four basis points to 1.59%. In commodities, WTI crude fell 0.5% to $63.14/barrel, but still posted its biggest weekly gain since early March (+6.4%).
Nine of 11 S&P 500 sectors finished in positive territory, with Energy and Information Technology the lone laggards. The Materials group paced the gains, with PPG Industries surging more than 8% after surpassing consensus expectations and providing upbeat forward guidance. In other earnings, shares of Morgan Stanley (MS -2.72%) fell after the bank disclosed a $911 million loss related to the collapse of Archegos Capital Management following a top and bottom line beat. |
 Kenneth J. Gruneisen started out as a licensed stockbroker in August 1987, a couple of months prior to the historic stock market crash that took the Dow Jones Industrial Average down -22.6% in a single day. He has published daily fact-based fundamental and technical analysis on high-ranked stocks online for two decades. Through FACTBASEDINVESTING.COM, Kenneth provides educational articles, news, market commentary, and other information regarding proven investment systems that work in good times and bad.
Comments contained in the body of this report are technical opinions only and are not necessarily those of Gruneisen Growth Corp. The material herein has been obtained from sources believed to be reliable and accurate, however, its accuracy and completeness cannot be guaranteed. Our firm, employees, and customers may effect transactions, including transactions contrary to any recommendation herein, or have positions in the securities mentioned herein or options with respect thereto. Any recommendation contained in this report may not be suitable for all investors and it is not to be deemed an offer or solicitation on our part with respect to the purchase or sale of any securities. |
|
 |
Retail, Financial, Networking, and Gold & Silver Indexes Rose
Kenneth J. Gruneisen - Passed the CAN SLIM® Master's Exam
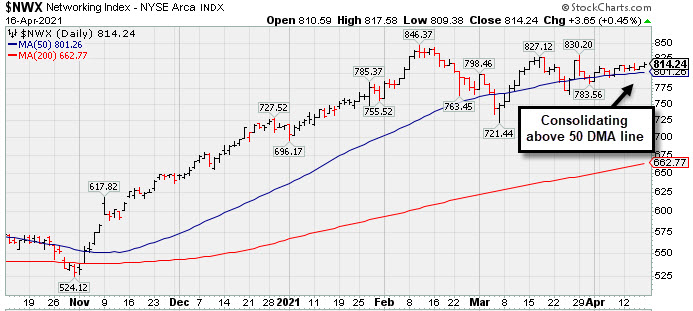
The Retail Index ($RLX +0.92%) posted a solid gain and financial stocks helped give the major indices a boost as the Broker/Dealer Index ($XBD +0.31%) and Bank Index ($BKX +0.46%) both edged higher. The tech sector was mixed as the Semiconductor Index ($SOX -0.56%) edged lower and the Biotech Index ($BTK -0.03%) finished flay while the Networking Index ($NWX +0.45%) edged higher. Commodity-linked groups were mixed as the Oil Services Index ($OSX -1.21%) and Integrated Oil Index ($XOI -0.78%) both lost ground, meanwhile, the Gold & Silver Index ($XAU +0.68%) posted a modest gain. PICTURED: The Networking Index ($NWX +0.45%) is consolidating above its 50-day moving average (DMA) line, perched near its record high.
| Oil Services |
$OSX |
51.91 |
-0.64 |
-1.21% |
+17.10% |
| Integrated Oil |
$XOI |
1,001.21 |
-7.82 |
-0.78% |
+26.34% |
| Semiconductor |
$SOX |
3,253.08 |
-18.25 |
-0.56% |
+16.37% |
| Networking |
$NWX |
814.24 |
+3.65 |
+0.45% |
+13.54% |
| Broker/Dealer |
$XBD |
462.58 |
+1.44 |
+0.31% |
+22.50% |
| Retail |
$RLX |
3,960.20 |
+36.11 |
+0.92% |
+11.14% |
| Gold & Silver |
$XAU |
149.16 |
+1.00 |
+0.68% |
+3.45% |
| Bank |
$BKX |
123.01 |
+0.57 |
+0.46% |
+25.64% |
| Biotech |
$BTK |
5,549.74 |
-1.93 |
-0.03% |
-3.30% |
|
|
|
 |
Finding Support During Consolidation Above 50-Day Moving Average
Kenneth J. Gruneisen - Passed the CAN SLIM® Master's Exam
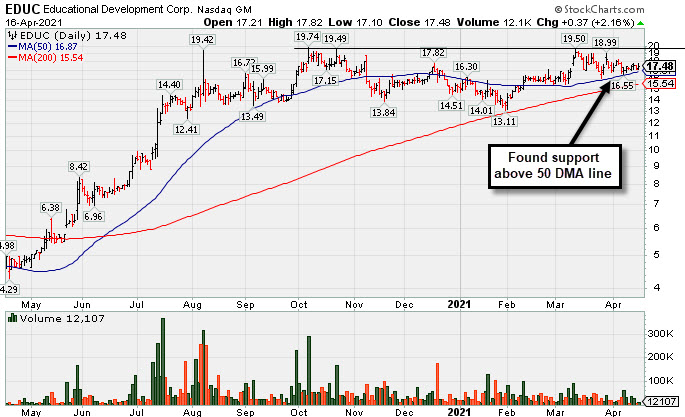
Educational Development (EDUC +$0.37 or +2.16% to $17.48) is still consolidating above its 50-day moving average (DMA) line ($16.85) which defines important near-term support. For many months it has met stubborn resistance in the $19-20 area. Subsequent gains above the pivot point backed by at least +40% above average volume are still needed to trigger a proper technical buy signal.
EDUC was highlighted in yellow with pivot point cited based on its 10/07/20 high plus 10 cents in the 3/10/21 mid-day report (read here). It was last shown in this FSU section on 3/30/21 with an annotated graph included under the headline, "Consolidating Above 50 DMA Line Perched Near High".
It found support at its 200-day moving average (DMA) line ($15.68) since noted with caution in the 10/22/20 mid-day report. It also reported earnings +55% on +63% sales revenues for the Nov '20 quarter versus the year-ago period, marking its 3rd strong quarterly comparison above the +25% minimum guideline (C criteria), helping it better match with the fact-based investment system's fundamental guidelines. This thinly traded Media - Books firm's annual earnings (A criteria) history has strong and its Earnings Per Share Rating is 98. Share price was impacted by a 2-1 split as of 8/23/18.
The number of top-rated funds owning its shares rose from 34 in Mar '20 to 48 in Dec '20 a reassuring sign concerning the I criteria. It has a small supply of only 6.1 million share in the float (S criteria) which can contribute to greater price volatility in the even of institutional buying or selling. The Media-Books industry group currently has a B+ (74) Group Relative Strength Rating. |
|
|
Color Codes Explained :
Y - Better candidates highlighted by our
staff of experts.
G - Previously featured
in past reports as yellow but may no longer be buyable under the
guidelines.
***Last / Change / Volume data in this table is the closing quote data***
Symbol/Exchange
Company Name
Industry Group |
PRICE |
CHANGE
(%Change) |
Day High |
Volume
(% DAV)
(% 50 day avg vol) |
52 Wk Hi
% From Hi |
Featured
Date |
Price
Featured |
Pivot Featured |
|
Max Buy |
 FBC
-
NYSE
FBC
-
NYSE
Flagstar Bancorp Inc
BANKING - Savings and Loans
|
$43.81
|
-0.40
-0.90% |
$44.80
|
398,660
65.62% of 50 DAV
50 DAV is 607,500
|
$51.58
-15.06%
|
3/4/2021
|
$47.26
|
PP = $48.02
|
|
MB = $50.42
|
Most Recent Note - 4/13/2021 5:42:02 PM
G - Still sputtering just below its 50 DMA line ($45.63) which has acted as resistance in recent weeks. Near-term support to watch is prior lows. Relative Strength Rating is 75, below the 80+ minimum guideline. See the latest FSU analysis for more details and a new annotated graph.
>>> FEATURED STOCK ARTICLE : 50-Day Moving Average Line Acted as Resistance - 4/13/2021 |
View all notes |
Set NEW NOTE alert |
Company Profile |
SEC
News |
Chart |
Request a new note
C
A
S
I |
CRL
-
NYSE
Charles River Labs Intl
DRUGS - Biotechnology
|
$323.38
|
+3.01
0.94% |
$323.89
|
377,523
118.72% of 50 DAV
50 DAV is 318,000
|
$320.95
0.76%
|
12/17/2020
|
$247.06
|
PP = $257.98
|
|
MB = $270.88
|
Most Recent Note - 4/15/2021 5:42:10 PM
G - Posted another solid gain today for a new all-time high. Its 50 DMA line ($287) acted as support throughout its ongoing ascent. Its Relative Strength Rating is 81, above the 80+ minimum guideline for buy candidates. Dec '20 quarterly earnings rose +19% on +14% sales revenues versus the year ago period, below the +25% minimum earnings guideline (C criteria), raising fundamental concerns.
>>> FEATURED STOCK ARTICLE : Perched at Record High After Rally From 50-Day Moving Average - 4/9/2021 |
View all notes |
Set NEW NOTE alert |
Company Profile |
SEC
News |
Chart |
Request a new note
C
A
S
I |
BRKS
-
NASDAQ
Brooks Automation
ELECTRONICS - Semiconductor Equipment and Mate
|
$102.33
|
+2.53
2.54% |
$103.09
|
1,061,935
150.84% of 50 DAV
50 DAV is 704,000
|
$101.63
0.69%
|
4/5/2021
|
$99.31
|
PP = $91.88
|
|
MB = $96.47
|
Most Recent Note - 4/15/2021 5:40:29 PM
G - Color code is changed to green after quietly rising back above its "max buy" level. Prior highs in the $91 area define initial support to watch above its 50 DMA line ($84)
>>> FEATURED STOCK ARTICLE : High Ranked Semiconductor Equipment Firm Powered Higher - 4/7/2021 |
View all notes |
Set NEW NOTE alert |
Company Profile |
SEC
News |
Chart |
Request a new note
C
A
S
I |
ENTG
-
NASDAQ
Entegris Inc
ELECTRONICS - Semiconductor Equipment and Mate
|
$117.38
|
-1.92
-1.61% |
$119.52
|
810,372
84.59% of 50 DAV
50 DAV is 958,000
|
$126.41
-7.14%
|
4/1/2021
|
$118.42
|
PP = $110.37
|
|
MB = $115.89
|
Most Recent Note - 4/13/2021 5:46:21 PM
G - Still hovering near its all-time high and stubbornly holding its ground following a noted spurt of volume-driven gains. Prior highs in the $114-110 area define near-term support to watch on pullbacks.
>>> FEATURED STOCK ARTICLE : Strong Breakout Action With +67% Above Average Volume - 4/1/2021 |
View all notes |
Set NEW NOTE alert |
Company Profile |
SEC
News |
Chart |
Request a new note
C
A
S
I |
OPY
-
NYSE
Oppenheimer Holdings Inc
FINANCIAL SERVICES - Investment Brokerage - Regiona
|
$44.66
|
+0.18
0.40% |
$45.22
|
125,490
102.86% of 50 DAV
50 DAV is 122,000
|
$44.95
-0.65%
|
2/25/2021
|
$38.95
|
PP = $38.11
|
|
MB = $40.02
|
Most Recent Note - 4/12/2021 5:42:42 PM
G - Posted a 2nd consecutive gain with light volume, approaching its prior high. Its 50 DMA line ($39.59) and prior low define near-term support to watch.
>>> FEATURED STOCK ARTICLE : Oppenheimer Consolidating Near Max Buy Level - 3/31/2021 |
View all notes |
Set NEW NOTE alert |
Company Profile |
SEC
News |
Chart |
Request a new note
C
A
S
I |
Symbol/Exchange
Company Name
Industry Group |
PRICE |
CHANGE
(%Change) |
Day High |
Volume
(% DAV)
(% 50 day avg vol) |
52 Wk Hi
% From Hi |
Featured
Date |
Price
Featured |
Pivot Featured |
|
Max Buy |
EDUC
-
NASDAQ
Educational Development
WHOLESALE - Basic Materials Wholesale
|
$17.48
|
+0.37
2.16% |
$17.82
|
12,107
39.05% of 50 DAV
50 DAV is 31,000
|
$20.00
-12.60%
|
3/10/2021
|
$17.89
|
PP = $20.10
|
|
MB = $21.11
|
 Most Recent Note - 4/16/2021 5:33:49 PM
Y - Still consolidating above its 50 DMA line ($16.90) which defines important near-term support. Met stubborn resistance in the $19-20 area. Subsequent gains above the pivot point backed by at least +40% above average volume are needed to trigger a proper technical buy signal. See the latest FSU analysis for more details and a new annotated graph.
>>> FEATURED STOCK ARTICLE : Finding Support During Consolidation Above 50-Day Moving Average - 4/16/2021 |
View all notes |
Set NEW NOTE alert |
Company Profile |
SEC
News |
Chart |
Request a new note
C
A
S
I |
SMPL
-
NASDAQ
Simply Good Foods Co
Food-Confectionery
|
$33.42
|
+0.33
1.00% |
$33.72
|
430,609
60.77% of 50 DAV
50 DAV is 708,600
|
$35.25
-5.19%
|
12/28/2020
|
$30.40
|
PP = $31.44
|
|
MB = $33.01
|
Most Recent Note - 4/14/2021 5:15:55 PM
G - Showed resilience and remains perched near prior highs. Reported Feb '21 quarterly earnings +9% on +2% sales revenues versus the year ago period, below the +25% minimum earnings guideline (C criteria), raising fundamental concerns. Found prompt support near its 50 DMA line ($30.57) but its current Relative Strength Rating is 73, below the 80+ minimum guideline for buy candidates. See the latest FSU analysis for more details and a new annotated graph.
>>> FEATURED STOCK ARTICLE : Perched Near High But Fundamental Concerns Were Raised - 4/14/2021 |
View all notes |
Set NEW NOTE alert |
Company Profile |
SEC
News |
Chart |
Request a new note
C
A
S
I |
QRVO
-
NASDAQ
Qorvo Inc
ELECTRONICS - Semiconductor - Integrated Cir
|
$192.27
|
-0.57
-0.30% |
$195.79
|
991,161
71.51% of 50 DAV
50 DAV is 1,386,000
|
$199.94
-3.84%
|
4/1/2021
|
$190.48
|
PP = $191.92
|
|
MB = $201.52
|
Most Recent Note - 4/12/2021 5:44:22 PM
Y - Posted a small gain today with lighter volume. Perched near its all-time high, it recently wedging up from any orderly 9-week base. Prior highs in the $191-185 area define initial support to watch on pullbacks. See the latest FSU analysis for more details and an annotated graph.
>>> FEATURED STOCK ARTICLE : Hit Another New High With Even Less Volume Conviction - 4/5/2021 |
View all notes |
Set NEW NOTE alert |
Company Profile |
SEC
News |
Chart |
Request a new note
C
A
S
I |
YETI
-
NYSE
Yeti Holdings Inc
Leisure-Products
|
$86.81
|
+2.31
2.73% |
$87.72
|
1,748,610
127.26% of 50 DAV
50 DAV is 1,374,000
|
$85.39
1.66%
|
4/6/2021
|
$76.95
|
PP = $79.42
|
|
MB = $83.39
|
Most Recent Note - 4/16/2021 5:37:53 PM
G - Color code is changed to green after hitting another new all-time high and rallying above its "max" buy level, getting extended from the latest base. Prior highs in the $80 area define initial support to watch on pullbacks.
>>> FEATURED STOCK ARTICLE : YETI Perched Within Striking Distance of High - 4/7/2021 |
View all notes |
Set NEW NOTE alert |
Company Profile |
SEC
News |
Chart |
Request a new note
C
A
S
I |
DT
-
NYSE
Dynatrace Inc
Computer Sftwr-Enterprse
|
$53.11
|
-1.14
-2.10% |
$54.22
|
1,002,298
41.33% of 50 DAV
50 DAV is 2,424,900
|
$56.94
-6.73%
|
2/4/2021
|
$51.39
|
PP = $48.95
|
|
MB = $51.40
|
Most Recent Note - 4/16/2021 5:40:17 PM
G - Volume totals have been cooling while consolidating near its 52-week high. Recent lows in the $45 area define important near-term support to watch on pullbacks. Its Relative Strength Rating is 75 is still below the 80+ minimum guideline for buy candidates. Fundamentals remain strong after it reported Dec '20 earnings +70% on +28% sales revenues versus the year ago period.
>>> FEATURED STOCK ARTICLE : Gap Up Rebounding Further Above 50-Day Moving Average - 4/8/2021 |
View all notes |
Set NEW NOTE alert |
Company Profile |
SEC
News |
Chart |
Request a new note
C
A
S
I |
Symbol/Exchange
Company Name
Industry Group |
PRICE |
CHANGE
(%Change) |
Day High |
Volume
(% DAV)
(% 50 day avg vol) |
52 Wk Hi
% From Hi |
Featured
Date |
Price
Featured |
Pivot Featured |
|
Max Buy |
MRBK
-
NASDAQ
Meridian Corp
Banks-Northeast
|
$25.84
|
+0.12
0.47% |
$26.30
|
34,298
92.70% of 50 DAV
50 DAV is 37,000
|
$27.96
-7.58%
|
2/22/2021
|
$25.58
|
PP = $26.10
|
|
MB = $27.41
|
Most Recent Note - 4/16/2021 1:09:23 PM
Y - Encountering distributional pressure in recent weeks yet still consolidating above its 50 DMA line ($25.23) and prior low ($24.13 on 3/25/21). Damaging losses leading to violations may trigger technical sell signals. Its Relative Strength Rating is 83, above the 80+ minimum guideline.
>>> FEATURED STOCK ARTICLE : Encountering Distributional Pressure - 4/12/2021 |
View all notes |
Set NEW NOTE alert |
Company Profile |
SEC
News |
Chart |
Request a new note
C
A
S
I |
|
|
|
THESE ARE NOT BUY RECOMMENDATIONS!
Comments contained in the body of this report are technical
opinions only. The material herein has been obtained
from sources believed to be reliable and accurate, however,
its accuracy and completeness cannot be guaranteed.
This site is not an investment advisor, hence it does
not endorse or recommend any securities or other investments.
Any recommendation contained in this report may not
be suitable for all investors and it is not to be deemed
an offer or solicitation on our part with respect to
the purchase or sale of any securities. All trademarks,
service marks and trade names appearing in this report
are the property of their respective owners, and are
likewise used for identification purposes only.
This report is a service available
only to active Paid Premium Members.
You may opt-out of receiving report notifications
at any time. Questions or comments may be submitted
by writing to Premium Membership Services 665 S.E. 10 Street, Suite 201 Deerfield Beach, FL 33441-5634 or by calling 1-800-965-8307
or 954-785-1121.
|
|
|