You are not logged in.
This means you
CAN ONLY VIEW reports that were published prior to Wednesday, April 16, 2025.
You
MUST UPGRADE YOUR MEMBERSHIP if you want to see any current reports.
AFTER MARKET UPDATE - FRIDAY, MARCH 26TH, 2021
Previous After Market Report Next After Market Report >>>
|
|
|
|
DOW |
+453.40 |
33,072.88 |
+1.39% |
|
Volume |
1,139,517,054 |
+7% |
|
Volume |
5,140,458,000 |
-8% |
|
NASDAQ |
+161.05 |
13,138.73 |
+1.24% |
|
Advancers |
2,522 |
78% |
|
Advancers |
2,590 |
64% |
|
S&P 500 |
+65.02 |
3,974.54 |
+1.66% |
|
Decliners |
731 |
22% |
|
Decliners |
1,487 |
36% |
|
Russell 2000 |
+38.36 |
2,221.48 |
+1.76% |
|
52 Wk Highs |
184 |
|
|
52 Wk Highs |
121 |
|
|
S&P 600 |
+31.27 |
1,331.26 |
+2.41% |
|
52 Wk Lows |
24 |
|
|
52 Wk Lows |
88 |
|
|
 |
Major Indices Bounce Back as Leadership Improves
Kenneth J. Gruneisen - Passed the CAN SLIM® Master's Exam
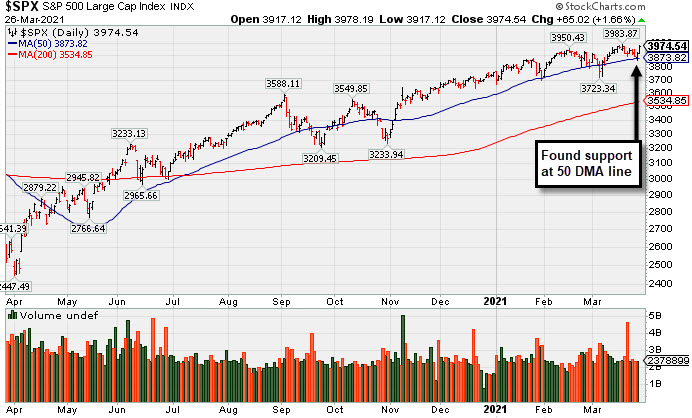
The S&P 500 jumped 1.7%, while the Dow climbed 453 points, pushing both benchmarks into positive territory for the week (+1.6% and +1.4%, respectively). The Nasdaq Composite rose 1.2%, with the tech-heavy index trimming its weekly loss to 0.6%. The Russell 2000 bounced back 1.3%, ending the week down 1.8%. The volume totals were mixed, higher than the prior session total on the NYSE and lighter on the Nasdaq exchange. Breadth was positive as advancers led decliners by more than a 3-1 margin on the NYSE and by a 5-3 margin on the Nasdaq exchange. Leadership improved as there were 29 high-ranked companies from the Leaders List that hit new 52-week highs and were listed on the BreakOuts Page, versus the total of 6 on the prior session. New 52-week highs totals improved and outnumbered new 52-week lows totals for the first time since Monday on both the NYSE and the Nasdaq exchange. The major indices (M criteria) are in an uptrend under pressure. Investors are reminded to always make buying and selling decisions on case-by-case basis under the strict criteria and rules of the fact-based investment system.
PICTURED: The S&P 500 Index found support at its 50-day moving average (DMA) line.
U.S. stocks finished higher on Friday in a broad-based afternoon rally that ended a volatile week. Investors resumed an optimistic economic outlook and digested a deluge of data. Ten of 11 S&P 500 sectors advanced with Communication Services bucking the uptrend. Shares of Discovery and ViacomCBS each tumbled more than 27% following another analyst downgrade amid concerns surrounding their future position in the crowded media industry. Tech shares rebounded, joining the other sectors to turn positive for the month of March. Financials caught a tailwind after the Federal Reserve announced that restrictions on bank dividends and stock buybacks would be lifted on June 30.
Treasuries weakened, with the yield on the 10-year note up four basis points to 1.67%. Still, government bonds snapped a seven-week losing streak. On the data front, the core PCE deflator (the Fed’s preferred proxy for inflation) rose 1.4% year-over-year in February, slowing from the previous 1.5% pace. Personal income slipped 7.1% and personal spending dropped 1% in February as the prior month’s stimulus effects faded. Another report from the University of Michigan showed consumer sentiment improved in March. In commodities, WTI crude pared its third straight weekly decline, gaining 3.9% to $60.86/barrel as a vessel blocking the Suez Canal continued to disrupt global trade. |
 Kenneth J. Gruneisen started out as a licensed stockbroker in August 1987, a couple of months prior to the historic stock market crash that took the Dow Jones Industrial Average down -22.6% in a single day. He has published daily fact-based fundamental and technical analysis on high-ranked stocks online for two decades. Through FACTBASEDINVESTING.COM, Kenneth provides educational articles, news, market commentary, and other information regarding proven investment systems that work in good times and bad.
Comments contained in the body of this report are technical opinions only and are not necessarily those of Gruneisen Growth Corp. The material herein has been obtained from sources believed to be reliable and accurate, however, its accuracy and completeness cannot be guaranteed. Our firm, employees, and customers may effect transactions, including transactions contrary to any recommendation herein, or have positions in the securities mentioned herein or options with respect thereto. Any recommendation contained in this report may not be suitable for all investors and it is not to be deemed an offer or solicitation on our part with respect to the purchase or sale of any securities. |
|
 |
Financial, Retail, Tech, and Commodity-Linked Groups Rose
Kenneth J. Gruneisen - Passed the CAN SLIM® Master's Exam
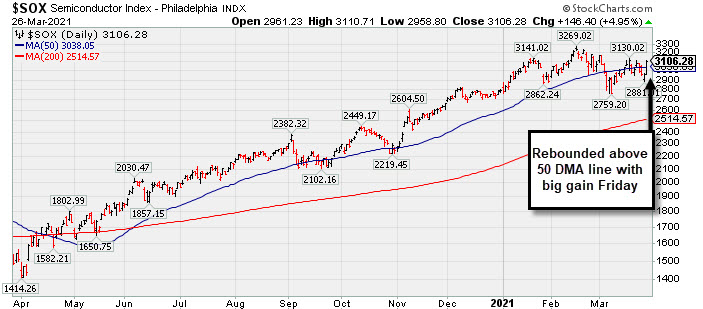
The Semiconductor Index ($SOX +4.95%) and Networking Index ($NWX +4.01%) led the tech sector rebound while the Biotech Index ($BTK +0.85%) also edged higher. The Broker/Dealer Index ($XBD +1.54%), Bank Index ($BKX +1.95%), and Retail Index ($RLX +1.29%) posted unanimous gains. Commodity-linked groups also had a positive bias as the Oil Services Index ($OSX +2.56%) and Integrated Oil Index ($XOI +2.52%) posted solid gains along with the Gold & Silver Index ($XAU +2.28%).
PICTURED: The Semiconductor Index ($SOX +4.95%) rebounded above its 50-day moving average (DMA) line with a big gain on Friday.
| Oil Services |
$OSX |
55.03 |
+1.37 |
+2.56% |
+24.14% |
| Integrated Oil |
$XOI |
1,033.42 |
+25.38 |
+2.52% |
+30.40% |
| Semiconductor |
$SOX |
3,106.28 |
+146.40 |
+4.95% |
+11.12% |
| Networking |
$NWX |
820.96 |
+31.66 |
+4.01% |
+14.48% |
| Broker/Dealer |
$XBD |
444.01 |
+6.72 |
+1.54% |
+17.59% |
| Retail |
$RLX |
3,628.26 |
+46.30 |
+1.29% |
+1.82% |
| Gold & Silver |
$XAU |
135.87 |
+3.03 |
+2.28% |
-5.77% |
| Bank |
$BKX |
121.67 |
+2.32 |
+1.95% |
+24.27% |
| Biotech |
$BTK |
5,471.09 |
+46.09 |
+0.85% |
-4.67% |
|
|
|
 |
Volume +231% Above Average With Breakout Gain
Kenneth J. Gruneisen - Passed the CAN SLIM® Master's Exam
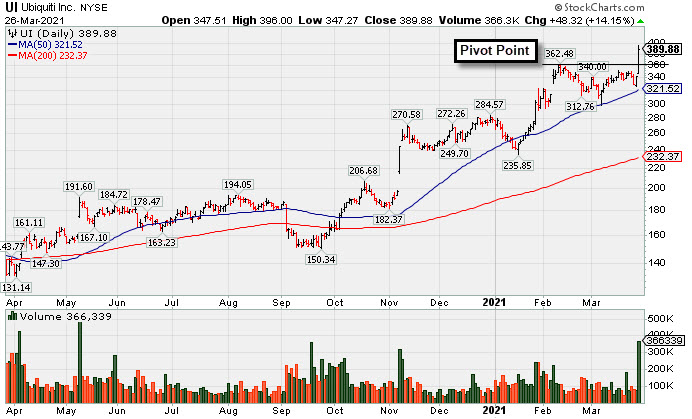
Ubiquity Inc (UI +$48.32 or +14.15% to $389.88) finished strong after highlighted in yellow with pivot point cited based on its 2/10/21 high plus 10 cents in the earlier mid-day report (read here). It gapped up today and powered into new (N criteria) all-time high territory with a considerable volume-driven gain triggering a technical buy signal. It found support above its 50-day moving average (DMA) line since last noted in the 2/05/21 mid-day report.
Earnings rose +81% on +56% sales revenues for the Dec '20 quarter versus the year ago period. Recent quarterly comparisons show accelerating sales revenues and strong earnings growth near or well above the +25% minimum guideline (C criteria). It has a highest possible Earnings Per Share Rating of 99. Annual earnings growth has been strong and steady (A criteria).
The number of top-rated funds owning its shares rose from 322 in Mar '20 to 325 in Dec '20. Its current Up/Down Volume Ratio of 1.5 is an unbiased indication its shares have been under accumulation over the past 50 days. There is a small supply of of only 6.3 million shares (S criteria) in the public float, which can contribute to greater volatility in the event of institutional buying or selling. The Telecom - Infrastructure group currently has a Group Relative Strength Rating of 92 and it is rated 16th on the 197 Industry Groups list.
|
|
|
Color Codes Explained :
Y - Better candidates highlighted by our
staff of experts.
G - Previously featured
in past reports as yellow but may no longer be buyable under the
guidelines.
***Last / Change / Volume data in this table is the closing quote data***
Symbol/Exchange
Company Name
Industry Group |
PRICE |
CHANGE
(%Change) |
Day High |
Volume
(% DAV)
(% 50 day avg vol) |
52 Wk Hi
% From Hi |
Featured
Date |
Price
Featured |
Pivot Featured |
|
Max Buy |
 FBC
-
NYSE
FBC
-
NYSE
Flagstar Bancorp Inc
BANKING - Savings and Loans
|
$45.00
|
+0.38
0.85% |
$45.57
|
366,831
54.67% of 50 DAV
50 DAV is 671,000
|
$51.58
-12.76%
|
3/4/2021
|
$47.26
|
PP = $48.02
|
|
MB = $50.42
|
Most Recent Note - 3/23/2021 4:21:06 PM
G - Suffered a 4th consecutive loss today with lighter volume and violated its 50 DMA line ($45.59) raising greater concerns. Color code is changed to green. Only a prompt rebound would help its outlook improve. Near-term support to watch is prior lows. See the latest FSU analysis for more details and an annotated graph.
>>> FEATURED STOCK ARTICLE : Slumping Into Prior Base Following Breakout - 3/22/2021 |
View all notes |
Set NEW NOTE alert |
Company Profile |
SEC
News |
Chart |
Request a new note
C
A
S
I |
CRL
-
NYSE
Charles River Labs Intl
DRUGS - Biotechnology
|
$288.04
|
+6.09
2.16% |
$288.31
|
300,618
95.98% of 50 DAV
50 DAV is 313,200
|
$303.79
-5.18%
|
12/17/2020
|
$247.06
|
PP = $257.98
|
|
MB = $270.88
|
Most Recent Note - 3/23/2021 5:31:37 PM
G - Today's loss had lighter volume as it slumped near its 50 DMA line ($279) which acted as support throughout its ongoing ascent. Its Relative Strength Rating is 76, below the 80+ minimum guideline for buy candidates. Recently reported Dec '20 quarterly earnings +19% on +14% sales revenues versus the year ago period, below the +25% minimum earnings guideline (C criteria), raising fundamental concerns.
>>> FEATURED STOCK ARTICLE : Made Gradual Progress, Now Extended From Any Sound Base - 3/16/2021 |
View all notes |
Set NEW NOTE alert |
Company Profile |
SEC
News |
Chart |
Request a new note
C
A
S
I |
OPY
-
NYSE
Oppenheimer Holdings Inc
FINANCIAL SERVICES - Investment Brokerage - Regiona
|
$40.12
|
+0.19
0.48% |
$40.72
|
110,750
82.04% of 50 DAV
50 DAV is 135,000
|
$44.38
-9.60%
|
2/25/2021
|
$38.95
|
PP = $38.11
|
|
MB = $40.02
|
Most Recent Note - 3/25/2021 11:38:35 AM
Y - Pulling back for a 5th consecutive loss, consolidating after getting extended from the previously noted base. Its 50 DMA line ($37.53) defines near-term support to watch.
>>> FEATURED STOCK ARTICLE : Perched at Record High After 6 Consecutive Gains - 3/12/2021 |
View all notes |
Set NEW NOTE alert |
Company Profile |
SEC
News |
Chart |
Request a new note
C
A
S
I |
CLFD
-
NASDAQ
Clearfield Inc
TELECOMMUNICATIONS - Cables / Satalite Equipment
|
$30.45
|
+0.55
1.84% |
$30.60
|
84,343
45.84% of 50 DAV
50 DAV is 184,000
|
$38.75
-21.42%
|
1/20/2021
|
$31.38
|
PP = $28.42
|
|
MB = $29.84
|
Most Recent Note - 3/23/2021 4:12:07 PM
G - Sank further below its 50 DMA line ($32.62) with today's 4th consecutive damaging loss. Prior highs in the $28 area previously acted as support. Fundamentals remain strong.
>>> FEATURED STOCK ARTICLE : Quiet Gain Repaired 50-Day Moving Average Violation - 3/9/2021 |
View all notes |
Set NEW NOTE alert |
Company Profile |
SEC
News |
Chart |
Request a new note
C
A
S
I |
EDUC
-
NASDAQ
Educational Development
WHOLESALE - Basic Materials Wholesale
|
$17.30
|
+0.53
3.16% |
$17.75
|
15,075
39.67% of 50 DAV
50 DAV is 38,000
|
$20.00
-13.50%
|
3/10/2021
|
$17.89
|
PP = $20.10
|
|
MB = $21.11
|
Most Recent Note - 3/23/2021 5:29:49 PM
Y - Retreating after challenging its 52-week high. Subsequent gains above the pivot point backed by at least +40% above average volume are needed to trigger a proper technical buy signal. This thinly traded Media - Books firm's annual earnings (A criteria) history has strong.
>>> FEATURED STOCK ARTICLE : Gain Leaves Media - Books Firm Perched Near Pivot Point - 3/10/2021 |
View all notes |
Set NEW NOTE alert |
Company Profile |
SEC
News |
Chart |
Request a new note
C
A
S
I |
Symbol/Exchange
Company Name
Industry Group |
PRICE |
CHANGE
(%Change) |
Day High |
Volume
(% DAV)
(% 50 day avg vol) |
52 Wk Hi
% From Hi |
Featured
Date |
Price
Featured |
Pivot Featured |
|
Max Buy |
SMPL
-
NASDAQ
Simply Good Foods Co
Food-Confectionery
|
$30.70
|
+1.26
4.28% |
$30.91
|
753,392
107.84% of 50 DAV
50 DAV is 698,600
|
$35.25
-12.91%
|
12/28/2020
|
$30.40
|
PP = $31.44
|
|
MB = $33.01
|
 Most Recent Note - 3/26/2021 5:33:14 PM
G - Today's gain helped it rebound and close well above its 50 DMA line ($29.80) helping its outlook improve. However, its Relative Strength Rating is still 63, below the 80+ minimum guideline for buy candidates. Faces resistance due to overhead supply up to the $35 level.
>>> FEATURED STOCK ARTICLE : Violation of 50-Day Moving Average Triggered Technical Sell Signal - 3/24/2021 |
View all notes |
Set NEW NOTE alert |
Company Profile |
SEC
News |
Chart |
Request a new note
C
A
S
I |
XPEL
-
NASDAQ
Xpel Inc
Auto/Truck-Tires andamp; Misc
|
$52.86
|
-1.13
-2.09% |
$54.69
|
135,637
45.52% of 50 DAV
50 DAV is 298,000
|
$65.74
-19.59%
|
3/11/2021
|
$59.70
|
PP = $60.87
|
|
MB = $63.91
|
Most Recent Note - 3/25/2021 5:35:43 PM
G - Today's gain with light volume helped it to rebound and close just above its 50 DMA line ($53.92) helping its outlook improve. Still, it faces resistance due to overhead supply up to the $65 level.
>>> FEATURED STOCK ARTICLE : Powerful Breakout Backed by Heavy Volume - 3/11/2021 |
View all notes |
Set NEW NOTE alert |
Company Profile |
SEC
News |
Chart |
Request a new note
C
A
S
I |
UI
-
NYSE
Ubiquiti Inc
Telecom-Infrastructure
|
$389.88
|
+48.32
14.15% |
$396.00
|
370,343
330.66% of 50 DAV
50 DAV is 112,000
|
$362.89
7.44%
|
3/26/2021
|
$383.00
|
PP = $362.99
|
|
MB = $381.14
|
Most Recent Note - 3/26/2021 5:30:25 PM
Y - Finished strong today after highlighted in yellow with pivot point cited based on its 2/10/21 high plus 10 cents in the earlier mid-day report. Gapped up and powered into new all-time high territory with a considerable gain backed by +231% above average volume triggering a technical buy signal. Found support above its 50 DMA line since noted in the 2/05/21 mid-day report. Earnings rose +81% on +56% sales revenues for the Dec '20 quarter versus the year ago period. Recent quarterly comparisons show accelerating sales revenues and strong earnings growth near or well above the +25% minimum guideline (C criteria). See the latest FSU analysis for more details and a new annotated graph.
>>> FEATURED STOCK ARTICLE : Volume +231% Above Average With Breakout Gain - 3/26/2021 |
View all notes |
Set NEW NOTE alert |
Company Profile |
SEC
News |
Chart |
Request a new note
C
A
S
I |
DT
-
NYSE
Dynatrace Inc
Computer Sftwr-Enterprse
|
$47.33
|
-0.65
-1.35% |
$48.42
|
1,649,331
61.89% of 50 DAV
50 DAV is 2,665,100
|
$56.94
-16.88%
|
2/4/2021
|
$51.39
|
PP = $48.95
|
|
MB = $51.40
|
Most Recent Note - 3/24/2021 6:07:05 PM
G - Color code is changed to green after today's big loss violated its 50 DMA line ($49.46) raising concerns. Prior highs in the $48 area help define import near-term support. More damaging losses would raise serious concerns. Its Relative Strength Rating has slumped to 54, well below the 80+ minimum guideline for buy candidates. Fundamentals remain strong after it reported Dec '20 earnings +70% on +28% sales revenues versus the year ago period.
>>> FEATURED STOCK ARTICLE : 50-Day Moving Average Line Tested Again - 3/19/2021 |
View all notes |
Set NEW NOTE alert |
Company Profile |
SEC
News |
Chart |
Request a new note
C
A
S
I |
MRBK
-
NASDAQ
Meridian Corp
Banks-Northeast
|
$26.08
|
+0.58
2.27% |
$26.19
|
15,847
45.28% of 50 DAV
50 DAV is 35,000
|
$27.96
-6.72%
|
2/22/2021
|
$25.58
|
PP = $26.10
|
|
MB = $27.41
|
Most Recent Note - 3/24/2021 6:02:32 PM
Y - Reversed an early gain and closed near the session low with today's 3rd consecutive loss. Prior high defines initial support to watch above its 50 DMA line ($23.57) on pullbacks.
>>> FEATURED STOCK ARTICLE : Prior High Defines Initial Support to Watch - 3/15/2021 |
View all notes |
Set NEW NOTE alert |
Company Profile |
SEC
News |
Chart |
Request a new note
C
A
S
I |
Symbol/Exchange
Company Name
Industry Group |
PRICE |
CHANGE
(%Change) |
Day High |
Volume
(% DAV)
(% 50 day avg vol) |
52 Wk Hi
% From Hi |
Featured
Date |
Price
Featured |
Pivot Featured |
|
Max Buy |
|
|
|
THESE ARE NOT BUY RECOMMENDATIONS!
Comments contained in the body of this report are technical
opinions only. The material herein has been obtained
from sources believed to be reliable and accurate, however,
its accuracy and completeness cannot be guaranteed.
This site is not an investment advisor, hence it does
not endorse or recommend any securities or other investments.
Any recommendation contained in this report may not
be suitable for all investors and it is not to be deemed
an offer or solicitation on our part with respect to
the purchase or sale of any securities. All trademarks,
service marks and trade names appearing in this report
are the property of their respective owners, and are
likewise used for identification purposes only.
This report is a service available
only to active Paid Premium Members.
You may opt-out of receiving report notifications
at any time. Questions or comments may be submitted
by writing to Premium Membership Services 665 S.E. 10 Street, Suite 201 Deerfield Beach, FL 33441-5634 or by calling 1-800-965-8307
or 954-785-1121.
|
|
|