You are not logged in.
This means you
CAN ONLY VIEW reports that were published prior to Tuesday, April 15, 2025.
You
MUST UPGRADE YOUR MEMBERSHIP if you want to see any current reports.
AFTER MARKET UPDATE - TUESDAY, MARCH 23RD, 2021
Previous After Market Report Next After Market Report >>>
|
|
|
|
DOW |
-308.05 |
32,423.15 |
-0.94% |
|
Volume |
1,064,945,680 |
+36% |
|
Volume |
5,556,140,800 |
+7% |
|
NASDAQ |
-149.41 |
13,228.14 |
-1.12% |
|
Advancers |
742 |
23% |
|
Advancers |
541 |
14% |
|
S&P 500 |
-30.07 |
3,910.52 |
-0.76% |
|
Decliners |
2,464 |
77% |
|
Decliners |
3,340 |
86% |
|
Russell 2000 |
-81.16 |
2,185.69 |
-3.58% |
|
52 Wk Highs |
60 |
|
|
52 Wk Highs |
66 |
|
|
S&P 600 |
-46.57 |
1,289.25 |
-3.49% |
|
52 Wk Lows |
106 |
|
|
52 Wk Lows |
229 |
|
|
 |
Leadership Wanes as Major Indices Fall With Greater Volume Totals
Kenneth J. Gruneisen - Passed the CAN SLIM® Master's Exam
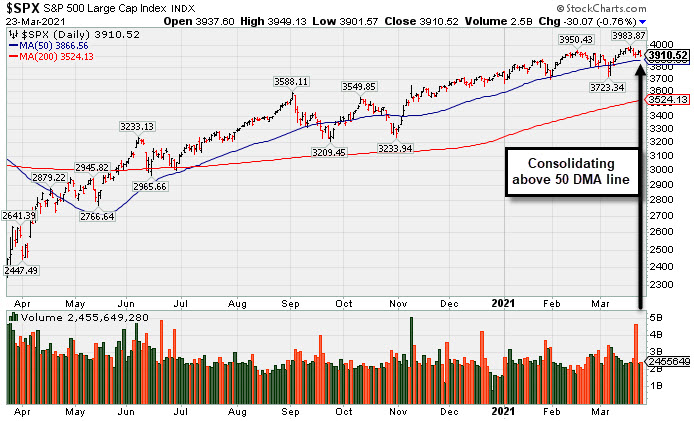
The S&P 500 dipped 0.8%, having surged nearly 75% since last year’s March 23 bottom. The Dow lost 308 points, while the Nasdaq Composite declined 1.1%. The small-cap Russell 2000 shed 3.8%. The volume totals were higher than the prior session totals on the NYSE and on the Nasdaq exchange. Breadth was negative as decliners led advancers by more than a 3-1 margin on the NYSE and by a 6-1 margin on the Nasdaq exchange. Leadership waned as there were only 5 high-ranked companies from the Leaders List that hit new 52-week highs and were listed on the BreakOuts Page, versus the total of 19 on the prior session. New 52-week lows totals swelled and outnumbered shrinking new 52-week highs totals on both the NYSE and the Nasdaq exchange. The major indices are in a confirmed uptrend (M criteria). Investors are reminded to always make buying and selling decisions on case-by-case basis under the strict criteria and rules of the fact-based investment system.
PICTURED: The S&P 500 Index is perched near its all-time high, consolidating above its 50-day moving average (DMA) line.
US Stocks finished lower on Tuesday as investors reassessed the pace of the global economic recovery on the one-year anniversary of U.S. bull market. Concerns about another wave of COVID-19 infections weighed on sentiment, with the number of U.S. cases rising for the first time in nine weeks, while parts of Europe renewed lockdown measures in an effort to curb the spread.
Wall Street also digested comments from Federal Reserve Chair Jerome Powell, who testified before the House Financial Services Committee with Treasury Secretary Janet Yellen. The Fed Chief reiterated the expectation that this year’s post-pandemic increase in inflation would be “neither particularly large nor persistent.” Powell stated that the central bank has “the tools to deal with that” if price pressures got out of control. Treasuries extended their rebound, with the yield on the 10-year note down six basis points to 1.62%. On the data front, new home sales slumped a greater-than-expected 18.2% in February to the lowest level in nine months. In commodities, WTI crude fell 6.5% to $57.56/barrel as the dollar strengthened.
Eight of 11 S&P 500 sectors closed in negative territory, with the more cyclical-oriented groups leading the decline. In corporate news, ViacomCBS (VIAC -9.06%) fell after revealing plans to raise roughly $3 billion in capital. AstraZeneca (AZN -3.52%) fell on reports that its COVID-19 vaccine results may have included outdated information. |
 Kenneth J. Gruneisen started out as a licensed stockbroker in August 1987, a couple of months prior to the historic stock market crash that took the Dow Jones Industrial Average down -22.6% in a single day. He has published daily fact-based fundamental and technical analysis on high-ranked stocks online for two decades. Through FACTBASEDINVESTING.COM, Kenneth provides educational articles, news, market commentary, and other information regarding proven investment systems that work in good times and bad.
Comments contained in the body of this report are technical opinions only and are not necessarily those of Gruneisen Growth Corp. The material herein has been obtained from sources believed to be reliable and accurate, however, its accuracy and completeness cannot be guaranteed. Our firm, employees, and customers may effect transactions, including transactions contrary to any recommendation herein, or have positions in the securities mentioned herein or options with respect thereto. Any recommendation contained in this report may not be suitable for all investors and it is not to be deemed an offer or solicitation on our part with respect to the purchase or sale of any securities. |
|
 |
Financial, Tech, and Commodity-Linked Groups Fell
Kenneth J. Gruneisen - Passed the CAN SLIM® Master's Exam
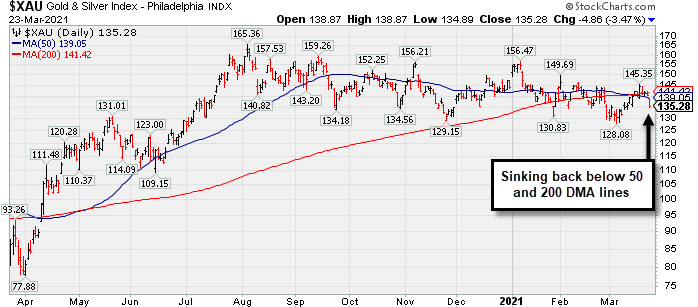
The Biotech Index ($BTK -3.65%) outpaced the Semiconductor Index ($SOX -2.66%) and Networking Index ($NWX -2.56%) as the tech sector also had a negative bias. The Broker/Dealer Index ($XBD -2.80%) and Bank Index ($BKX -2.07%) both lost ground. Commodity-linked groups also had a negative bias as the Gold & Silver Index ($XAU -3.46%), Oil Services Index ($OSX -6.21%), and Integrated Oil Index ($XOI -2.34%) suffered unanimous losses.
PICTURED: The Gold & Silver Index ($XAU -3.46%) is sinking back below its 50-day and 200-day moving average (DMA) lines.
| Oil Services |
$OSX |
52.13 |
-3.45 |
-6.21% |
+17.59% |
| Integrated Oil |
$XOI |
981.69 |
-23.56 |
-2.34% |
+23.88% |
| Semiconductor |
$SOX |
2,995.72 |
-81.83 |
-2.66% |
+7.16% |
| Networking |
$NWX |
788.89 |
-20.77 |
-2.56% |
+10.01% |
| Broker/Dealer |
$XBD |
438.31 |
-12.61 |
-2.80% |
+16.08% |
| Retail |
$RLX |
3,621.76 |
+7.93 |
+0.22% |
+1.64% |
| Gold & Silver |
$XAU |
135.30 |
-4.85 |
-3.46% |
-6.17% |
| Bank |
$BKX |
116.06 |
-2.45 |
-2.07% |
+18.54% |
| Biotech |
$BTK |
5,446.95 |
-206.37 |
-3.65% |
-5.09% |
|
|
|
 |
Featured Stocks
Kenneth J. Gruneisen - Passed the CAN SLIM® Master's Exam
|
|
|
Color Codes Explained :
Y - Better candidates highlighted by our
staff of experts.
G - Previously featured
in past reports as yellow but may no longer be buyable under the
guidelines.
***Last / Change / Volume data in this table is the closing quote data***
Symbol/Exchange
Company Name
Industry Group |
PRICE |
CHANGE
(%Change) |
Day High |
Volume
(% DAV)
(% 50 day avg vol) |
52 Wk Hi
% From Hi |
Featured
Date |
Price
Featured |
Pivot Featured |
|
Max Buy |
 FBC
-
NYSE
FBC
-
NYSE
Flagstar Bancorp Inc
BANKING - Savings and Loans
|
$44.99
|
-1.43
-3.08% |
$46.52
|
308,863
46.17% of 50 DAV
50 DAV is 669,000
|
$51.58
-12.78%
|
3/4/2021
|
$47.26
|
PP = $48.02
|
|
MB = $50.42
|
 Most Recent Note - 3/23/2021 4:21:06 PM
G - Suffered a 4th consecutive loss today with lighter volume and violated its 50 DMA line ($45.59) raising greater concerns. Color code is changed to green. Only a prompt rebound would help its outlook improve. Near-term support to watch is prior lows. See the latest FSU analysis for more details and an annotated graph.
>>> FEATURED STOCK ARTICLE : Slumping Into Prior Base Following Breakout - 3/22/2021 |
View all notes |
Set NEW NOTE alert |
Company Profile |
SEC
News |
Chart |
Request a new note
C
A
S
I |
CRL
-
NYSE
Charles River Labs Intl
DRUGS - Biotechnology
|
$280.31
|
-7.82
-2.71% |
$289.91
|
293,431
92.56% of 50 DAV
50 DAV is 317,000
|
$303.79
-7.73%
|
12/17/2020
|
$247.06
|
PP = $257.98
|
|
MB = $270.88
|
Most Recent Note - 3/23/2021 5:31:37 PM
G - Today's loss had lighter volume as it slumped near its 50 DMA line ($279) which acted as support throughout its ongoing ascent. Its Relative Strength Rating is 76, below the 80+ minimum guideline for buy candidates. Recently reported Dec '20 quarterly earnings +19% on +14% sales revenues versus the year ago period, below the +25% minimum earnings guideline (C criteria), raising fundamental concerns.
>>> FEATURED STOCK ARTICLE : Made Gradual Progress, Now Extended From Any Sound Base - 3/16/2021 |
View all notes |
Set NEW NOTE alert |
Company Profile |
SEC
News |
Chart |
Request a new note
C
A
S
I |
OPY
-
NYSE
Oppenheimer Holdings Inc
FINANCIAL SERVICES - Investment Brokerage - Regiona
|
$40.52
|
-0.56
-1.36% |
$41.76
|
154,495
117.04% of 50 DAV
50 DAV is 132,000
|
$44.38
-8.70%
|
2/25/2021
|
$38.95
|
PP = $38.11
|
|
MB = $40.02
|
Most Recent Note - 3/22/2021 5:36:52 PM
G - Traded below its "max buy" level as it pulled back from its all-time high with today's 2nd consecutive volume-driven loss.
>>> FEATURED STOCK ARTICLE : Perched at Record High After 6 Consecutive Gains - 3/12/2021 |
View all notes |
Set NEW NOTE alert |
Company Profile |
SEC
News |
Chart |
Request a new note
C
A
S
I |
CLFD
-
NASDAQ
Clearfield Inc
TELECOMMUNICATIONS - Cables / Satalite Equipment
|
$29.66
|
-2.00
-6.32% |
$31.66
|
147,168
84.58% of 50 DAV
50 DAV is 174,000
|
$38.75
-23.46%
|
1/20/2021
|
$31.38
|
PP = $28.42
|
|
MB = $29.84
|
Most Recent Note - 3/23/2021 4:12:07 PM
G - Sank further below its 50 DMA line ($32.62) with today's 4th consecutive damaging loss. Prior highs in the $28 area previously acted as support. Fundamentals remain strong.
>>> FEATURED STOCK ARTICLE : Quiet Gain Repaired 50-Day Moving Average Violation - 3/9/2021 |
View all notes |
Set NEW NOTE alert |
Company Profile |
SEC
News |
Chart |
Request a new note
C
A
S
I |
EDUC
-
NASDAQ
Educational Development
WHOLESALE - Basic Materials Wholesale
|
$17.34
|
-0.56
-3.13% |
$18.02
|
43,636
114.83% of 50 DAV
50 DAV is 38,000
|
$20.00
-13.30%
|
3/10/2021
|
$17.89
|
PP = $20.10
|
|
MB = $21.11
|
Most Recent Note - 3/23/2021 5:29:49 PM
Y - Retreating after challenging its 52-week high. Subsequent gains above the pivot point backed by at least +40% above average volume are needed to trigger a proper technical buy signal. This thinly traded Media - Books firm's annual earnings (A criteria) history has strong.
>>> FEATURED STOCK ARTICLE : Gain Leaves Media - Books Firm Perched Near Pivot Point - 3/10/2021 |
View all notes |
Set NEW NOTE alert |
Company Profile |
SEC
News |
Chart |
Request a new note
C
A
S
I |
Symbol/Exchange
Company Name
Industry Group |
PRICE |
CHANGE
(%Change) |
Day High |
Volume
(% DAV)
(% 50 day avg vol) |
52 Wk Hi
% From Hi |
Featured
Date |
Price
Featured |
Pivot Featured |
|
Max Buy |
SMPL
-
NASDAQ
Simply Good Foods Co
Food-Confectionery
|
$29.65
|
-2.12
-6.67% |
$31.93
|
1,407,743
205.54% of 50 DAV
50 DAV is 684,900
|
$35.25
-15.89%
|
12/28/2020
|
$30.40
|
PP = $31.44
|
|
MB = $33.01
|
Most Recent Note - 3/23/2021 4:15:29 PM
G - Today's big 4th consecutive loss on higher volume violated prior highs in the $32 area and its 50 DMA line ($29.76) triggering technical sell signals. Its color code is changed to green. Only a prompt rebound would help its outlook improve. Its Relative Strength Rating is 73, below the 80+ minimum guideline for buy candidates.
>>> FEATURED STOCK ARTICLE : Found Support at 50-Day Moving Average; Relative Strength Improved - 3/5/2021 |
View all notes |
Set NEW NOTE alert |
Company Profile |
SEC
News |
Chart |
Request a new note
C
A
S
I |
XPEL
-
NASDAQ
Xpel Inc
Auto/Truck-Tires andamp; Misc
|
$53.22
|
-2.04
-3.69% |
$54.59
|
188,967
61.75% of 50 DAV
50 DAV is 306,000
|
$65.74
-19.04%
|
3/11/2021
|
$59.70
|
PP = $60.87
|
|
MB = $63.91
|
Most Recent Note - 3/23/2021 4:17:36 PM
G - Today's loss violated its 50 DMA line ($54.16) triggering a technical sell signal. Color code is changed to green. Only a prompt rebound would help its outlook improve.
>>> FEATURED STOCK ARTICLE : Powerful Breakout Backed by Heavy Volume - 3/11/2021 |
View all notes |
Set NEW NOTE alert |
Company Profile |
SEC
News |
Chart |
Request a new note
C
A
S
I |
DT
-
NYSE
Dynatrace Inc
Computer Sftwr-Enterprse
|
$50.60
|
-1.16
-2.24% |
$52.22
|
1,852,132
69.78% of 50 DAV
50 DAV is 2,654,400
|
$56.94
-11.13%
|
2/4/2021
|
$51.39
|
PP = $48.95
|
|
MB = $51.40
|
Most Recent Note - 3/23/2021 5:33:40 PM
Y - Pulled back today on lighter volume. Tested support at its 50 DMA line ($49.34) recently and managed "positive reversals". Prior highs in the $48 area help define import near-term support. More damaging losses would raise serious concerns. Its Relative Strength Rating has slumped to 60, well below the 80+ minimum guideline for buy candidates. Fundamentals remain strong after it reported Dec '20 earnings +70% on +28% sales revenues versus the year ago period.
>>> FEATURED STOCK ARTICLE : 50-Day Moving Average Line Tested Again - 3/19/2021 |
View all notes |
Set NEW NOTE alert |
Company Profile |
SEC
News |
Chart |
Request a new note
C
A
S
I |
MRBK
-
NASDAQ
Meridian Corp
Banks-Northeast
|
$25.58
|
-0.30
-1.16% |
$26.13
|
68,944
20.16% of 50 DAV
50 DAV is 342,000
|
$27.96
-8.51%
|
2/22/2021
|
$25.58
|
PP = $26.10
|
|
MB = $27.41
|
Most Recent Note - 3/22/2021 5:34:49 PM
Y - Gapped down today, abruptly retreating after closing at the session high on the prior session while challenging its 52-week high. Prior high defines initial support to watch above its 50 DMA line ($23.41) on pullbacks.
>>> FEATURED STOCK ARTICLE : Prior High Defines Initial Support to Watch - 3/15/2021 |
View all notes |
Set NEW NOTE alert |
Company Profile |
SEC
News |
Chart |
Request a new note
C
A
S
I |
|
|
|
THESE ARE NOT BUY RECOMMENDATIONS!
Comments contained in the body of this report are technical
opinions only. The material herein has been obtained
from sources believed to be reliable and accurate, however,
its accuracy and completeness cannot be guaranteed.
This site is not an investment advisor, hence it does
not endorse or recommend any securities or other investments.
Any recommendation contained in this report may not
be suitable for all investors and it is not to be deemed
an offer or solicitation on our part with respect to
the purchase or sale of any securities. All trademarks,
service marks and trade names appearing in this report
are the property of their respective owners, and are
likewise used for identification purposes only.
This report is a service available
only to active Paid Premium Members.
You may opt-out of receiving report notifications
at any time. Questions or comments may be submitted
by writing to Premium Membership Services 665 S.E. 10 Street, Suite 201 Deerfield Beach, FL 33441-5634 or by calling 1-800-965-8307
or 954-785-1121.
|
|
|