You are not logged in.
This means you
CAN ONLY VIEW reports that were published prior to Thursday, April 10, 2025.
You
MUST UPGRADE YOUR MEMBERSHIP if you want to see any current reports.
AFTER MARKET UPDATE - WEDNESDAY, FEBRUARY 1ST, 2023
Previous After Market Report Next After Market Report >>>
|
|
|
|
DOW |
+6.92 |
34,092.96 |
+0.02% |
|
Volume |
1,037,449,413 |
-19% |
|
Volume |
6,336,042,685 |
+12% |
|
NASDAQ |
+231.77 |
11,816.32 |
+2.00% |
|
Advancers |
2,227 |
72% |
|
Advancers |
3,147 |
69% |
|
S&P 500 |
+42.61 |
4,119.21 |
+1.05% |
|
Decliners |
855 |
28% |
|
Decliners |
1,428 |
31% |
|
Russell 2000 |
+28.87 |
1,960.81 |
+1.49% |
|
52 Wk Highs |
177 |
|
|
52 Wk Highs |
186 |
|
|
S&P 600 |
+18.82 |
1,285.18 |
+1.49% |
|
52 Wk Lows |
8 |
|
|
52 Wk Lows |
34 |
|
|
 |
Leadership Expands as Nasdaq Composite Led Indices Higher
Kenneth J. Gruneisen - Passed the CAN SLIM® Master's Exam
The Dow added nearly 7 points and the Nasdaq Composite gained 2%. The S&P 500 increased 1.1% Volume totals were mixed, lighter than the prior session on the NYSE and higher on the Nasdaq exchange. Breadth was clearly posiiive as advancers led decliners by almost a 3-1 margin on the NYSE and by more than a 2-1 margin the Nasdaq exchange. Leadership improved as there were 101 high-ranked companies from the Leaders List that hit new 52-week highs and were listed on the BreakOuts Page versus the total of 48 on the prior session. New 52-week highs totals expanded and solidly outnumbered new 52-week lows on both the NYSE and the Nasdaq exchange. The major indices are in a confirmed uptrend (M criteria). Disciplined investors have a green light for making new buys only in stocks matching all key criteria of the fact-based investment system.
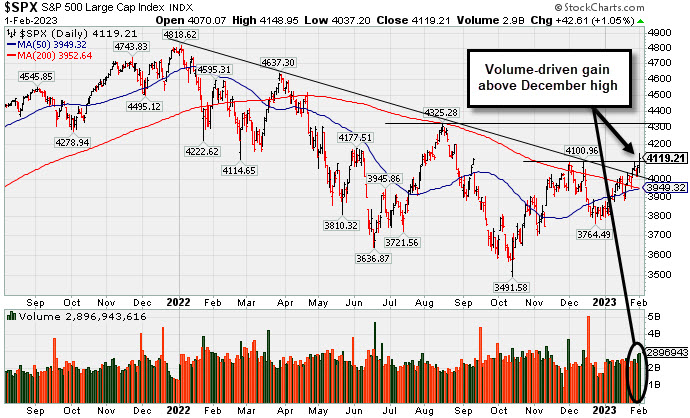
PICTURED: The S&P 500 Index rose above its December high with a big volume-driven gain. It recenty rose above a downward trendline connecting its January to December 2022 highs. Meanwhile, its 50-day moving average (DMA) line (blue line) is converging with its 200 DMA line (red line), a bullish technical signal termed a "golden cross".
U.S. equities finished higher Wednesday following the Federal Reserve’s (Fed) 25 basis point (0.25%) rate increase. Directly following the rate decision, Chairman Jerome Powell stated inflation has somewhat eased but continues to remain elevated above the 2% target. Powell announced the central bank anticipates another rate hike at their next meeting in March, bringing the fed-funds rate closer to a range between 5% and 5.25%. Ten of the eleven S&P sectors finished in positive territory, with Information Technology outperforming.
On the data front, January’s Automatic Data Processing (ADP) Employment Change showed the U.S. private sector gained 106,000 jobs, down from December’s revised 253,000 print. Elsewhere, the Job Openings and Labor Turnover Survey (JOLTS) reported a total of 11 million job openings in December as the demand for employees continues to remain high. January’s Institute of Supply Management’s manufacturing reading declined more than expected to 47.4, dropping deeper into contractionary territory, meanwhile prices paid increased 5.1 to 44.5 for the month.
Treasuries strengthened with the yield on the 10-year note decreasing ten basis points (0.10%) to 3.41%, while the 30-year bond yield lost seven basis points (0.07%) to 3.57%. The yield on the two-year note declined eleven basis points (0.11%) to 4.09%. In commodities, West Texas Intermediate (WTI) crude fell 2.7% to $76.78/barrel after the Organization of Petroleum Exporting Countries and its allies (OPEC+) announced they will be keeping their output policy unchanged.
|
 Kenneth J. Gruneisen started out as a licensed stockbroker in August 1987, a couple of months prior to the historic stock market crash that took the Dow Jones Industrial Average down -22.6% in a single day. He has published daily fact-based fundamental and technical analysis on high-ranked stocks online for two decades. Through FACTBASEDINVESTING.COM, Kenneth provides educational articles, news, market commentary, and other information regarding proven investment systems that work in good times and bad.
Comments contained in the body of this report are technical opinions only and are not necessarily those of Gruneisen Growth Corp. The material herein has been obtained from sources believed to be reliable and accurate, however, its accuracy and completeness cannot be guaranteed. Our firm, employees, and customers may effect transactions, including transactions contrary to any recommendation herein, or have positions in the securities mentioned herein or options with respect thereto. Any recommendation contained in this report may not be suitable for all investors and it is not to be deemed an offer or solicitation on our part with respect to the purchase or sale of any securities. |
|
 |
Semiconductor, Retail, and Gold & Silver Indexes Led Group Gainers
Kenneth J. Gruneisen - Passed the CAN SLIM® Master's Exam
The Retail Index ($RLX +1.78%) posted an influential gain while the Broker/Dealer Index ($XBD +0.94%) and Bank Index ($BKX +0.56%) also provided some lift for the major averages. The Semiconductor Index ($SOX +5.19%) led the tech sector higher while the Networking Index ($NWX +1.29%) also posted a solid gain and the Biotech Index ($BTK +0.28%) inched higher. Commodity-linked groups were mixed as the Gold & Silver Index ($XAU +1.94%) posted a solid gain while the Integrated Oil Index ($XOI -2.48%) slumped and the Oil Services Index ($OSX -0.81%) also edged lower.
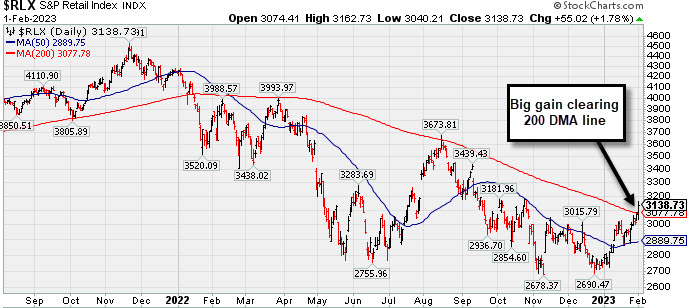
PICTURED: The Retail Index ($RLX +1.78%) posted a big gain rising well above its 200-day moving average (DMA) line. In March and August 2022 it met stiff resistance near that important long term average. Staying above the 200 DMA line is action indicative of a healthier market, meanwhile, any retreat back below the 200 DMA line would be a worrisome sign. The Retail index in a very important market indicator since about 2/3 of the US economy is driven by ordinarty consumer spending.
| Oil Services |
$OSX |
92.82 |
-0.76 |
-0.81% |
+10.69% |
| Integrated Oil |
$XOI |
1,814.92 |
-46.07 |
-2.48% |
+1.55% |
| Semiconductor |
$SOX |
3,073.47 |
+151.55 |
+5.19% |
+21.38% |
| Networking |
$NWX |
836.96 |
+10.67 |
+1.29% |
+6.85% |
| Broker/Dealer |
$XBD |
495.53 |
+4.61 |
+0.94% |
+10.33% |
| Retail |
$RLX |
3,138.73 |
+55.02 |
+1.78% |
+13.97% |
| Gold & Silver |
$XAU |
136.10 |
+2.59 |
+1.94% |
+12.61% |
| Bank |
$BKX |
113.56 |
+0.63 |
+0.56% |
+12.60% |
| Biotech |
$BTK |
5,611.36 |
+15.49 |
+0.28% |
+6.25% |
|
|
|
 |
Extended From Any Sound Base and Perched Near High
Kenneth J. Gruneisen - Passed the CAN SLIM® Master's Exam
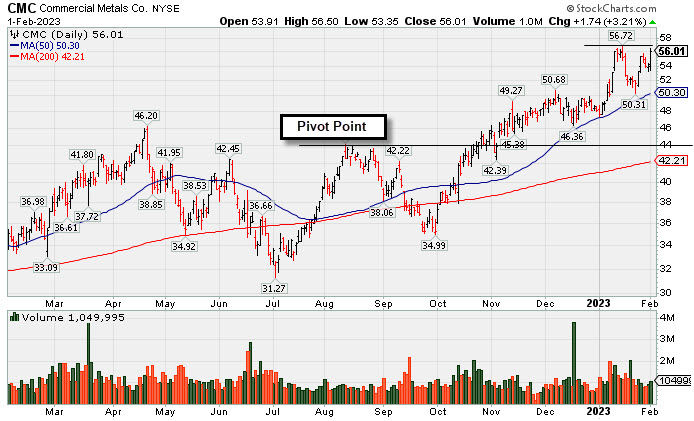
Commercial Metals Co (CMC +$1.74 or +3.21% to $56.01) posted a gain with average volume and closed 16 cents off its best ever close. It is extended from an sound base. It has been consolidating above its 50-day moving average (DMA) line ($50.41) which defines important near-term support to watch on pullbacks. Fundamentals remain strong.
CMC has a highest possible 99 Earnings Per Share Rating. It reported Nov '22 quarterly earnings +38% on +12% sales revenues versus the year ago period and prior quarterly comparisons were well above the +25% minimum earnings guideline (C criteria) of the fact-based investment system. Annual earnings growth has been strong. It hails from the Metal Proc & Fabrication group which is currently ranked 53rd on the 197 Industry Groups list (L criteria).
The company has 117.1 million shares outstanding (S criteria). The number of top-rated funds owning its shares rose from 586 in Dec '21 to 650 in Dec '22. Its current Up/Down Volume Ratio of 1.2 is an unbiased indication its shares have been under accumulation over the past 50 days. It has a Timeliness Rating of A and a Sponsorship Rating of B.
|
|
|
Color Codes Explained :
Y - Better candidates highlighted by our
staff of experts.
G - Previously featured
in past reports as yellow but may no longer be buyable under the
guidelines.
***Last / Change / Volume data in this table is the closing quote data***
Symbol/Exchange
Company Name
Industry Group |
PRICE |
CHANGE
(%Change) |
Day High |
Volume
(% DAV)
(% 50 day avg vol) |
52 Wk Hi
% From Hi |
Featured
Date |
Price
Featured |
Pivot Featured |
|
Max Buy |
 CMC
-
NYSE
CMC
-
NYSE
Commercial Metals Co
METALS and MINING - Steel and Iron
|
$56.01
|
+1.74
3.21% |
$56.50
|
1,049,995
102.54% of 50 DAV
50 DAV is 1,024,000
|
$56.88
-1.53%
|
10/14/2022
|
$41.61
|
PP = $44.45
|
|
MB = $46.67
|
 Most Recent Note - 2/1/2023 5:44:11 PM
G - Posted a gain today with average volume and finished 16 cents off its best-ever close. It is extended from any sound base. Its 50 DMA line ($50.41) defines important near-term support to watch on pullbacks. Fundamentals remain strong. See the latest FSU analysis for more details and a new annotated graph.
>>> FEATURED STOCK ARTICLE : Extended From Any Sound Base and Perched Near High - 2/1/2023 |
View all notes |
Set NEW NOTE alert |
Company Profile |
SEC
News |
Chart |
Request a new note
C
A
S
I |
GPK
-
NYSE
Graphic Packaging Hldg
CONSUMER NON-DURABLES - Packaging and Containers
|
$23.76
|
-0.33
-1.37% |
$23.76
|
4,510,009
154.24% of 50 DAV
50 DAV is 2,924,000
|
$24.20
-1.82%
|
10/25/2022
|
$22.75
|
PP = $24.17
|
|
MB = $25.38
|
Most Recent Note - 1/31/2023 6:09:36 PM
Y - Hit a new high challlenging its pivot point with +68% above average volume behind today's big gain. Disciplined investors know that gains above a stock's pivot point must be backed by at least +40% above average volume to trigger a proper technical buy signal.
>>> FEATURED STOCK ARTICLE : Graphic Packaging Perched Near Pivot Point - 1/27/2023 |
View all notes |
Set NEW NOTE alert |
Company Profile |
SEC
News |
Chart |
Request a new note
C
A
S
I |
GFF
-
NYSE
Griffon Corporation
MATERIALS and CONSTRUCTION - General Building Materials
|
$41.02
|
+0.14
0.34% |
$41.77
|
648,128
130.93% of 50 DAV
50 DAV is 495,000
|
$40.88
0.34%
|
11/10/2022
|
$34.13
|
PP = $35.02
|
|
MB = $36.77
|
Most Recent Note - 1/31/2023 6:08:24 PM
G - Hit a new 52-week high and finished at the session high today with a solid gain backed by +22% above average volume. Its 50 DMA line ($36.63) defines near-term support to watch on pullbacks. Reported Sep '22 quarterly earnings +230% on +24% sales revenues versus the year ago period.
>>> FEATURED STOCK ARTICLE : Showed Resilience Following Negative Reversal at 52-Week High - 1/19/2023 |
View all notes |
Set NEW NOTE alert |
Company Profile |
SEC
News |
Chart |
Request a new note
C
A
S
I |
TITN
-
NASDAQ
Titan Machinery Inc
SPECIALTY RETAIL
|
$44.09
|
+0.15
0.34% |
$44.66
|
140,591
55.57% of 50 DAV
50 DAV is 253,000
|
$44.85
-1.69%
|
1/13/2023
|
$40.10
|
PP = $44.45
|
|
MB = $46.67
|
Most Recent Note - 1/30/2023 6:04:29 PM
Y - Ended near the middle of iits intra-day range today after hitting a new all-time high with its 7th consecutive gain. The prior high in the $38 area defines important support to watch along with its 50 DMA line ($39.60). A new pivot point was recently cited based on its 12/01/22 high plus 10 cents. See the latest FSU analysis for more details and a new annotated graph.
>>> FEATURED STOCK ARTICLE : 7th Consecutive Gain for Titan - 1/30/2023 |
View all notes |
Set NEW NOTE alert |
Company Profile |
SEC
News |
Chart |
Request a new note
C
A
S
I |
MYE
-
NYSE
Myers Industries Inc
Containers/Packaging
|
$24.05
|
-0.03
-0.12% |
$24.41
|
199,676
121.02% of 50 DAV
50 DAV is 165,000
|
$25.55
-5.87%
|
12/8/2022
|
$23.94
|
PP = $25.65
|
|
MB = $26.93
|
Most Recent Note - 1/31/2023 6:11:00 PM
Y - Posted a solid gain today with average volume. Found support while testing support at its 50 DMA line ($23.14) in recent weeks. Faces little resistance due to overhead supply up to the $25.50 level.
>>> FEATURED STOCK ARTICLE : Myers Quietly Consolidating Within Striking Distance of Prior High - 1/20/2023 |
View all notes |
Set NEW NOTE alert |
Company Profile |
SEC
News |
Chart |
Request a new note
C
A
S
I |
Symbol/Exchange
Company Name
Industry Group |
PRICE |
CHANGE
(%Change) |
Day High |
Volume
(% DAV)
(% 50 day avg vol) |
52 Wk Hi
% From Hi |
Featured
Date |
Price
Featured |
Pivot Featured |
|
Max Buy |
BOX
-
NYSE
Box Inc Cl A
Computer Sftwr-Database
|
$33.00
|
+1.01
3.16% |
$33.09
|
1,593,957
118.95% of 50 DAV
50 DAV is 1,340,000
|
$33.04
-0.12%
|
12/12/2022
|
$29.83
|
PP = $29.57
|
|
MB = $31.05
|
Most Recent Note - 2/1/2023 5:47:03 PM
G - Posted a big gain today with +19% above average volume hitting a new high above its "max buy" level and its color code is changed to green. Prior highs in the $31 area define initial support to watch on pulllbacks.
>>> FEATURED STOCK ARTICLE : Perched Above "Max Buy" Level Near Recent Highs - 1/24/2023 |
View all notes |
Set NEW NOTE alert |
Company Profile |
SEC
News |
Chart |
Request a new note
C
A
S
I |
STRL
-
NASDAQ
Sterling Infrastructure
MATERIALS and; CONSTRUCTION - Heavy Construction
|
$36.64
|
+0.25
0.69% |
$36.98
|
367,407
162.57% of 50 DAV
50 DAV is 226,000
|
$36.42
0.60%
|
12/14/2022
|
$32.41
|
PP = $33.72
|
|
MB = $35.41
|
Most Recent Note - 1/31/2023 1:33:50 PM
Y - Hitting a new high with today's big gain backed by light volume. Gain on 1/27/23 with +64% above average volume cleared the previously cited pivot point. The 50 DMA line ($32.43) and recent low ($30.60 on 1/19/23) define near-term support levels to watch on pullbacks.
>>> FEATURED STOCK ARTICLE : Gain With Average Volume While Perched Near Recent Highs - 1/26/2023 |
View all notes |
Set NEW NOTE alert |
Company Profile |
SEC
News |
Chart |
Request a new note
C
A
S
I |
PERI
-
NASDAQ
Perion Networks Ltd
Comml Svcs-Advertising
|
$33.47
|
-0.03
-0.09% |
$33.86
|
816,512
177.50% of 50 DAV
50 DAV is 460,000
|
$33.97
-1.47%
|
1/25/2023
|
$31.79
|
PP = $33.19
|
|
MB = $34.85
|
Most Recent Note - 1/30/2023 12:43:58 PM
Y - Gain today marked by above average volume is adding to a recent spurt, hitting new multi-year highs and rising above its pivot point based upon its 11/15/21 high plus 10 cents. Triggered a technical buy signal on the prior session. See the latest FSU analysis for more details and an annotated graph.
>>> FEATURED STOCK ARTICLE : Spurt of Volume-Driven Gains Challenging Prior High - 1/25/2023 |
View all notes |
Set NEW NOTE alert |
Company Profile |
SEC
News |
Chart |
Request a new note
C
A
S
I |
ALGM
-
NASDAQ
Allegro Microsystems Inc
Elec-Semiconductor Mfg
|
$39.68
|
+1.51
3.96% |
$39.97
|
3,373,682
236.25% of 50 DAV
50 DAV is 1,428,000
|
$38.56
2.90%
|
1/31/2023
|
$37.80
|
PP = $38.38
|
|
MB = $40.30
|
Most Recent Note - 2/1/2023 12:22:03 PM
Y - Hitting another new high today. Posted a big gain with +378% above average volume for a best-ever close on the prior session after highlighted in yellow with pivot point cited based on its 12/28/21 high plus 10 cents. After a deep 12-month consolidation, subsequent gains and a strong close above the pivot point may clinch a technical buy signal. New CEO in Jun '22. Quarterly comparisons through Dec '22 have been above the +25% minimum earnings guideline (C criteria). Annual earnings history has been strong since its $14 IPO in Oct '20.
>>> FEATURED STOCK ARTICLE : Big Volume-Driven Gain for Best-Ever Close - 1/31/2023 |
View all notes |
Set NEW NOTE alert |
Company Profile |
SEC
News |
Chart |
Request a new note
C
A
S
I |
|
|
|
THESE ARE NOT BUY RECOMMENDATIONS!
Comments contained in the body of this report are technical
opinions only. The material herein has been obtained
from sources believed to be reliable and accurate, however,
its accuracy and completeness cannot be guaranteed.
This site is not an investment advisor, hence it does
not endorse or recommend any securities or other investments.
Any recommendation contained in this report may not
be suitable for all investors and it is not to be deemed
an offer or solicitation on our part with respect to
the purchase or sale of any securities. All trademarks,
service marks and trade names appearing in this report
are the property of their respective owners, and are
likewise used for identification purposes only.
This report is a service available
only to active Paid Premium Members.
You may opt-out of receiving report notifications
at any time. Questions or comments may be submitted
by writing to Premium Membership Services 665 S.E. 10 Street, Suite 201 Deerfield Beach, FL 33441-5634 or by calling 1-800-965-8307
or 954-785-1121.
|
|
|