You are not logged in.
This means you
CAN ONLY VIEW reports that were published prior to Wednesday, April 2, 2025.
You
MUST UPGRADE YOUR MEMBERSHIP if you want to see any current reports.
AFTER MARKET UPDATE - TUESDAY, OCTOBER 13TH, 2015
Previous After Market Report Next After Market Report >>>
|
|
|
|
DOW |
-49.97 |
17,081.89 |
-0.29% |
|
Volume |
837,557,270 |
+20% |
|
Volume |
1,412,561,460 |
+14% |
|
NASDAQ |
-42.03 |
4,796.61 |
-0.87% |
|
Advancers |
848 |
28% |
|
Advancers |
780 |
27% |
|
S&P 500 |
-13.77 |
2,003.69 |
-0.68% |
|
Decliners |
2,231 |
72% |
|
Decliners |
2,070 |
73% |
|
Russell 2000 |
-16.56 |
1,147.84 |
-1.42% |
|
52 Wk Highs |
47 |
|
|
52 Wk Highs |
63 |
|
|
S&P 600 |
-8.72 |
680.32 |
-1.27% |
|
52 Wk Lows |
15 |
|
|
52 Wk Lows |
41 |
|
|
 |
Breadth Negative and Volume Rose as Major Indices Lost Ground
Kenneth J. Gruneisen - Passed the CAN SLIM® Master's Exam
Stocks finished lower on Tuesday. The Dow fell 49 points to 17082. The S&P 500 lost 13 points to 2003. The NASDAQ declined 42 points to 4796. The volume totals were reported higher than the prior session totals on the NYSE and on the Nasdaq exchange, a clear sign of more selling pressure from the institutional crowd. Breadth was negative as decliners led advancers by 11-4 on the NYSE and 5-2 on the Nasdaq exchange. Leadership contracted as there were 37 stocks that made it onto the BreakOuts Page, down from the prior session total of 49 high-ranked companies from the Leaders List that made a new 52-week high. New 52-week highs still outnumbered new 52-week lows on the NYSE and on the Nasdaq exchange. There were losses for all 6 high-ranked companies currently on the Featured Stocks Page. , a disproportionately negative bias versus that of the broader market.
PICTURED: The Dow Jones Industrial has recently rebounded above its 50-day moving average (DMA) line and also rallied above its prior highs. Near-term resistance to watch is at its July lows and its 200 DMA line.
The S&P 500 Index, Dow Jones Industrial Average, and Nasdaq Composite Index have rebounded above their respective 50 DMA lines. Solid follow-through gains for the major indices established a new confirmed uptrend (M criteria). However, all 3 major averages remain well below their 200-day moving average lines. Members have been repeatedly reminded in recent weeks that at least 2 of the 3 major indices should be trading above their respective 200-day moving average (DMA) lines in order for a market environment to be considered technically "healthy". Additional recovery work must be done to get the indices back into healthy shape, and that improvement could require some considerable time and patience.
The major averages retreated as soft import data out of China rekindled global uncertainty. The report sent the MSCI All-Country World Index to a lower finish for the first time in 10 days. M&A news dominated the headlines on our shores, while the lone domestic data release showed that small business optimism unexpectedly grew in September.
In corporate news, Anheuser-Busch Inbev (BUD +2.10%) after reports that SABMiller (SBMRF +4.91%) agreed in principle to a $104 billion takeover offer. Molson Coors (TAP +9.94%) surged in sympathy with the news. In earnings, Johnson and Johnson (JNJ -0.56%) fell after beating earnings forecasts but missing on revenue.
All ten sectors in the S&P 500 moved lower on the session. Healthcare and industrial stocks declined more than 1% each to lead the losses while the telecom sector was the most resilient on the day.
Treasuries gained strength after the news out of China. The benchmark U.S. 10-year Treasury note advanced 12/32 higher to yield 2.04%.
Commodities were mostly lower. WTI crude lost 1.2% to $46.52/barrel while COMEX gold added 0.1% to $1164.50/ounce. In FOREX, the dollar index ebbed 0.1% as the greenback gave ground against the yen and euro.
The number of stocks listed to the Featured Stocks Page waned during deteriorating market conditions. The most current notes with headline links help members have access to more detailed letter-by-letter analysis including price/volume graphs annotated by our experts. See the Premium Member Homepage for archives to all prior pay reports.
|
 Kenneth J. Gruneisen started out as a licensed stockbroker in August 1987, a couple of months prior to the historic stock market crash that took the Dow Jones Industrial Average down -22.6% in a single day. He has published daily fact-based fundamental and technical analysis on high-ranked stocks online for two decades. Through FACTBASEDINVESTING.COM, Kenneth provides educational articles, news, market commentary, and other information regarding proven investment systems that work in good times and bad.
Comments contained in the body of this report are technical opinions only and are not necessarily those of Gruneisen Growth Corp. The material herein has been obtained from sources believed to be reliable and accurate, however, its accuracy and completeness cannot be guaranteed. Our firm, employees, and customers may effect transactions, including transactions contrary to any recommendation herein, or have positions in the securities mentioned herein or options with respect thereto. Any recommendation contained in this report may not be suitable for all investors and it is not to be deemed an offer or solicitation on our part with respect to the purchase or sale of any securities. |
|
 |
Weak Energy and Tech Indices Led Retail and Financial Groups Lower
Kenneth J. Gruneisen - Passed the CAN SLIM® Master's Exam
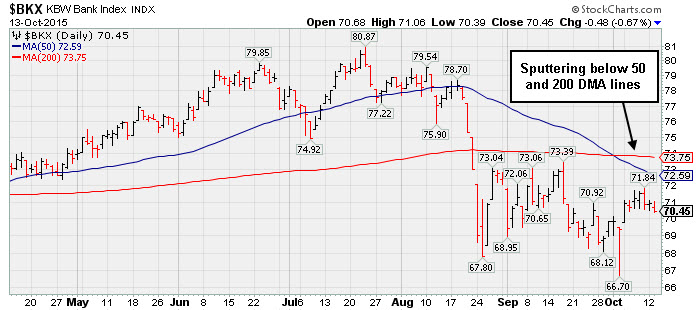
The Gold & Silver Index ($XAU +0.21%) edged higher but the Oil Services Index ($OSX -0.88%) and the Integrated Oil Index ($XOI -1.25%) both ended lower. The Retail Index ($RLX -0.71%) and financials had a negative influence on the major averages as the Bank Index ($BKX -0.67%) and Broker/Dealer Index ($XBD -0.69%) each ended lower. The tech sector retreat was led by the Biotechnology Index ($BTK -3.10%), and the Networking Index ($NWX -1.35%) and the Semiconductor Index ($SOX -1.31%) both fell.
PICTURED: The Bank Index ($BKX -0.67%) is sputtering below its 50-day and 200-day moving average (DMA) lines and prior highs.
| Oil Services |
$OSX |
178.57 |
-1.59 |
-0.88% |
-15.32% |
| Integrated Oil |
$XOI |
1,184.96 |
-15.05 |
-1.25% |
-12.10% |
| Semiconductor |
$SOX |
622.28 |
-8.26 |
-1.31% |
-9.40% |
| Networking |
$NWX |
374.77 |
-5.13 |
-1.35% |
+4.70% |
| Broker/Dealer |
$XBD |
166.97 |
-1.16 |
-0.69% |
-9.57% |
| Retail |
$RLX |
1,224.34 |
-8.79 |
-0.71% |
+18.55% |
| Gold & Silver |
$XAU |
54.06 |
+0.11 |
+0.20% |
-21.40% |
| Bank |
$BKX |
70.45 |
-0.48 |
-0.68% |
-5.13% |
| Biotech |
$BTK |
3,337.61 |
-106.95 |
-3.10% |
-2.95% |
|
|
|
 |
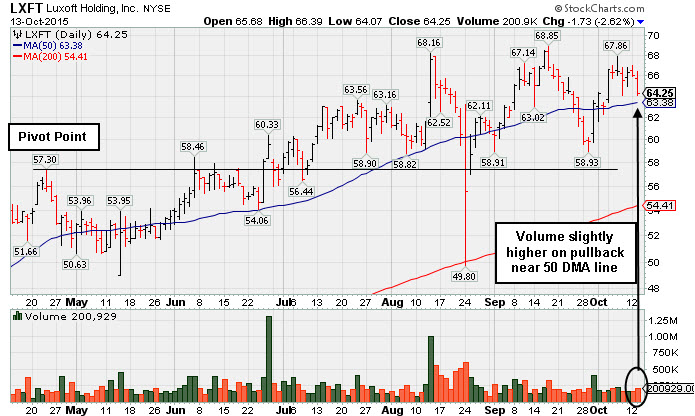
Consolidating After Rebound Above 50-Day Moving Average
Kenneth J. Gruneisen - Passed the CAN SLIM® Master's Exam
Luxoft Holding Inc Cl A (LXFT -$1.73 or -2.62% to $64.25) pulled back on slightly higher volume today, slumping near its 50-day moving average (DMA) line ($63.38). It remains perched within close striking distance of prior highs. Little resistance remains due to overhead supply however it has not formed a sound base. It was last shown in this FSU section on 9/30/15 with an annotated graph under the headline, " Volume-Driven Gain and Rebound Above 50-Day Moving Average Line ". Prior reports cautioned members - "Faces little resistances due to overhead supply, however, its deep "V" shaped consolidation is not recognized as a sound base. It found prompt support at its 200-day moving average (DMA) line on 8/24/15 after violating its 50 DMA line."
LXFT was first highlighted in yellow with a pivot point cited based on its 4/23/15 high plus 10 cents in the 5/26/15 mid-day report (read here). The high-ranked Computer Software firm reported earnings +36% on +32% sales revenues for the Jun '15 quarter, continuing its strong quarterly and annual earnings history (C and A criteria) matching the guidelines of the fact-based investment system. Sales revenues growth has been strong while it reported earnings +32%, +23%, +50%, and +28% in the Jun, Sep, Dec '14 and Mar '15 quarters versus the year ago periods.
The number of top-rated funds owning its shares rose from 185 in Jun '14 to 276 in Jun '15, a reassuring sign concerning the I criteria. However, its current Up/Down Volume Ratio of 0.7 is an unbiased indication its shares have been under distributional pressure over the past 50 days. It has earned a Timeliness Rating of A and a Sponsorship Rating of B. Its small supply of only 30.3 million shares (S criteria) in the public float can contribute to greater price volatility in the event of institutional buying or selling.
|
|
|
Color Codes Explained :
Y - Better candidates highlighted by our
staff of experts.
G - Previously featured
in past reports as yellow but may no longer be buyable under the
guidelines.
***Last / Change / Volume data in this table is the closing quote data***
Symbol/Exchange
Company Name
Industry Group |
PRICE |
CHANGE
(%Change) |
Day High |
Volume
(% DAV)
(% 50 day avg vol) |
52 Wk Hi
% From Hi |
Featured
Date |
Price
Featured |
Pivot Featured |
|
Max Buy |
BOFI
-
NASDAQ
B O F I Holding Inc
BANKING - Savings andamp; Loans
|
$142.00
|
-0.54
-0.38% |
$143.18
|
161,830
50.57% of 50 DAV
50 DAV is 320,000
|
$143.92
-1.33%
|
6/10/2015
|
$101.47
|
PP = $97.78
|
|
MB = $102.67
|
 Most Recent Note - 10/13/2015 3:41:18 PM
G - Volume totals have been cooling while stubbornly holding its ground following a streak of 8 gains for new highs. No resistance remains due to overhead supply. The recent "V" shaped consolidation over 10 weeks was not recognized as a sound base.
>>> FEATURED STOCK ARTICLE : Rebounding Near Prior High After "V" Shaped Consolidation - 10/5/2015 |
View all notes |
Set NEW NOTE alert |
Company Profile |
SEC
News |
Chart |
Request a new note
C
A
S
I |
HAWK
-
NASDAQ
Blackhawk Network Inc
DIVERSIFIED SERVICES - Business/Management Services
|
$45.78
|
-0.27
-0.59% |
$46.81
|
745,678
154.70% of 50 DAV
50 DAV is 482,000
|
$46.97
-2.53%
|
10/9/2015
|
$45.82
|
PP = $46.23
|
|
MB = $48.54
|
Most Recent Note - 10/13/2015 3:35:50 PM
Y - Pausing today while perched near its 52-week high following 3 consecutive gains with above average volume. Did not produce a volume driven gain and strong close above the pivot to trigger a technical buy signal. Highlighted in yellow in the 10/09/15 mid-day report with pivot point cited based on the 8/03/15 high plus 10 cents. See the latest FSU analysis for more details and an annotated graph.
>>> FEATURED STOCK ARTICLE : Met Some Resistance After Touching a New 52-Week High - 10/9/2015 |
View all notes |
Set NEW NOTE alert |
Company Profile |
SEC
News |
Chart |
Request a new note
C
A
S
I |
ULTA
-
NASDAQ
Ulta Salon Cosm & Frag
SPECIALTY RETAIL - Specialty Retail, Other
|
$163.85
|
-2.22
-1.34% |
$167.33
|
447,647
46.34% of 50 DAV
50 DAV is 966,000
|
$176.77
-7.31%
|
5/29/2015
|
$155.03
|
PP = $159.95
|
|
MB = $167.95
|
Most Recent Note - 10/12/2015 5:55:18 PM
G - Still quietly consolidating just above its 50 DMA line. It has not formed a sound base following the deep shakeout on 8/24/15. See the latest FSU analysis for more details and a new annotated graph.
>>> FEATURED STOCK ARTICLE : Consolidating Above 50-Day Moving Average Line - 10/12/2015 |
View all notes |
Set NEW NOTE alert |
Company Profile |
SEC
News |
Chart |
Request a new note
C
A
S
I |
FLTX
-
NYSE
Fleetmatics Group Plc
Computer Sftwr-Enterprse
|
$54.64
|
-1.58
-2.81% |
$56.60
|
530,399
142.96% of 50 DAV
50 DAV is 371,000
|
$56.39
-3.09%
|
9/23/2015
|
$51.26
|
PP = $52.55
|
|
MB = $55.18
|
Most Recent Note - 10/13/2015 3:37:32 PM
Y - Color code is changed to yellow after pulling back below its "max buy" level. Prior highs in the $52 area define initial support to watch on pullbacks.
>>> FEATURED STOCK ARTICLE : Holding Ground Following Volume-Driven Breakout - 10/8/2015 |
View all notes |
Set NEW NOTE alert |
Company Profile |
SEC
News |
Chart |
Request a new note
C
A
S
I |
LXFT
-
NYSE
Luxoft Holding Inc Cl A
Comp Sftwr-Spec Enterprs
|
$64.19
|
-1.79
-2.71% |
$66.40
|
219,362
88.10% of 50 DAV
50 DAV is 249,000
|
$68.85
-6.77%
|
5/26/2015
|
$51.90
|
PP = $57.40
|
|
MB = $60.27
|
Most Recent Note - 10/13/2015 3:38:59 PM
G - Still consolidating above its 50 DMA line, perched within close striking distance of prior highs. Little resistance remains due to overhead supply however it has not formed a sound base.
>>> FEATURED STOCK ARTICLE : Consolidating After Rebound Above 50-Day Moving Average - 10/13/2015 |
View all notes |
Set NEW NOTE alert |
Company Profile |
SEC
News |
Chart |
Request a new note
C
A
S
I |
Symbol/Exchange
Company Name
Industry Group |
PRICE |
CHANGE
(%Change) |
Day High |
Volume
(% DAV)
(% 50 day avg vol) |
52 Wk Hi
% From Hi |
Featured
Date |
Price
Featured |
Pivot Featured |
|
Max Buy |
INGN
-
NASDAQ
Inogen Inc
HEALTH SERVICES - Medical Instruments and Supplies
|
$44.00
|
-0.47
-1.06% |
$45.05
|
188,709
54.70% of 50 DAV
50 DAV is 345,000
|
$55.98
-21.40%
|
8/12/2015
|
$49.01
|
PP = $45.85
|
|
MB = $48.14
|
Most Recent Note - 10/13/2015 3:43:15 PM
G - Still struggling below its 50 DMA line after damaging losses. A rebound above the 50 DMA line is needed for its outlook to improve. The 200 DMA line ($39.66) defines important near-term support.
>>> FEATURED STOCK ARTICLE : Met Resistance at 50-Day Moving Average Following Violation - 10/1/2015 |
View all notes |
Set NEW NOTE alert |
Company Profile |
SEC
News |
Chart |
Request a new note
C
A
S
I |
|
|
|
THESE ARE NOT BUY RECOMMENDATIONS!
Comments contained in the body of this report are technical
opinions only. The material herein has been obtained
from sources believed to be reliable and accurate, however,
its accuracy and completeness cannot be guaranteed.
This site is not an investment advisor, hence it does
not endorse or recommend any securities or other investments.
Any recommendation contained in this report may not
be suitable for all investors and it is not to be deemed
an offer or solicitation on our part with respect to
the purchase or sale of any securities. All trademarks,
service marks and trade names appearing in this report
are the property of their respective owners, and are
likewise used for identification purposes only.
This report is a service available
only to active Paid Premium Members.
You may opt-out of receiving report notifications
at any time. Questions or comments may be submitted
by writing to Premium Membership Services 665 S.E. 10 Street, Suite 201 Deerfield Beach, FL 33441-5634 or by calling 1-800-965-8307
or 954-785-1121.
|
|
|