You are not logged in.
This means you
CAN ONLY VIEW reports that were published prior to Monday, March 24, 2025.
You
MUST UPGRADE YOUR MEMBERSHIP if you want to see any current reports.
AFTER MARKET UPDATE - WEDNESDAY, AUGUST 3RD, 2022
Previous After Market Report Next After Market Report >>>
|
|
|
|
DOW |
+416.33 |
32,812.50 |
+1.29% |
|
Volume |
865,618,650 |
-3% |
|
Volume |
5,635,788,700 |
+20% |
|
NASDAQ |
+319.40 |
12,668.16 |
+2.59% |
|
Advancers |
2,179 |
70% |
|
Advancers |
3,052 |
69% |
|
S&P 500 |
+63.98 |
4,155.17 |
+1.56% |
|
Decliners |
950 |
30% |
|
Decliners |
1,345 |
31% |
|
Russell 2000 |
+26.48 |
1,908.93 |
+1.41% |
|
52 Wk Highs |
25 |
|
|
52 Wk Highs |
55 |
|
|
S&P 600 |
+11.20 |
1,243.37 |
+0.91% |
|
52 Wk Lows |
36 |
|
|
52 Wk Lows |
57 |
|
|
 |
Breadth Positive as Major Indices Rose Again
Kenneth J. Gruneisen - Passed the CAN SLIM® Master's Exam
The S&P 500 rose 1.6%, while Nasdaq Composite jumped 2.6% amid strength in growth-related shares. The Dow added 416 points. The volume totals reported were mixed, lighter than the prior session on the NYSE and higher on the Nasdaq exchange. Breadth was positive as advancers led decliners by more than a 2-1 margin on the Nasdaq exchange and on the NYSE. There were 11 high-ranked companies from the Leaders List that hit new 52-week highs and were listed on the BreakOuts Page, down from the total of 20 on the prior session. New 52-week highs were outnumbered by new 52-week lows on the NYSE and on the Nasdaq exchange. The market is in a confirmed uptrend (M criteria). Any sustainable rally requires a healthy crop of leading stocks hitting new highs, so the recent improvement in leadership was a reassuring sign.
Chart courtesy of www.stockcharts.com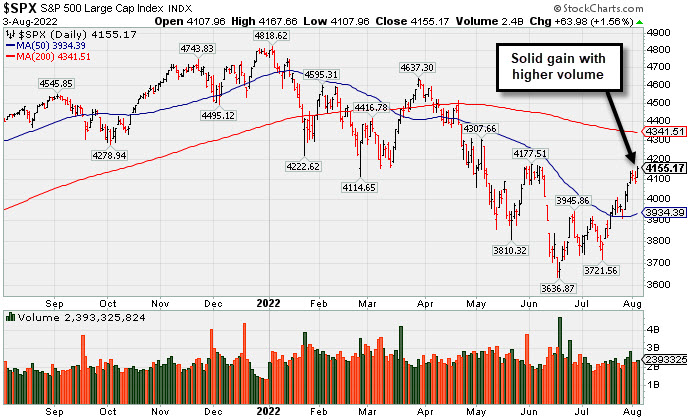 PICTURED: The S&P 500 Index posted a gain with slightly higher volume. It has recently been approaching its June high and still remains well below its 200 DMA line.
U.S. stocks finished at a two-month high Wednesday as better-than-expected economic data and corporate earnings reports supported sentiment. Meanwhile, geopolitical tensions seemed to abate after U.S. House Speaker Nancy Pelosi wrapped up her landmark visit to Taiwan.
On the data front, an update from the Institute for Supply Management (ISM) showed U.S. services sector activity unexpectedly accelerated July, with the purchasing managers’ index (PMI) hitting a three-month high. Furthermore, the price index--a measure of inflation--fell to the lowest level since February 2021. Rounding out the docket, mortgage applications advanced for the first time in five weeks.
Treasuries were whipsawed during the session as market participants weighed the likelihood of more sizeable Federal Reserve (Fed) rate hikes. St Louis Fed President James Bullard said there would need to be “convincing evidence” of inflation easing before officials would consider shifting away from their aggressive stance. The yield on the 10-year note declined six basis points (0.06%) to 2.70%, while the yield on the two-year note ended unchanged at 3.07% after briefly spiking to 3.20% during intraday trading. In commodities, West Texas Intermediate crude fell 3.9% to $90.71/barrel on demand concerns and following a decision by OPEC+ (the Organization of Petroleum Exporting Countries and its allies) to modestly increase monthly production.
In earnings, PayPal Holdings Inc. (PYPL +9.25%) on upbeat guidance. Moderna Inc. (MRNA +15.97%) surged after delivering a top and bottom line beat. Also in Health Care, CVS Health Corp. (CVS +6.30%) rose following a boost to its full-year profit forecast.
|
 Kenneth J. Gruneisen started out as a licensed stockbroker in August 1987, a couple of months prior to the historic stock market crash that took the Dow Jones Industrial Average down -22.6% in a single day. He has published daily fact-based fundamental and technical analysis on high-ranked stocks online for two decades. Through FACTBASEDINVESTING.COM, Kenneth provides educational articles, news, market commentary, and other information regarding proven investment systems that work in good times and bad.
Comments contained in the body of this report are technical opinions only and are not necessarily those of Gruneisen Growth Corp. The material herein has been obtained from sources believed to be reliable and accurate, however, its accuracy and completeness cannot be guaranteed. Our firm, employees, and customers may effect transactions, including transactions contrary to any recommendation herein, or have positions in the securities mentioned herein or options with respect thereto. Any recommendation contained in this report may not be suitable for all investors and it is not to be deemed an offer or solicitation on our part with respect to the purchase or sale of any securities. |
|
 |
Retail, Financial, and Tech Groups Rose While Commodity-Linked Groups Fell
Kenneth J. Gruneisen - Passed the CAN SLIM® Master's Exam
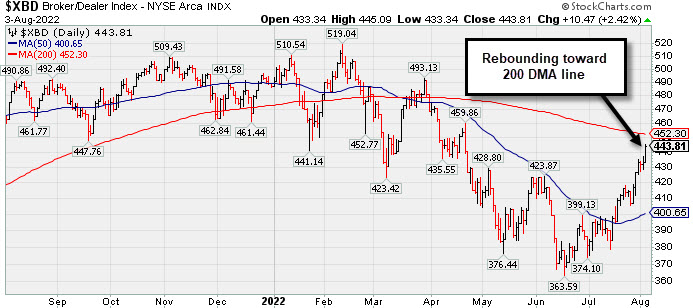
The Retail Index ($RLX +3.03%) and financials posted influential gains as the Broker/Dealer Index ($XBD +2.42%) outpaced the Bank Index ($BKX +1.72%). The Biotech Index ($BTK +3.84%) led the tech sector while the Semiconductor Index ($SOX +2.65%) followed and the Networking Index ($NWX +1.24%) also notched a solid gain. Commodity-linked groups had a negative bias as the Oil Services Index ($OSX -2.32%), Integrated Oil Index ($XOI -2.93%), and Gold & Silver Index ($XAU -1.80%) each lost ground.
PICTURED: The Broker/Dealer Index ($XBD +2.42%) has been rebounding toward its 200-day moving average (DMA) line.
| Oil Services |
$OSX |
65.83 |
-1.57 |
-2.32% |
+24.86% |
| Integrated Oil |
$XOI |
1,520.40 |
-45.84 |
-2.93% |
+29.04% |
| Semiconductor |
$SOX |
3,053.46 |
+78.72 |
+2.65% |
-22.62% |
| Networking |
$NWX |
809.08 |
+9.93 |
+1.24% |
-16.68% |
| Broker/Dealer |
$XBD |
443.81 |
+10.47 |
+2.42% |
-8.84% |
| Retail |
$RLX |
3,456.01 |
+101.76 |
+3.03% |
-18.23% |
| Gold & Silver |
$XAU |
104.56 |
-1.91 |
-1.80% |
-21.06% |
| Bank |
$BKX |
108.37 |
+1.83 |
+1.72% |
-18.04% |
| Biotech |
$BTK |
4,932.36 |
+182.24 |
+3.84% |
-10.62% |
|
|
|
 |
Finished Strong With Another Volume-Driven Gain After Earnings
Kenneth J. Gruneisen - Passed the CAN SLIM® Master's Exam
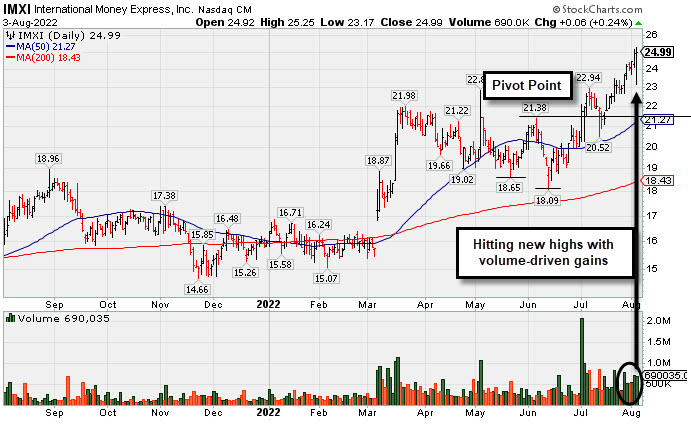
International Money Express (IMXI +$0.06 or +0.24% to $24.99) managed a new high close with today's 5th gain backed by above average volume in the span of 6 sessions. It reported Jun '22 quarterly earnings +26% on +21% sales revenues versus the year ago period, continuing its streak of quarterly earnings increases. Volume and volatility often increase near earnings news. Prior highs in the $22 area define initial support to watch above its 50-day moving average (DMA) line ($21.27).
IMXI was highlighted in yellow in the 7/01/22 mid-day report (read here) with new pivot point cited based on its 6/06/22 high after a "double bottom" base. It was last shown with detailed analysis on 7/15/22 with an annotated graph under the headline, "Stalled Since Clearing Double Bottom Base".
IMXI has a 95 Earnings Per Share rating. The Financial Services-Specialty firm's quarterly and annual earnings (C and A criteria) history has been strong and backed by solid sales revenues growth. The past 8 quarterly comparisons showed earnings increases above the year ago period by more than +25% (C criteria).
There is a small supply of only 38.4 million shares outstanding (S criteria) which can contribute to greater price volatility in the event of institutional buying or selling. The number of top-rated funds owning its shares rose from 210 in Mar '21 to 315 in Jun '22, a reassuring sign concerning the I criteria. Its current Up/Down Volume Ratio of 2.2 is an unbiased indication its shares have been under accumulation over the past 50 days. |
|
|
Color Codes Explained :
Y - Better candidates highlighted by our
staff of experts.
G - Previously featured
in past reports as yellow but may no longer be buyable under the
guidelines.
***Last / Change / Volume data in this table is the closing quote data***
Symbol/Exchange
Company Name
Industry Group |
PRICE |
CHANGE
(%Change) |
Day High |
Volume
(% DAV)
(% 50 day avg vol) |
52 Wk Hi
% From Hi |
Featured
Date |
Price
Featured |
Pivot Featured |
|
Max Buy |
 LLY
-
NYSE
LLY
-
NYSE
Eli Lilly & Co
Medical-Diversified
|
$313.83
|
-6.37
-1.99% |
$320.98
|
5,145,831
181.51% of 50 DAV
50 DAV is 2,835,000
|
$335.33
-6.41%
|
5/16/2022
|
$302.46
|
PP = $314.10
|
|
MB = $329.81
|
 Most Recent Note - 8/3/2022 12:36:52 PM
Y - Pulling back today for a 4th consecutive loss and undercutting its 50 DMA line ($316.24) which defines important near-term support to watch. More damaging losses would raise concerns and trigger a technical sell signal.
>>> FEATURED STOCK ARTICLE : Hovering Near "Max Buy" Level With Volume Totals Cooling - 7/22/2022 |
View all notes |
Set NEW NOTE alert |
Company Profile |
SEC
News |
Chart |
Request a new note
C
A
S
I |
IMXI
-
NASDAQ
International Money Exp
Financial Svcs-Specialty
|
$24.99
|
+0.06
0.24% |
$25.25
|
690,035
154.72% of 50 DAV
50 DAV is 446,000
|
$25.14
-0.60%
|
7/1/2022
|
$21.27
|
PP = $21.38
|
|
MB = $22.45
|
Most Recent Note - 8/3/2022 12:32:01 PM
G - Reported Jun '22 quarterly earnings +26% on +21% sales revenues versus the year ago period. Volume and volatility often increase near earnings news. Perched at its 52-week high. Its 50 DMA line ($21.26) defines important near-term support to watch on pullbacks.
>>> FEATURED STOCK ARTICLE : Stalled Since Clearing Double Bottom Base - 7/15/2022 |
View all notes |
Set NEW NOTE alert |
Company Profile |
SEC
News |
Chart |
Request a new note
C
A
S
I |
HRMY
-
NASDAQ
Harmony Biosciences Hldg
Medical-Biomed/Biotech
|
$52.32
|
-3.10
-5.59% |
$54.71
|
1,431,496
285.73% of 50 DAV
50 DAV is 501,000
|
$57.13
-8.42%
|
7/6/2022
|
$54.12
|
PP = $52.85
|
|
MB = $55.49
|
Most Recent Note - 8/3/2022 12:18:08 PM
Y - Abruptly retreating today with early lows near its 50 DMA line and prior low. Challenged its all-time high with above average volume behind a big gain on the prior session. Reported Jun '22 quarterly earnings +54% on +45% sales revenues versus the year ago period. Volume and volatility often increase near earnings news.
>>> FEATURED STOCK ARTICLE : Harmony Has Been Encountering Distributional Pressure - 7/18/2022 |
View all notes |
Set NEW NOTE alert |
Company Profile |
SEC
News |
Chart |
Request a new note
C
A
S
I |
CI
-
NYSE
Cigna Corp
Medical-Managed Care
|
$271.74
|
+0.30
0.11% |
$273.80
|
3,548,820
184.35% of 50 DAV
50 DAV is 1,925,000
|
$282.33
-3.75%
|
7/7/2022
|
$276.55
|
PP = $273.68
|
|
MB = $287.36
|
Most Recent Note - 8/3/2022 6:55:02 PM
Y - Churned higher volume today while perched within striking distance of its all-time high. Due to report earnings news for the Jun '22 quarter. Volume and volatility often increase near earnings news. Near-term support to watch is at its 50 DMA line ($265). More damaging losses would raise greater concerns.
>>> FEATURED STOCK ARTICLE : Pulled Back and Tested Support at 50-Day Moving Average - 7/19/2022 |
View all notes |
Set NEW NOTE alert |
Company Profile |
SEC
News |
Chart |
Request a new note
C
A
S
I |
AN
-
NYSE
Autonation Inc
SPECIALTY RETAIL - Auto Dealerships
|
$120.08
|
+3.85
3.31% |
$120.87
|
531,075
71.00% of 50 DAV
50 DAV is 748,000
|
$133.48
-10.04%
|
7/20/2022
|
$122.03
|
PP = $126.49
|
|
MB = $132.81
|
Most Recent Note - 8/3/2022 6:56:48 PM
Y - Posted a small gain backed by lighter than average volume today. Recent rebound above its 200 DMA line and 50 DMA line ($116) helped its outlook to improve. Subsequent volume-driven gains above the pivot point may trigger a technical buy signal. Reported Jun '22 quarterly earnings +34% on -2% sales revenues versus the year ago period. Faces some resistance due to overhead supply up to the $133 level.
>>> FEATURED STOCK ARTICLE : Autonation Earnings Due While Perched Near Pivot Point - 7/20/2022 |
View all notes |
Set NEW NOTE alert |
Company Profile |
SEC
News |
Chart |
Request a new note
C
A
S
I |
Symbol/Exchange
Company Name
Industry Group |
PRICE |
CHANGE
(%Change) |
Day High |
Volume
(% DAV)
(% 50 day avg vol) |
52 Wk Hi
% From Hi |
Featured
Date |
Price
Featured |
Pivot Featured |
|
Max Buy |
ESQ
-
NASDAQ
Esquire Financial Hldgs
Finance-Commercial Loans
|
$36.56
|
+0.43
1.19% |
$36.72
|
12,979
21.28% of 50 DAV
50 DAV is 61,000
|
$39.09
-6.47%
|
7/26/2022
|
$37.74
|
PP = $39.19
|
|
MB = $41.15
|
Most Recent Note - 8/2/2022 5:45:52 PM
Y - Pulled back today and undercut its 50 DMA line ($35.26) then rebounded to close in the upper third of its intra-day range for a small loss. Subsequent gains above the pivot point backed by at least +40% above average volume may trigger a technical buy signal. Its 50 DMA line defines initial support above its 200 DMA line ($33.96).
>>> FEATURED STOCK ARTICLE : Volume Driven Gains Approaching Prior High - 7/26/2022 |
View all notes |
Set NEW NOTE alert |
Company Profile |
SEC
News |
Chart |
Request a new note
C
A
S
I |
GPK
-
NYSE
Graphic Packaging Hldg
CONSUMER NON-DURABLES - Packaging and Containers
|
$21.91
|
-0.10
-0.45% |
$22.03
|
2,588,077
89.03% of 50 DAV
50 DAV is 2,907,000
|
$22.99
-4.70%
|
7/26/2022
|
$22.63
|
PP = $23.09
|
|
MB = $24.24
|
Most Recent Note - 8/3/2022 6:51:47 PM
Y - Volume totals have been cooling while hovering near its 52-week high. Highlighted in yellow in the 7/26/22 mid-day report with pivot point cited based on its 6/06/22 high plus 10 cents. Subsequent gains above the pivot point backed by at least +40% above average volume are needed to trigger a proper technical buy signal.
>>> FEATURED STOCK ARTICLE : Negative Reversal After Matching 52-Week High - 7/27/2022 |
View all notes |
Set NEW NOTE alert |
Company Profile |
SEC
News |
Chart |
Request a new note
C
A
S
I |
CSL
-
NYSE
Carlisle Cos Inc
Diversified Operations
|
$287.95
|
-2.60
-0.89% |
$292.19
|
500,380
138.99% of 50 DAV
50 DAV is 360,000
|
$297.34
-3.16%
|
7/28/2022
|
$282.31
|
PP = $275.23
|
|
MB = $288.99
|
Most Recent Note - 8/2/2022 5:29:21 PM
G - Volume cooled today while perched near its all-time high following volume-driven gains. Bullish action has continued since highlighted in yellow in the 7/28/22 mid-day report with pivot point cited based on its 5/04/22 high plus 10 cents. Prior highs in the $275 area define initial support to watch on pullbacks. See the latest FSU analysis for more details and a new annotated graph.
>>> FEATURED STOCK ARTICLE : Carlisle Perched at All-Time High After Noted Breakout - 8/2/2022 |
View all notes |
Set NEW NOTE alert |
Company Profile |
SEC
News |
Chart |
Request a new note
C
A
S
I |
ENPH
-
NASDAQ
Enphase Energy Inc
Energy-Solar
|
$290.25
|
-2.01
-0.69% |
$292.69
|
4,579,104
146.44% of 50 DAV
50 DAV is 3,127,000
|
$298.97
-2.92%
|
7/28/2022
|
$276.66
|
PP = $282.55
|
|
MB = $296.68
|
Most Recent Note - 8/3/2022 12:10:08 PM
Y - Color code is changed to yellow while pulling back below its "max buy" level with today's loss. Testing near the prior high in the $282 area noted as initial support to watch. Fundamentals remain strong after reporting solid Jun '22 quarterly results, continuing its strong earnings history.
>>> FEATURED STOCK ARTICLE : Pullback Following 3 Consecutive Gains With Heavier Volume - 8/1/2022 |
View all notes |
Set NEW NOTE alert |
Company Profile |
SEC
News |
Chart |
Request a new note
C
A
S
I |
PWR
-
NYSE
Quanta Services Inc
MATERIALS and CONSTRUCTION - General Contractors
|
$137.06
|
-1.25
-0.90% |
$139.71
|
1,659,563
107.35% of 50 DAV
50 DAV is 1,546,000
|
$146.84
-6.66%
|
7/28/2022
|
$141.83
|
PP = $140.14
|
|
MB = $147.15
|
Most Recent Note - 8/2/2022 5:48:58 PM
Y - Volume totals are cooling while holding its ground following a noted "negative reversal" on 7/29/22 after touching a new high. Slumped below its pivot point raising some concerns following the recently noted breakout. Due to report Jun '22 quarterly results on 8/04/22. Volume and volatility often increase near earnings news.
>>> FEATURED STOCK ARTICLE : Volume-Driven Breakout for Quanta Services - 7/28/2022 |
View all notes |
Set NEW NOTE alert |
Company Profile |
SEC
News |
Chart |
Request a new note
C
A
S
I |
Symbol/Exchange
Company Name
Industry Group |
PRICE |
CHANGE
(%Change) |
Day High |
Volume
(% DAV)
(% 50 day avg vol) |
52 Wk Hi
% From Hi |
Featured
Date |
Price
Featured |
Pivot Featured |
|
Max Buy |
CLFD
-
NASDAQ
Clearfield Inc
TELECOMMUNICATIONS - Cables / Satalite Equipment
|
$103.02
|
-0.58
-0.56% |
$105.00
|
282,218
151.73% of 50 DAV
50 DAV is 186,000
|
$105.36
-2.22%
|
7/29/2022
|
$94.10
|
PP = $86.81
|
|
MB = $91.15
|
Most Recent Note - 8/2/2022 12:24:52 PM
G - Powering further into new high territory today with another gain backed by above average volume, rallying well above its "max buy" level. Prior high in the $86 area defines initial support to watch on pullbacks. Fundamentals remain strong after it reported Jun '22 quarterly earnings +109% on +84% sales revenues above the year ago period.
>>> FEATURED STOCK ARTICLE : Volume Heavy Behind Technical Breakout - 7/29/2022 |
View all notes |
Set NEW NOTE alert |
Company Profile |
SEC
News |
Chart |
Request a new note
C
A
S
I |
|
|
|
THESE ARE NOT BUY RECOMMENDATIONS!
Comments contained in the body of this report are technical
opinions only. The material herein has been obtained
from sources believed to be reliable and accurate, however,
its accuracy and completeness cannot be guaranteed.
This site is not an investment advisor, hence it does
not endorse or recommend any securities or other investments.
Any recommendation contained in this report may not
be suitable for all investors and it is not to be deemed
an offer or solicitation on our part with respect to
the purchase or sale of any securities. All trademarks,
service marks and trade names appearing in this report
are the property of their respective owners, and are
likewise used for identification purposes only.
This report is a service available
only to active Paid Premium Members.
You may opt-out of receiving report notifications
at any time. Questions or comments may be submitted
by writing to Premium Membership Services 665 S.E. 10 Street, Suite 201 Deerfield Beach, FL 33441-5634 or by calling 1-800-965-8307
or 954-785-1121.
|
|
|