You are not logged in.
This means you
CAN ONLY VIEW reports that were published prior to Monday, March 24, 2025.
You
MUST UPGRADE YOUR MEMBERSHIP if you want to see any current reports.
AFTER MARKET UPDATE - THURSDAY, AUGUST 11TH, 2022
Previous After Market Report Next After Market Report >>>
|
|
|
|
DOW |
+27.16 |
33,336.67 |
+0.08% |
|
Volume |
860,354,980 |
-5% |
|
Volume |
5,798,968,100 |
+14% |
|
NASDAQ |
-74.89 |
12,779.91 |
-0.58% |
|
Advancers |
1,780 |
58% |
|
Advancers |
2,368 |
54% |
|
S&P 500 |
-2.97 |
4,207.27 |
-0.07% |
|
Decliners |
1,270 |
42% |
|
Decliners |
1,982 |
46% |
|
Russell 2000 |
+6.01 |
1,975.26 |
+0.31% |
|
52 Wk Highs |
57 |
|
|
52 Wk Highs |
86 |
|
|
S&P 600 |
+8.06 |
1,264.48 |
+0.64% |
|
52 Wk Lows |
28 |
|
|
52 Wk Lows |
47 |
|
|
 |
Breadth Positive as Major Averages Ended Mixed
Kenneth J. Gruneisen - Passed the CAN SLIM® Master's Exam
The S&P 500 dipped 0.1%, wiping out an earlier increase of more than 1%. The Nasdaq Composite retreated 0.6%, giving back some of yesterday’s advance that had propelled the tech-heavy benchmark 20% above its mid-June low--meeting one widely cited definition of a new bull market. The Dow added 27 points. The volume totals reported were mixed, lighter than the prior session on the NYSE and higher on the Nasdaq exchange. Advancers led decliners by a 3-2 margin on the NYSE and by a 6-5 margin on the Nasdaq exchange. There were 42 high-ranked companies from the Leaders List that hit new 52-week highs and were listed on the BreakOuts Page, versus the total of 40 on the prior session. New 52-week highs outnumbered new 52-week lows on the NYSE and on the Nasdaq exchange. The market is in a confirmed uptrend (M criteria). Any sustainable rally requires a healthy crop of leading stocks hitting new highs, so the recent improvement in leadership was a reassuring sign.
Chart courtesy of www.stockcharts.com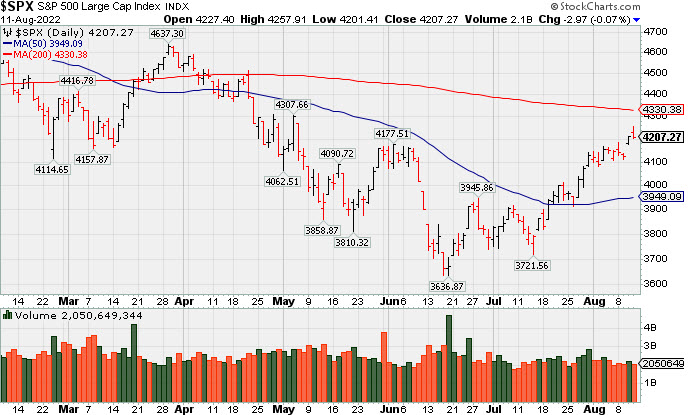 PICTURED: The S&P 500 Index pulled back with lighter volume. It has been approaching its downward sloping 200 DMA line.
U.S. stocks finished mixed on Thursday, erasing early session gains despite another softer-than-forecasted inflation reading. Six of 11 S&P 500 sectors closed in negative territory, with Energy outperforming amid a back-up in oil prices. West Texas Intermediate crude climbed 2.4% to $94.09/barrel after the International Energy Agency (IEA) raised its 2022 oil demand growth forecast. In earnings, Walt Disney Co. (DIS +4.68%) rose on strong results that included a larger-than-expected subscription increase for its streaming service, Disney+.
On the data front, the Producer Price Index (PPI) unexpectedly declined for the first time in over two years, down 0.5% in July, easing from the prior month’s 1% advance. Yesterday, the Consumer Price Index (CPI) was unchanged in July, versus estimates of a 0.2% gain, marking the first time since May 2020 that the reading did not reflect a monthly increase. The lower print was widely anticipated amid the recent pullback in oil prices. However, the headline figure remained elevated at 8.5% year-over-year.
Despite the softer inflation reports, the latest remarks from Federal Reserve officials continued to reiterate the need for further rate hikes. Longer-dated Treasuries closed lower, with the yield on the 10-year note rising 10 basis points (0.10%) to 2.89%. In other data today, weekly initial jobless claims came in at 262,000, versus the prior 248,000 figure. |
 Kenneth J. Gruneisen started out as a licensed stockbroker in August 1987, a couple of months prior to the historic stock market crash that took the Dow Jones Industrial Average down -22.6% in a single day. He has published daily fact-based fundamental and technical analysis on high-ranked stocks online for two decades. Through FACTBASEDINVESTING.COM, Kenneth provides educational articles, news, market commentary, and other information regarding proven investment systems that work in good times and bad.
Comments contained in the body of this report are technical opinions only and are not necessarily those of Gruneisen Growth Corp. The material herein has been obtained from sources believed to be reliable and accurate, however, its accuracy and completeness cannot be guaranteed. Our firm, employees, and customers may effect transactions, including transactions contrary to any recommendation herein, or have positions in the securities mentioned herein or options with respect thereto. Any recommendation contained in this report may not be suitable for all investors and it is not to be deemed an offer or solicitation on our part with respect to the purchase or sale of any securities. |
|
 |
Energy-Linked Indexes Outpaced Financials and Retail
Kenneth J. Gruneisen - Passed the CAN SLIM® Master's Exam
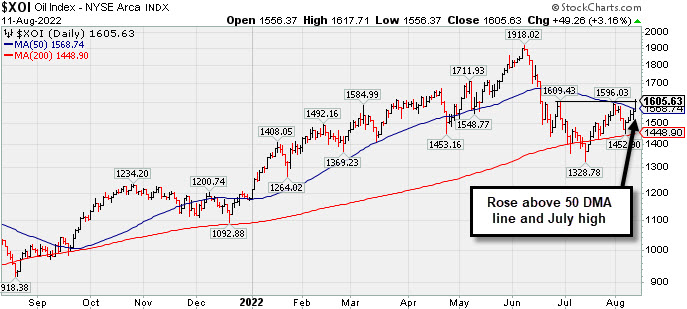
Financial shares had a positive bias as the Bank Index ($BKX +1.60%) outpaced the Broker/Dealer Index ($XBD +0.34%). The Retail Index ($RLX +0.67%) also edged higher. Commodity-linked groups were mixed as the Oil Services Index ($OSX +3.90%) and Integrated Oil Index ($XOI +3.16%) both posted solid gains while the Gold & Silver Index ($XAU -2.11%) ended lower. The tech sector had a negative bias as the Biotech Index ($BTK -1.53%) led the Networking Index ($NWX -0.68%) and the Semiconductor Index ($SOX -0.34%) lower.
PICTURED: The Integrated Oil Index ($XOI +3.16%) posted a big gain as it rose above its 50-day moving average (DMA) line and above its July high.
| Oil Services |
$OSX |
68.25 |
+2.56 |
+3.90% |
+29.46% |
| Integrated Oil |
$XOI |
1,605.63 |
+49.26 |
+3.16% |
+36.28% |
| Semiconductor |
$SOX |
2,978.70 |
-10.01 |
-0.34% |
-24.52% |
| Networking |
$NWX |
818.15 |
-5.63 |
-0.68% |
-15.75% |
| Broker/Dealer |
$XBD |
457.34 |
+1.56 |
+0.34% |
-6.06% |
| Retail |
$RLX |
3,500.61 |
+23.18 |
+0.67% |
-17.17% |
| Gold & Silver |
$XAU |
109.43 |
-2.36 |
-2.11% |
-17.38% |
| Bank |
$BKX |
113.41 |
+1.79 |
+1.60% |
-14.23% |
| Biotech |
$BTK |
5,012.18 |
-78.02 |
-1.53% |
-9.17% |
|
|
|
 |
Autonation Hovering Near Stubborn Resistance
Kenneth J. Gruneisen - Passed the CAN SLIM® Master's Exam
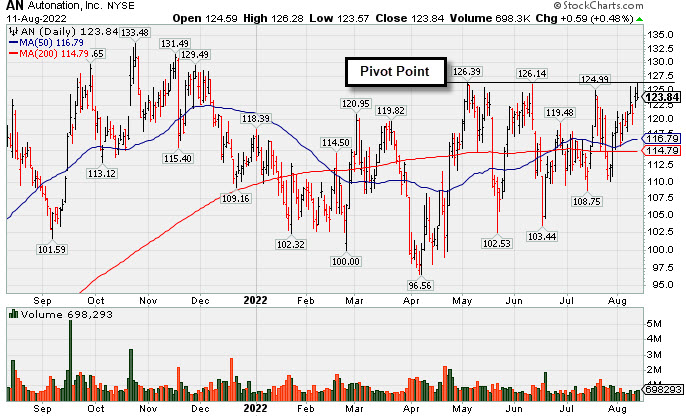
Autonation Inc (AN +$0.59 or +0.48% to $123.84) posted a gain backed by near average volume today but ended near the session low. Recent gains have lacked volume conviction while challenging previously stubborn resistance in the $126 area. It has been consolidating above its 200 DMA line and 50 DMA line ($116.79) . Subsequent volume-driven gains above the pivot point may trigger a technical buy signal. It still faces some resistance due to overhead supply up to the $133 level.
AN has a 97 Earnings Per Share Rating. Recently it reported Jun '22 quarterly earnings +34% on -2% sales revenues versus the year ago period, its 8th strong earnings comparison well above the +25% minimum guideline (C criteria). Annual earnings growth has been strong. The stock was was highlighted in yellow with pivot point cited based on its 5/04/22 high plus 10 cents in the 7/20/22 mid-day report (read here). It was last shown in this FSU section on 7/20/22 with an annotated graph under the headline, "Autonation Earnings Due While Perched Near Pivot Point".
AN hails from the Retail/Wholesale Automobile group which is currently ranked 60th on the 197 Industry Groups list (L criteria). It has 56 million shares outstanding (S criteria) which can contribute to greater price volatility in the event of institutional buying or selling. The number of top-rated funds owning its shares rose from 671 in Sep '21 to 733 in Jun '22, a reassuring sign concerning the I criteria.
|
|
|
Color Codes Explained :
Y - Better candidates highlighted by our
staff of experts.
G - Previously featured
in past reports as yellow but may no longer be buyable under the
guidelines.
***Last / Change / Volume data in this table is the closing quote data***
Symbol/Exchange
Company Name
Industry Group |
PRICE |
CHANGE
(%Change) |
Day High |
Volume
(% DAV)
(% 50 day avg vol) |
52 Wk Hi
% From Hi |
Featured
Date |
Price
Featured |
Pivot Featured |
|
Max Buy |
 LLY
-
NYSE
LLY
-
NYSE
Eli Lilly & Co
Medical-Diversified
|
$301.17
|
-3.44
-1.13% |
$305.42
|
2,198,795
76.83% of 50 DAV
50 DAV is 2,862,000
|
$335.33
-10.19%
|
5/16/2022
|
$302.46
|
PP = $314.10
|
|
MB = $329.81
|
 Most Recent Note - 8/11/2022 7:06:43 PM
Recently reported Jun '22 quarterly earnings -32% on -4% sales revenues versus the year ago period raising fundamental concerns. Sputtering since violating its 50 DMA line ($315) with noted volume-driven losses raising concerns and triggering a technical sell signal. A rebound above the 50 DMA line is needed for its outlook to improve. It will be dropped from the Featured Stocks list tonight.
>>> FEATURED STOCK ARTICLE : Hovering Near "Max Buy" Level With Volume Totals Cooling - 7/22/2022 |
View all notes |
Set NEW NOTE alert |
Company Profile |
SEC
News |
Chart |
Request a new note
C
A
S
I |
IMXI
-
NASDAQ
International Money Exp
Financial Svcs-Specialty
|
$24.31
|
-1.08
-4.25% |
$25.53
|
771,425
156.79% of 50 DAV
50 DAV is 492,000
|
$26.11
-6.89%
|
7/1/2022
|
$21.27
|
PP = $21.38
|
|
MB = $22.45
|
Most Recent Note - 8/11/2022 7:09:03 PM
G - Pulled back today for a 2nd volume-driven loss in the span of 3 sessions off its all-time high. Prior highs in the $22 area and its 50 DMA line ($21.89) define important near-term support to watch. Reported Jun '22 quarterly earnings +21% on +17% sales revenues versus the year ago period, below the +25% minimum earnings guideline (C criteria).
>>> FEATURED STOCK ARTICLE : Finished Strong With Another Volume-Driven Gain After Earnings - 8/3/2022 |
View all notes |
Set NEW NOTE alert |
Company Profile |
SEC
News |
Chart |
Request a new note
C
A
S
I |
HRMY
-
NASDAQ
Harmony Biosciences Holdings
Medical-Biomed/Biotech
|
$50.91
|
-1.53
-2.92% |
$53.00
|
398,949
71.20% of 50 DAV
50 DAV is 560,300
|
$57.13
-10.89%
|
7/6/2022
|
$54.12
|
PP = $52.85
|
|
MB = $55.49
|
Most Recent Note - 8/10/2022 7:08:53 PM
Y - Still churning above average volume and consolidating above noted support near its 50 DMA line ($49.90) and prior low ($48.85). More damaging losses would raise concerns and trigger technical sell signals. Challenged its all-time high but met stubborn resistance in the $57 area after reporting Jun '22 quarterly earnings +54% on +45% sales revenues versus the year ago period.
>>> FEATURED STOCK ARTICLE : Churning Higher Volume While Perched Near High After Earnings News - 8/4/2022 |
View all notes |
Set NEW NOTE alert |
Company Profile |
SEC
News |
Chart |
Request a new note
C
A
S
I |
CI
-
NYSE
Cigna Corp
Medical-Managed Care
|
$286.00
|
-1.07
-0.37% |
$289.63
|
1,844,387
89.66% of 50 DAV
50 DAV is 2,057,000
|
$288.47
-0.86%
|
7/7/2022
|
$276.55
|
PP = $273.68
|
|
MB = $287.36
|
Most Recent Note - 8/9/2022 7:16:22 PM
Y - Wedged higher and hit a new all-time high with lighter volume behind today's 5th consecutive gain. Still below its "max buy" level. Reported earnings news for the Jun '22 quarter +19% on +5% sales revenues versus the year ago period, breaking a streak of 3 quarterly earnings increases above the +25% minimum guideline (C criteria). Near-term support to watch is at its 50 DMA line ($266.66). See the latest FSU analysis for more details and a new annotated graph.
>>> FEATURED STOCK ARTICLE : Wedging Higher With Lighter Volume Behind Gain for New High - 8/9/2022 |
View all notes |
Set NEW NOTE alert |
Company Profile |
SEC
News |
Chart |
Request a new note
C
A
S
I |
AN
-
NYSE
Autonation Inc
SPECIALTY RETAIL - Auto Dealerships
|
$123.84
|
+0.59
0.48% |
$126.28
|
698,293
98.91% of 50 DAV
50 DAV is 706,000
|
$133.48
-7.22%
|
7/20/2022
|
$122.03
|
PP = $126.49
|
|
MB = $132.81
|
Most Recent Note - 8/11/2022 7:00:21 PM
Y - Posted a gain backed by near average volume today but ended near the session low after challenging previously stubborn resistance in the $126 area. Subsequent volume-driven gains above the pivot point may trigger a technical buy signal. Reported Jun '22 quarterly earnings +34% on -2% sales revenues versus the year ago period. Still faces some resistance due to overhead supply up to the $133 level. See the latest FSU analysis for more details and a new annotated graph.
>>> FEATURED STOCK ARTICLE : Autonation Hovering Near Stubborn Resistance - 8/11/2022 |
View all notes |
Set NEW NOTE alert |
Company Profile |
SEC
News |
Chart |
Request a new note
C
A
S
I |
Symbol/Exchange
Company Name
Industry Group |
PRICE |
CHANGE
(%Change) |
Day High |
Volume
(% DAV)
(% 50 day avg vol) |
52 Wk Hi
% From Hi |
Featured
Date |
Price
Featured |
Pivot Featured |
|
Max Buy |
ESQ
-
NASDAQ
Esquire Financial Hldgs
Finance-Commercial Loans
|
$38.42
|
+0.01
0.03% |
$39.42
|
13,614
22.69% of 50 DAV
50 DAV is 60,000
|
$39.09
-1.71%
|
7/26/2022
|
$37.74
|
PP = $39.19
|
|
MB = $41.15
|
Most Recent Note - 8/11/2022 7:01:53 PM
Y - Posted a small gain today but ended near the session low after challenging previously stubborn resistance in the $39 area. Its 50 DMA line ($35.41) defines important near-term support. Subsequent gains above the pivot point backed by at least +40% above average volume may trigger a technical buy signal.
>>> FEATURED STOCK ARTICLE : Volume Driven Gains Approaching Prior High - 7/26/2022 |
View all notes |
Set NEW NOTE alert |
Company Profile |
SEC
News |
Chart |
Request a new note
C
A
S
I |
GPK
-
NYSE
Graphic Packaging Hldg
CONSUMER NON-DURABLES - Packaging and Containers
|
$23.20
|
+0.09
0.39% |
$23.50
|
2,244,703
77.11% of 50 DAV
50 DAV is 2,911,000
|
$22.99
0.91%
|
7/26/2022
|
$22.63
|
PP = $23.09
|
|
MB = $24.24
|
Most Recent Note - 8/10/2022 12:39:58 PM
Y - Gapped up today on track for a 4th consecutive gain and hitting a new 52-week high. A gain and strong close above the pivot point backed by at least +40% above average volume may trigger a proper technical buy signal. Highlighted in yellow in the 7/26/22 mid-day report with pivot point cited based on its 6/06/22 high plus 10 cents.
>>> FEATURED STOCK ARTICLE : Negative Reversal After Matching 52-Week High - 7/27/2022 |
View all notes |
Set NEW NOTE alert |
Company Profile |
SEC
News |
Chart |
Request a new note
C
A
S
I |
CSL
-
NYSE
Carlisle Cos Inc
Diversified Operations
|
$311.27
|
+4.16
1.35% |
$315.00
|
318,835
82.39% of 50 DAV
50 DAV is 387,000
|
$304.69
2.16%
|
7/28/2022
|
$282.31
|
PP = $275.23
|
|
MB = $288.99
|
Most Recent Note - 8/10/2022 6:58:59 PM
G - Hit another new all-time high with today's volume-driven gain adding to a recent spurt. Prior highs in the $275 area define initial support to watch on pullbacks.
>>> FEATURED STOCK ARTICLE : Carlisle Perched at All-Time High After Noted Breakout - 8/2/2022 |
View all notes |
Set NEW NOTE alert |
Company Profile |
SEC
News |
Chart |
Request a new note
C
A
S
I |
ENPH
-
NASDAQ
Enphase Energy Inc
Energy-Solar
|
$292.90
|
-10.35
-3.41% |
$305.61
|
2,899,892
87.06% of 50 DAV
50 DAV is 3,331,000
|
$308.88
-5.17%
|
7/28/2022
|
$276.66
|
PP = $282.55
|
|
MB = $296.68
|
Most Recent Note - 8/11/2022 7:11:10 PM
Y - Pulled back today with below average volume, and its color code is changed to yellow after dipping below its "max buy" level. The prior high in the $282 area has been noted as initial support to watch on pullbacks. Fundamentals remain strong.
>>> FEATURED STOCK ARTICLE : Pullback Following 3 Consecutive Gains With Heavier Volume - 8/1/2022 |
View all notes |
Set NEW NOTE alert |
Company Profile |
SEC
News |
Chart |
Request a new note
C
A
S
I |
PWR
-
NYSE
Quanta Services Inc
MATERIALS and CONSTRUCTION - General Contractors
|
$141.25
|
+1.00
0.71% |
$142.74
|
887,965
58.27% of 50 DAV
50 DAV is 1,524,000
|
$146.84
-3.81%
|
7/28/2022
|
$141.83
|
PP = $140.14
|
|
MB = $147.15
|
Most Recent Note - 8/10/2022 7:15:55 PM
Y - Posted a gain today with lighter than average volume for a 2nd best ever close back above its pivot point. Fundamentals remain strong.
>>> FEATURED STOCK ARTICLE : Volume-Driven Breakout for Quanta Services - 7/28/2022 |
View all notes |
Set NEW NOTE alert |
Company Profile |
SEC
News |
Chart |
Request a new note
C
A
S
I |
Symbol/Exchange
Company Name
Industry Group |
PRICE |
CHANGE
(%Change) |
Day High |
Volume
(% DAV)
(% 50 day avg vol) |
52 Wk Hi
% From Hi |
Featured
Date |
Price
Featured |
Pivot Featured |
|
Max Buy |
CLFD
-
NASDAQ
Clearfield Inc
TELECOMMUNICATIONS - Cables / Satalite Equipment
|
$115.53
|
-1.09
-0.93% |
$119.97
|
404,135
133.82% of 50 DAV
50 DAV is 302,000
|
$114.73
0.70%
|
7/29/2022
|
$94.10
|
PP = $86.81
|
|
MB = $91.15
|
Most Recent Note - 8/10/2022 12:27:49 PM
G - Reversed into the red after early gains today for another new all-time high. Following volume-driven gains, the prior high in the $86 area defines initial support to watch on pullbacks. Fundamentals remain strong after it reported Jun '22 quarterly earnings +109% on +84% sales revenues above the year ago period.
>>> FEATURED STOCK ARTICLE : Volume Heavy Behind Technical Breakout - 7/29/2022 |
View all notes |
Set NEW NOTE alert |
Company Profile |
SEC
News |
Chart |
Request a new note
C
A
S
I |
GFF
-
NYSE
Griffon Corporation
MATERIALS and CONSTRUCTION - General Building Materials
|
$33.70
|
+0.72
2.18% |
$34.35
|
506,674
110.87% of 50 DAV
50 DAV is 457,000
|
$32.65
3.22%
|
8/8/2022
|
$32.46
|
PP = $31.12
|
|
MB = $32.68
|
Most Recent Note - 8/11/2022 7:12:57 PM
G - Hit yet another new high with today's gain backed by near average volume, getting extended from the previously noted base. Prior highs in the $31 area define initial support to watch on pullbacks.
>>> FEATURED STOCK ARTICLE : Breakout for New High Backed by +52% Above Average Volume - 8/8/2022 |
View all notes |
Set NEW NOTE alert |
Company Profile |
SEC
News |
Chart |
Request a new note
C
A
S
I |
CLH
-
NYSE
Clean Harbors Inc
Pollution Control
|
$114.98
|
+2.33
2.07% |
$115.87
|
435,137
138.14% of 50 DAV
50 DAV is 315,000
|
$118.89
-3.29%
|
8/10/2022
|
$111.78
|
PP = $115.10
|
|
MB = $120.86
|
Most Recent Note - 8/10/2022 6:57:40 PM
Y - Posted a solid volume-driven gain today and finished in the upper third of its intra-day range after highlighted in yellow in the earlier mid-day report with pivot point cited based on its 4/01/22 high plus 10 cents. A subsequent gain above the pivot point backed by at least +40% above average volume may trigger a technical buy signal. Holding its ground after recent volume-driven gains approaching its April high ($115) and all-time high. Little resistance remains due to overhead supply up to the $118 level. Reported Jun '22 quarterly earnings +105% on +46% sales revenues versus the year ago period. Prior quarters showed a strong earnings track record with earnings above the +25% minimum guideline (C criteria). Annual earnings (A criteria) growth has been strong and steady. See the latest FSU analysis for more details and a new annotated graph.
>>> FEATURED STOCK ARTICLE : Pollution Control Firm Perched Near Prior High - 8/10/2022 |
View all notes |
Set NEW NOTE alert |
Company Profile |
SEC
News |
Chart |
Request a new note
C
A
S
I |
|
|
|
THESE ARE NOT BUY RECOMMENDATIONS!
Comments contained in the body of this report are technical
opinions only. The material herein has been obtained
from sources believed to be reliable and accurate, however,
its accuracy and completeness cannot be guaranteed.
This site is not an investment advisor, hence it does
not endorse or recommend any securities or other investments.
Any recommendation contained in this report may not
be suitable for all investors and it is not to be deemed
an offer or solicitation on our part with respect to
the purchase or sale of any securities. All trademarks,
service marks and trade names appearing in this report
are the property of their respective owners, and are
likewise used for identification purposes only.
This report is a service available
only to active Paid Premium Members.
You may opt-out of receiving report notifications
at any time. Questions or comments may be submitted
by writing to Premium Membership Services 665 S.E. 10 Street, Suite 201 Deerfield Beach, FL 33441-5634 or by calling 1-800-965-8307
or 954-785-1121.
|
|
|