You are not logged in.
This means you
CAN ONLY VIEW reports that were published prior to Monday, March 24, 2025.
You
MUST UPGRADE YOUR MEMBERSHIP if you want to see any current reports.
AFTER MARKET UPDATE - MONDAY, AUGUST 8TH, 2022
Previous After Market Report Next After Market Report >>>
|
|
|
|
DOW |
+29.07 |
32,832.54 |
+0.09% |
|
Volume |
845,897,294 |
+2% |
|
Volume |
5,166,199,600 |
+6% |
|
NASDAQ |
-13.10 |
12,644.46 |
-0.10% |
|
Advancers |
2,081 |
67% |
|
Advancers |
2,722 |
61% |
|
S&P 500 |
-5.13 |
4,140.06 |
-0.12% |
|
Decliners |
1,041 |
33% |
|
Decliners |
1,756 |
39% |
|
Russell 2000 |
+19.38 |
1,941.21 |
+1.01% |
|
52 Wk Highs |
38 |
|
|
52 Wk Highs |
104 |
|
|
S&P 600 |
+7.79 |
1,247.19 |
+0.63% |
|
52 Wk Lows |
18 |
|
|
52 Wk Lows |
36 |
|
|
 |
Major Averages Were Mixed and Little Changed
Kenneth J. Gruneisen - Passed the CAN SLIM® Master's Exam
The S&P 500 slipped 0.1%, erasing an early session advance of 1%. The Nasdaq Composite also lost 0.1%. Both benchmarks just came off their first three-week winning stretch since April. The Dow added 29 points. Developments from Washington were also in focus, with the Senate yesterday passing the Inflation Reduction Act, which includes $430 billion in spending to address climate change and extend health care coverage. The volume totals reported were higher than the prior session on the NYSE and on the Nasdaq exchange. Advancers led decliners by a 2-1 margin on the NYSE and by a 5-3 margin on the Nasdaq exchange. There were 25 high-ranked companies from the Leaders List that hit new 52-week highs and were listed on the BreakOuts Page, versus the total of 25 on the prior session. New 52-week highs outnumbered new 52-week lows on the NYSE and on the Nasdaq exchange. The market is in a confirmed uptrend (M criteria). Any sustainable rally requires a healthy crop of leading stocks hitting new highs, so the recent improvement in leadership was a reassuring sign.
Chart courtesy of www.stockcharts.com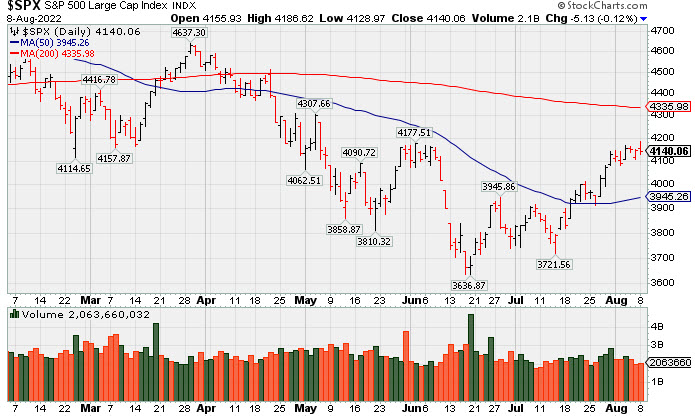 PICTURED: The S&P 500 Index posted a 3rd consecutive small loss with light volume. It has recently been trading near its June high but still remains well below its 200 DMA line.
U.S. stocks finished little changed on Monday as weakness in Tech shares weighed on sentiment. Investors also exercised caution ahead of this week’s Consumer Price Index (CPI) report, as the update should have implications for the path of Federal Reserve (Fed) rate increases. Seven of 11 S&P 500 sectors closed in positive territory. Technology was a notable decliner amid weakness in chipmakers. NVIDIA Corp. (NVDA -6.30%) slumped following a negative pre-announcement that included a sharp miss in quarterly revenue and disappointing guidance. In other earnings, Tyson Foods Inc. (TSN -8.40%) after its profit tally fell short of consensus estimates. Meanwhile, in M&A (merger and acquisition) news, Global Blood Therapeutics Inc. (GBT +4.32%) has nearly doubled over the past three sessions after officially agreeing to be acquired by Pfizer Inc. (PFE +0.61%) for $5.4 billion.
Treasuries recouped some of their recent decline, with the yield on the 10-year note down eight basis points (0.08%) to 2.75%. However, the two-year note yield remains more than 0.40% above the longer-term yield at 3.21% as the inversion in this part of the curve deepens in a widely cited recessionary signal. Last week, shorter-term Treasury yields jumped following a robust jobs report that bolstered expectations for another sizeable Fed rate hike in September.
|
 Kenneth J. Gruneisen started out as a licensed stockbroker in August 1987, a couple of months prior to the historic stock market crash that took the Dow Jones Industrial Average down -22.6% in a single day. He has published daily fact-based fundamental and technical analysis on high-ranked stocks online for two decades. Through FACTBASEDINVESTING.COM, Kenneth provides educational articles, news, market commentary, and other information regarding proven investment systems that work in good times and bad.
Comments contained in the body of this report are technical opinions only and are not necessarily those of Gruneisen Growth Corp. The material herein has been obtained from sources believed to be reliable and accurate, however, its accuracy and completeness cannot be guaranteed. Our firm, employees, and customers may effect transactions, including transactions contrary to any recommendation herein, or have positions in the securities mentioned herein or options with respect thereto. Any recommendation contained in this report may not be suitable for all investors and it is not to be deemed an offer or solicitation on our part with respect to the purchase or sale of any securities. |
|
 |
Tech Sector and Bank Index Fell; Commodity-Linked Groups Rose
Kenneth J. Gruneisen - Passed the CAN SLIM® Master's Exam
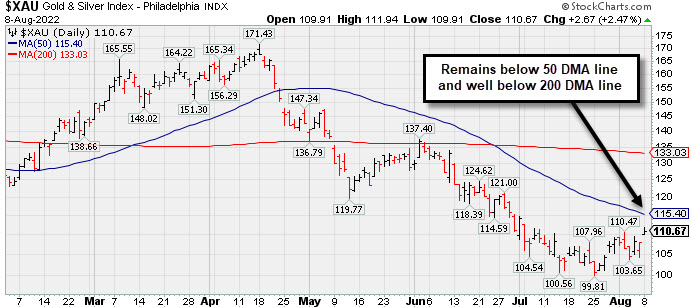
The Bank Index ($BKX -0.53%) edged lower while the Broker/Dealer Index ($XBD +0.20%) posted a tiny gain and the Retail Index ($RLX -0.12%)finished slightly in the red. The tech sector had a negative bias as the Semiconductor Index ($SOX -1.61%) outpaced the Networking Index ($NWX -0.50%) to the downside, meanwhile the Biotech Index ($BTK +0.10%) eked out a tiny gain. Commodity-linked groups had a positive bias as the Gold & Silver Index ($XAU +2.47%) outpaced the Oil Services Index ($OSX +0.91%) and Integrated Oil Index ($XOI +0.78%).
PICTURED: The Gold & Silver Index ($XAU +2.47%) posted a solid gain but remains below its 50-day moving average (DMA) line and well below its 200 DMA line.
| Oil Services |
$OSX |
64.63 |
+0.58 |
+0.91% |
+22.59% |
| Integrated Oil |
$XOI |
1,514.23 |
+11.68 |
+0.78% |
+28.52% |
| Semiconductor |
$SOX |
3,004.34 |
-49.05 |
-1.61% |
-23.87% |
| Networking |
$NWX |
803.43 |
-4.07 |
-0.50% |
-17.26% |
| Broker/Dealer |
$XBD |
452.09 |
+0.90 |
+0.20% |
-7.14% |
| Retail |
$RLX |
3,475.79 |
-4.22 |
-0.12% |
-17.76% |
| Gold & Silver |
$XAU |
110.67 |
+2.67 |
+2.47% |
-16.45% |
| Bank |
$BKX |
107.99 |
-0.58 |
-0.53% |
-18.33% |
| Biotech |
$BTK |
5,102.09 |
+5.30 |
+0.10% |
-7.54% |
|
|
|
 |
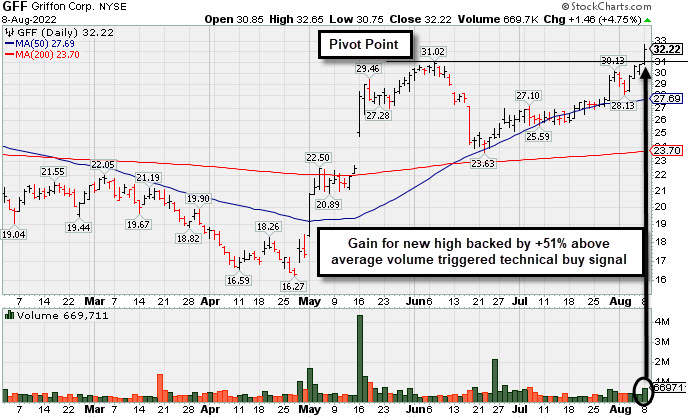
Breakout for New High Backed by +52% Above Average Volume
Kenneth J. Gruneisen - Passed the CAN SLIM® Master's Exam
Griffon Corporation (GFF +$1.46 or +4.75% to $32.22) finished strong after highlighted in yellow with pivot point cited based on its 6/07/22 high plus 10 cents in the earlier mid-day report (read here). It hit a new high with today's 4th consecutive gain and close above the pivot point backed by +51% above average volume triggering a technical buy signal. Prior highs define initial support to watch on pullbacks.
GFF has a 99 Earnings Per Share Rating. It reported Jun '22 quarterly earnings +215% on +31% sales revenues versus the year ago period, its 3rd strong quarterly comparison above the +25% minimum guideline (C criteria). Annual earnings (A criteria) growth has been strong and steady.
The company has only 57 million shares outstanding (S criteria) which can contribute to greater volatility in the event of institutional buying or selling. The number of top-dated funds owning its shares fell from 355 in Sep '21 to 336 in Jun '22. However, its current Up/Down Volume Ratio of 2.3 is an unbiased indication its shares have been under accumulation over the past 50 days.
|
|
|
Color Codes Explained :
Y - Better candidates highlighted by our
staff of experts.
G - Previously featured
in past reports as yellow but may no longer be buyable under the
guidelines.
***Last / Change / Volume data in this table is the closing quote data***
Symbol/Exchange
Company Name
Industry Group |
PRICE |
CHANGE
(%Change) |
Day High |
Volume
(% DAV)
(% 50 day avg vol) |
52 Wk Hi
% From Hi |
Featured
Date |
Price
Featured |
Pivot Featured |
|
Max Buy |
 LLY
-
NYSE
LLY
-
NYSE
Eli Lilly & Co
Medical-Diversified
|
$302.50
|
+1.18
0.39% |
$306.12
|
3,218,404
110.52% of 50 DAV
50 DAV is 2,912,000
|
$335.33
-9.79%
|
5/16/2022
|
$302.46
|
PP = $314.10
|
|
MB = $329.81
|
 Most Recent Note - 8/8/2022 12:55:42 PM
G - On track today for a 7th consecutive loss, slumping further below its 50 DMA line ($316) raising concerns. Only a prompt rebound above the 50 DMA line would help its outlook improve.
>>> FEATURED STOCK ARTICLE : Hovering Near "Max Buy" Level With Volume Totals Cooling - 7/22/2022 |
View all notes |
Set NEW NOTE alert |
Company Profile |
SEC
News |
Chart |
Request a new note
C
A
S
I |
IMXI
-
NASDAQ
International Money Exp
Financial Svcs-Specialty
|
$26.04
|
+1.06
4.24% |
$26.11
|
877,428
192.84% of 50 DAV
50 DAV is 455,000
|
$25.25
3.13%
|
7/1/2022
|
$21.27
|
PP = $21.38
|
|
MB = $22.45
|
Most Recent Note - 8/8/2022 12:54:25 PM
G - Reported Jun '22 quarterly earnings +21% on +17% sales revenues versus the year ago period. Hitting another new 52-week high with today's volume-driven gain. Its 50 DMA line ($21.60) defines important near-term support to watch on pullbacks.
>>> FEATURED STOCK ARTICLE : Finished Strong With Another Volume-Driven Gain After Earnings - 8/3/2022 |
View all notes |
Set NEW NOTE alert |
Company Profile |
SEC
News |
Chart |
Request a new note
C
A
S
I |
HRMY
-
NASDAQ
Harmony Biosciences Holdings
Medical-Biomed/Biotech
|
$54.00
|
+1.50
2.86% |
$54.98
|
1,733,538
329.38% of 50 DAV
50 DAV is 526,300
|
$57.13
-5.48%
|
7/6/2022
|
$54.12
|
PP = $52.85
|
|
MB = $55.49
|
Most Recent Note - 8/8/2022 12:53:07 PM
Y - Churning above average volume while consolidating after testing support near its 50 DMA line ($49.55) and prior low. Challenged its all-time high after reporting Jun '22 quarterly earnings +54% on +45% sales revenues versus the year ago period.
>>> FEATURED STOCK ARTICLE : Churning Higher Volume While Perched Near High After Earnings News - 8/4/2022 |
View all notes |
Set NEW NOTE alert |
Company Profile |
SEC
News |
Chart |
Request a new note
C
A
S
I |
CI
-
NYSE
Cigna Corp
Medical-Managed Care
|
$281.77
|
+0.00
0.00% |
$283.85
|
2,391,376
117.92% of 50 DAV
50 DAV is 2,028,000
|
$284.46
-0.95%
|
7/7/2022
|
$276.55
|
PP = $273.68
|
|
MB = $287.36
|
Most Recent Note - 8/4/2022 12:20:33 PM
Y - Gapped up today for a gain hitting a new all-time high, however it is still below its "max buy" level. Reported earnings news for the Jun '22 quarter +19% on +5% sales revenues versus the year ago period, breaking a streak of 3 quarterly earnings increases above the +25% minimum guideline (C criteria). Volume and volatility often increase near earnings news. Near-term support to watch is at its 50 DMA line ($265.69).
>>> FEATURED STOCK ARTICLE : Pulled Back and Tested Support at 50-Day Moving Average - 7/19/2022 |
View all notes |
Set NEW NOTE alert |
Company Profile |
SEC
News |
Chart |
Request a new note
C
A
S
I |
AN
-
NYSE
Autonation Inc
SPECIALTY RETAIL - Auto Dealerships
|
$123.05
|
+2.20
1.82% |
$125.73
|
656,347
91.03% of 50 DAV
50 DAV is 721,000
|
$133.48
-7.81%
|
7/20/2022
|
$122.03
|
PP = $126.49
|
|
MB = $132.81
|
Most Recent Note - 8/8/2022 5:56:57 PM
Y - Posted a gain backed by near average volume today while challenging previously stubborn resistance in the $126 area. Recent rebound above its 200 DMA line and 50 DMA line ($116.62) helped its outlook to improve. Subsequent volume-driven gains above the pivot point may trigger a technical buy signal. Reported Jun '22 quarterly earnings +34% on -2% sales revenues versus the year ago period. Still faces some resistance due to overhead supply up to the $133 level.
>>> FEATURED STOCK ARTICLE : Autonation Earnings Due While Perched Near Pivot Point - 7/20/2022 |
View all notes |
Set NEW NOTE alert |
Company Profile |
SEC
News |
Chart |
Request a new note
C
A
S
I |
Symbol/Exchange
Company Name
Industry Group |
PRICE |
CHANGE
(%Change) |
Day High |
Volume
(% DAV)
(% 50 day avg vol) |
52 Wk Hi
% From Hi |
Featured
Date |
Price
Featured |
Pivot Featured |
|
Max Buy |
ESQ
-
NASDAQ
Esquire Financial Hldgs
Finance-Commercial Loans
|
$37.94
|
+0.67
1.80% |
$38.27
|
32,376
53.96% of 50 DAV
50 DAV is 60,000
|
$39.09
-2.94%
|
7/26/2022
|
$37.74
|
PP = $39.19
|
|
MB = $41.15
|
Most Recent Note - 8/8/2022 5:59:12 PM
Y - Posted a 4th consecutive gain today challenging previously stubborn resistance in the $39 area. Its 50 DMA line ($35.34) defines important near-term support. Subsequent gains above the pivot point backed by at least +40% above average volume may trigger a technical buy signal.
>>> FEATURED STOCK ARTICLE : Volume Driven Gains Approaching Prior High - 7/26/2022 |
View all notes |
Set NEW NOTE alert |
Company Profile |
SEC
News |
Chart |
Request a new note
C
A
S
I |
GPK
-
NYSE
Graphic Packaging Hldg
CONSUMER NON-DURABLES - Packaging and Containers
|
$22.38
|
+0.68
3.13% |
$22.40
|
3,918,160
137.43% of 50 DAV
50 DAV is 2,851,000
|
$22.99
-2.65%
|
7/26/2022
|
$22.63
|
PP = $23.09
|
|
MB = $24.24
|
Most Recent Note - 8/8/2022 5:54:46 PM
Y - Posted a big gain today with higher volume while approaching its 52-week high. Highlighted in yellow in the 7/26/22 mid-day report with pivot point cited based on its 6/06/22 high plus 10 cents. Subsequent gains above the pivot point backed by at least +40% above average volume are needed to trigger a proper technical buy signal.
>>> FEATURED STOCK ARTICLE : Negative Reversal After Matching 52-Week High - 7/27/2022 |
View all notes |
Set NEW NOTE alert |
Company Profile |
SEC
News |
Chart |
Request a new note
C
A
S
I |
CSL
-
NYSE
Carlisle Cos Inc
Diversified Operations
|
$302.70
|
+2.09
0.70% |
$304.69
|
406,657
108.73% of 50 DAV
50 DAV is 374,000
|
$301.01
0.56%
|
7/28/2022
|
$282.31
|
PP = $275.23
|
|
MB = $288.99
|
Most Recent Note - 8/4/2022 6:45:47 PM
G - Holding its ground stubbornly perched near its all-time high following noted volume-driven gains. Prior highs in the $275 area define initial support to watch on pullbacks.
>>> FEATURED STOCK ARTICLE : Carlisle Perched at All-Time High After Noted Breakout - 8/2/2022 |
View all notes |
Set NEW NOTE alert |
Company Profile |
SEC
News |
Chart |
Request a new note
C
A
S
I |
ENPH
-
NASDAQ
Enphase Energy Inc
Energy-Solar
|
$287.74
|
-13.17
-4.38% |
$308.88
|
4,266,680
132.01% of 50 DAV
50 DAV is 3,232,000
|
$305.88
-5.93%
|
7/28/2022
|
$276.66
|
PP = $282.55
|
|
MB = $296.68
|
Most Recent Note - 8/8/2022 12:45:49 PM
Y - Reversed into the red from an early gain today for a new high after recently wedging higher and near its "max buy" level. The prior high in the $282 area was noted as initial support to watch on pullbacks. Fundamentals remain strong after reporting solid Jun '22 quarterly results, continuing its strong earnings history.
>>> FEATURED STOCK ARTICLE : Pullback Following 3 Consecutive Gains With Heavier Volume - 8/1/2022 |
View all notes |
Set NEW NOTE alert |
Company Profile |
SEC
News |
Chart |
Request a new note
C
A
S
I |
PWR
-
NYSE
Quanta Services Inc
MATERIALS and CONSTRUCTION - General Contractors
|
$137.26
|
+0.35
0.26% |
$139.76
|
1,095,579
70.46% of 50 DAV
50 DAV is 1,555,000
|
$146.84
-6.52%
|
7/28/2022
|
$141.83
|
PP = $140.14
|
|
MB = $147.15
|
Most Recent Note - 8/4/2022 6:52:11 PM
Y - Pulled by today with higher volume for a 5th consecutive loss following a noted "negative reversal" on 7/29/22 at its all-time high. Slumped below its pivot point raising some concerns following the recently noted breakout. Reported Jun '22 quarterly earnings +45% on +41% sales revenues versus the year ago period. Volume and volatility often increase near earnings news.
>>> FEATURED STOCK ARTICLE : Volume-Driven Breakout for Quanta Services - 7/28/2022 |
View all notes |
Set NEW NOTE alert |
Company Profile |
SEC
News |
Chart |
Request a new note
C
A
S
I |
Symbol/Exchange
Company Name
Industry Group |
PRICE |
CHANGE
(%Change) |
Day High |
Volume
(% DAV)
(% 50 day avg vol) |
52 Wk Hi
% From Hi |
Featured
Date |
Price
Featured |
Pivot Featured |
|
Max Buy |
CLFD
-
NASDAQ
Clearfield Inc
TELECOMMUNICATIONS - Cables / Satalite Equipment
|
$110.47
|
-0.68
-0.61% |
$114.73
|
706,646
319.75% of 50 DAV
50 DAV is 221,000
|
$112.73
-2.00%
|
7/29/2022
|
$94.10
|
PP = $86.81
|
|
MB = $91.15
|
Most Recent Note - 8/8/2022 12:41:56 PM
G - Extended from any sound base and powering further into new high territory today with yet another gain backed by above average volume, rallying well above its "max buy" level. Prior high in the $86 area defines initial support to watch on pullbacks. Fundamentals remain strong after it reported Jun '22 quarterly earnings +109% on +84% sales revenues above the year ago period.
>>> FEATURED STOCK ARTICLE : Volume Heavy Behind Technical Breakout - 7/29/2022 |
View all notes |
Set NEW NOTE alert |
Company Profile |
SEC
News |
Chart |
Request a new note
C
A
S
I |
GFF
-
NYSE
Griffon Corporation
MATERIALS and CONSTRUCTION - General Building Materials
|
$32.22
|
+1.46
4.75% |
$32.65
|
669,711
151.86% of 50 DAV
50 DAV is 441,000
|
$31.02
3.87%
|
8/8/2022
|
$32.46
|
PP = $31.12
|
|
MB = $32.68
|
Most Recent Note - 8/8/2022 5:53:48 PM
Y - Finished strong today after highlighted in yellow with pivot point cited based on its 6/07/22 high plus 10 cents in the earlier mid-day report. Hit a new high with today's 4th consecutive gain above the pivot point backed by +52% above average volume triggering a technical buy signal. Reported Jun '22 quarterly earnings +215% on +31% sales revenues versus the year ago period, its 3rd strong quarterly comparison above the +25% minimum guideline (C criteria). Annual earnings (A criteria) growth has been strong and steady. Completed a new Public Offering on 8/17/20. See the latest FSU analysis for more details and a new annotated graph.
>>> FEATURED STOCK ARTICLE : Breakout for New High Backed by +52% Above Average Volume - 8/8/2022 |
View all notes |
Set NEW NOTE alert |
Company Profile |
SEC
News |
Chart |
Request a new note
C
A
S
I |
|
|
|
THESE ARE NOT BUY RECOMMENDATIONS!
Comments contained in the body of this report are technical
opinions only. The material herein has been obtained
from sources believed to be reliable and accurate, however,
its accuracy and completeness cannot be guaranteed.
This site is not an investment advisor, hence it does
not endorse or recommend any securities or other investments.
Any recommendation contained in this report may not
be suitable for all investors and it is not to be deemed
an offer or solicitation on our part with respect to
the purchase or sale of any securities. All trademarks,
service marks and trade names appearing in this report
are the property of their respective owners, and are
likewise used for identification purposes only.
This report is a service available
only to active Paid Premium Members.
You may opt-out of receiving report notifications
at any time. Questions or comments may be submitted
by writing to Premium Membership Services 665 S.E. 10 Street, Suite 201 Deerfield Beach, FL 33441-5634 or by calling 1-800-965-8307
or 954-785-1121.
|
|
|