You are not logged in.
This means you
CAN ONLY VIEW reports that were published prior to Monday, March 3, 2025.
You
MUST UPGRADE YOUR MEMBERSHIP if you want to see any current reports.
AFTER MARKET UPDATE - MONDAY, AUGUST 15TH, 2022
Previous After Market Report Next After Market Report >>>
|
|
|
|
DOW |
+151.39 |
33,912.44 |
+0.45% |
|
Volume |
740,819,795 |
-2% |
|
Volume |
4,420,590,300 |
-7% |
|
NASDAQ |
+80.87 |
13,128.05 |
+0.62% |
|
Advancers |
1,561 |
50% |
|
Advancers |
2,508 |
56% |
|
S&P 500 |
+16.99 |
4,297.14 |
+0.40% |
|
Decliners |
1,543 |
50% |
|
Decliners |
1,987 |
44% |
|
Russell 2000 |
+4.73 |
2,021.35 |
+0.23% |
|
52 Wk Highs |
61 |
|
|
52 Wk Highs |
92 |
|
|
S&P 600 |
+4.60 |
1,292.40 |
+0.36% |
|
52 Wk Lows |
19 |
|
|
52 Wk Lows |
52 |
|
|
 |
Major Indices Rose With Lighter Volume Totals
Kenneth J. Gruneisen - Passed the CAN SLIM® Master's Exam
The Dow rose 151 points, while the S&P 500 gained 0.4%. The Nasdaq Composite added 0.6%. U.S. equities are coming off another positive week, as recent signs of softer inflation buoyed sentiment. The S&P 500 and Nasdaq Composite notched weekly gains of 3.3% and 3.1%, respectively. Both benchmarks capped a four-week winning streak, their best run since November 2021. The volume totals reported were lighter than the prior session on the NYSE and on the Nasdaq exchange, a hint that institutional buying demand was lackluster. Advancers led decliners by a very narrow margin on the NYSE and by a 5-4 margin on the Nasdaq exchange. There were 48 high-ranked companies from the Leaders List that hit new 52-week highs and were listed on the BreakOuts Page, versus the total of 38 on the prior session. New 52-week highs outnumbered new 52-week lows on the NYSE and on the Nasdaq exchange. The market is in a confirmed uptrend (M criteria). Any sustainable rally requires a healthy crop of leading stocks hitting new highs, so the recent improvement in leadership was a reassuring sign.
Chart courtesy of www.stockcharts.com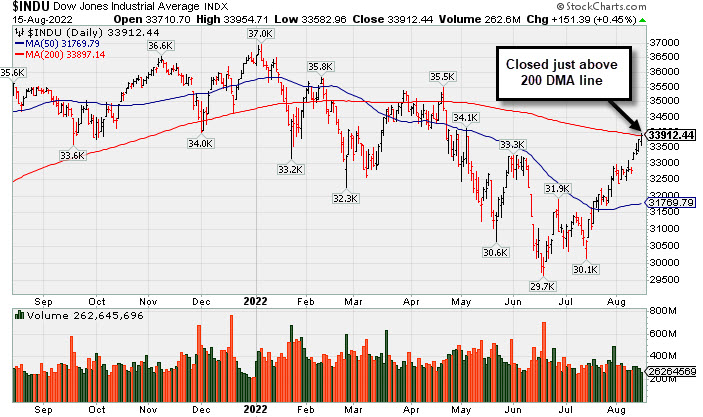 PICTURED: The Dow Jones Industrial Average posted a 4th consecutive gain with lighter volume and closed just above its downward sloping 200 DMA line.
U.S. equities closed higher on Monday despite disappointing updates out of China clouding the outlook for global economic growth. Overseas, the latest reports showed China’s retail sales, investment, and industrial production all fell short of estimates in July, while the nation’s central bank unexpectedly slashed key interest rates. A gauge of the U.S. dollar advanced 0.8% after last week weathering its sharpest five-day decline since May (-1.1%). The stronger greenback and demand concerns pressured oil prices. West Texas Intermediate crude retreated 3.5% to $88.89/barrel after earlier dipping to its lowest point in more than six months.
On the domestic data front, a measure of homebuilder sentiment fell for an eighth straight month to the lowest level since May 2020. Separately, the empire manufacturing survey unexpectedly dipped to -31.3 in August, the second-worst print on record. Treasuries strengthened, with the yield on the 10-year note down four basis points (0.04%) to 2.80%.
Nine of 11 S&P 500 sectors closed in positive territory, with the more traditionally defensive Consumer Staples and Utilities groups pacing gains. Growth-related pockets also outperformed, with Consumer Discretionary and Technology among the standouts. Tomorrow, investors will assess an earnings report from Walmart Inc., (WMT +0.29%) which will be closely scrutinized as it could shed light on several macroeconomic trends.
|
 Kenneth J. Gruneisen started out as a licensed stockbroker in August 1987, a couple of months prior to the historic stock market crash that took the Dow Jones Industrial Average down -22.6% in a single day. He has published daily fact-based fundamental and technical analysis on high-ranked stocks online for two decades. Through FACTBASEDINVESTING.COM, Kenneth provides educational articles, news, market commentary, and other information regarding proven investment systems that work in good times and bad.
Comments contained in the body of this report are technical opinions only and are not necessarily those of Gruneisen Growth Corp. The material herein has been obtained from sources believed to be reliable and accurate, however, its accuracy and completeness cannot be guaranteed. Our firm, employees, and customers may effect transactions, including transactions contrary to any recommendation herein, or have positions in the securities mentioned herein or options with respect thereto. Any recommendation contained in this report may not be suitable for all investors and it is not to be deemed an offer or solicitation on our part with respect to the purchase or sale of any securities. |
|
 |
Broker/Dealer and Tech Indexes Rose; Commodity-Linked Groups Fell
Kenneth J. Gruneisen - Passed the CAN SLIM® Master's Exam
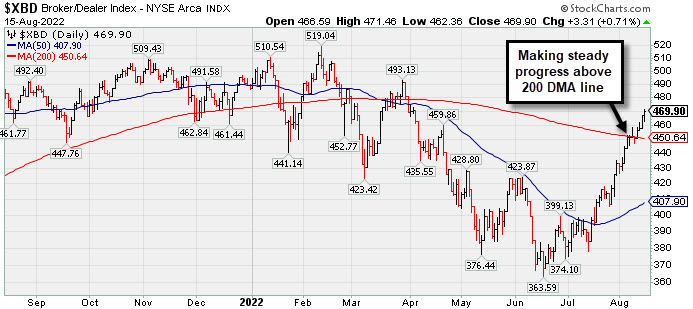
The Broker/Dealer Index ($XBD +0.71%) posted a modest gain while the Retail Index ($RLX -0.06%) finished flat and the Bank Index ($BKX -0.20%) inched lower. The tech sector had a positive bias as the Biotech Index ($BTK +1.19%) led the Networking Index ($NWX +0.80%) and Semiconductor Index ($SOX +0.31%). Meanwhile, commodity-linked groups had a negative bias as the Oil Services Index ($OSX -3.25%), Integrated Oil Index ($XOI -2.31%), and Gold & Silver Index ($XAU -1.86%) each lost ground.
PICTURED: The Broker/Dealer Index ($XBD +0.71%) posted a 4th consecutive gain, making steady progress since rising above its downward sloping 200-day moving average (DMA) line.
| Oil Services |
$OSX |
67.21 |
-2.26 |
-3.25% |
+27.49% |
| Integrated Oil |
$XOI |
1,579.62 |
-37.27 |
-2.31% |
+34.07% |
| Semiconductor |
$SOX |
3,077.33 |
+9.49 |
+0.31% |
-22.02% |
| Networking |
$NWX |
845.73 |
+6.69 |
+0.80% |
-12.91% |
| Broker/Dealer |
$XBD |
469.90 |
+3.31 |
+0.71% |
-3.48% |
| Retail |
$RLX |
3,562.50 |
-2.04 |
-0.06% |
-15.71% |
| Gold & Silver |
$XAU |
109.54 |
-2.08 |
-1.86% |
-17.30% |
| Bank |
$BKX |
114.63 |
-0.23 |
-0.20% |
-13.30% |
| Biotech |
$BTK |
5,111.95 |
+60.32 |
+1.19% |
-7.37% |
|
|
|
 |
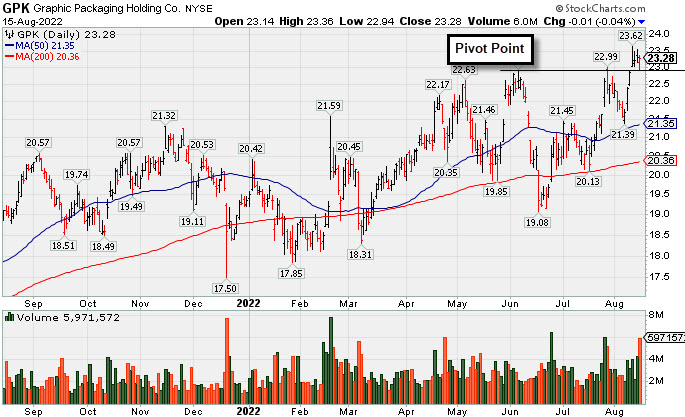
Churned Heavy Volume Perched at High After 6 Straight Gains
Kenneth J. Gruneisen - Passed the CAN SLIM® Master's Exam
Graphic Packaging Hldg (GPK -$0.01 or -0.04% to $23.28) paused today at its 52-week high after posting 6 consecutive gains as it rose above the pivot point triggering a technical buy signal. It was highlighted in yellow in the 7/26/22 mid-day report with pivot point cited based on its 6/06/22 high plus 10 cents (read here). However, it has made very little headway since last shown in this FSU section on 7/27/22 with an annotated graph under the headline, "Negative Reversal After Matching 52-Week High".
GPK has a 98 Earnings Per Share Rating. Earnings rose +108% on +36% sales revenues for the Jun '22 quarter versus the year ago period. Three of the past 4 quarterly comparisons were above the +25% minimum earnings guideline (C criteria). Its annual earnings history has been good since a downturn in FY '16 and '17, meeting the fact-based investment system's fundamental guidelines (A criteria).
The Paper & Paper Products group is ranked 51st on the 197 Industry Groups list and it has a B+ Group Relative Strength Rating (L criteria). The number of top-rated funds owning its shares rose from 596 in Sep '21 to 636 in Jun '22, a reassuring sign concerning the I criteria. Its current Up/Down Volume Ratio of 1.5 is an unbiased indication its shares have been under accumulation over the past 50 days.
|
|
|
Color Codes Explained :
Y - Better candidates highlighted by our
staff of experts.
G - Previously featured
in past reports as yellow but may no longer be buyable under the
guidelines.
***Last / Change / Volume data in this table is the closing quote data***
Symbol/Exchange
Company Name
Industry Group |
PRICE |
CHANGE
(%Change) |
Day High |
Volume
(% DAV)
(% 50 day avg vol) |
52 Wk Hi
% From Hi |
Featured
Date |
Price
Featured |
Pivot Featured |
|
Max Buy |
 IMXI
-
NASDAQ
IMXI
-
NASDAQ
International Money Exp
Financial Svcs-Specialty
|
$24.90
|
+0.37
1.51% |
$25.05
|
315,231
62.42% of 50 DAV
50 DAV is 505,000
|
$26.11
-4.63%
|
7/1/2022
|
$21.27
|
PP = $21.38
|
|
MB = $22.45
|
Most Recent Note - 8/11/2022 7:09:03 PM
G - Pulled back today for a 2nd volume-driven loss in the span of 3 sessions off its all-time high. Prior highs in the $22 area and its 50 DMA line ($21.89) define important near-term support to watch. Reported Jun '22 quarterly earnings +21% on +17% sales revenues versus the year ago period, below the +25% minimum earnings guideline (C criteria).
>>> FEATURED STOCK ARTICLE : Finished Strong With Another Volume-Driven Gain After Earnings - 8/3/2022 |
View all notes |
Set NEW NOTE alert |
Company Profile |
SEC
News |
Chart |
Request a new note
C
A
S
I |
HRMY
-
NASDAQ
Harmony Biosciences Holdings
Medical-Biomed/Biotech
|
$50.90
|
-1.25
-2.40% |
$52.22
|
538,048
95.91% of 50 DAV
50 DAV is 561,000
|
$57.13
-10.90%
|
7/6/2022
|
$54.12
|
PP = $52.85
|
|
MB = $55.49
|
 Most Recent Note - 8/15/2022 5:29:19 PM
Y - Pulled back today with near average volume. Recently finding support near its 50 DMA line ($50.40) and prior low ($48.85). More damaging losses would raise concerns and trigger technical sell signals. Challenged its all-time high but met stubborn resistance in the $57 area after reporting Jun '22 quarterly earnings +54% on +45% sales revenues versus the year ago period.
>>> FEATURED STOCK ARTICLE : Churning Higher Volume While Perched Near High After Earnings News - 8/4/2022 |
View all notes |
Set NEW NOTE alert |
Company Profile |
SEC
News |
Chart |
Request a new note
C
A
S
I |
CI
-
NYSE
Cigna Corp
Medical-Managed Care
|
$290.87
|
-0.05
-0.02% |
$293.50
|
1,054,940
51.26% of 50 DAV
50 DAV is 2,058,000
|
$289.63
0.43%
|
7/7/2022
|
$276.55
|
PP = $273.68
|
|
MB = $287.36
|
Most Recent Note - 8/12/2022 12:08:54 PM
G - Wedging higher for another new all-time high and its color code is changed to green after rising above its "max buy" level. Reported earnings for the Jun '22 quarter rose +19% on +5% sales revenues versus the year ago period, breaking a streak of 3 quarterly earnings increases above the +25% minimum guideline (C criteria), raising concerns. Near-term support to watch is at its 50 DMA line ($267.77).
>>> FEATURED STOCK ARTICLE : Wedging Higher With Lighter Volume Behind Gain for New High - 8/9/2022 |
View all notes |
Set NEW NOTE alert |
Company Profile |
SEC
News |
Chart |
Request a new note
C
A
S
I |
AN
-
NYSE
Autonation Inc
SPECIALTY RETAIL - Auto Dealerships
|
$123.52
|
-1.19
-0.95% |
$124.63
|
340,713
48.49% of 50 DAV
50 DAV is 702,600
|
$133.46
-7.45%
|
7/20/2022
|
$122.03
|
PP = $126.49
|
|
MB = $132.81
|
Most Recent Note - 8/11/2022 7:00:21 PM
Y - Posted a gain backed by near average volume today but ended near the session low after challenging previously stubborn resistance in the $126 area. Subsequent volume-driven gains above the pivot point may trigger a technical buy signal. Reported Jun '22 quarterly earnings +34% on -2% sales revenues versus the year ago period. Still faces some resistance due to overhead supply up to the $133 level. See the latest FSU analysis for more details and a new annotated graph.
>>> FEATURED STOCK ARTICLE : Autonation Hovering Near Stubborn Resistance - 8/11/2022 |
View all notes |
Set NEW NOTE alert |
Company Profile |
SEC
News |
Chart |
Request a new note
C
A
S
I |
ESQ
-
NASDAQ
Esquire Financial Hldgs
Finance-Commercial Loans
|
$40.25
|
+0.45
1.13% |
$40.34
|
30,465
51.64% of 50 DAV
50 DAV is 59,000
|
$39.50
1.90%
|
7/26/2022
|
$37.74
|
PP = $39.19
|
|
MB = $41.15
|
Most Recent Note - 8/12/2022 5:16:05 PM
Y - Hit a new all-time high and closed at the session high today, clearing stubborn resistance in the $39 area. Confirming gains above the pivot point backed by at least +40% above average volume may help clinch a proper technical buy signal. Its 50 DMA line ($35.43) defines important near-term support. See the latest FSU analysis for more details and a new annotated graph.
>>> FEATURED STOCK ARTICLE : Closed at Session High With Gain for New All-Time High - 8/12/2022 |
View all notes |
Set NEW NOTE alert |
Company Profile |
SEC
News |
Chart |
Request a new note
C
A
S
I |
Symbol/Exchange
Company Name
Industry Group |
PRICE |
CHANGE
(%Change) |
Day High |
Volume
(% DAV)
(% 50 day avg vol) |
52 Wk Hi
% From Hi |
Featured
Date |
Price
Featured |
Pivot Featured |
|
Max Buy |
GPK
-
NYSE
Graphic Packaging Hldg
CONSUMER NON-DURABLES - Packaging and Containers
|
$23.28
|
-0.01
-0.04% |
$23.36
|
5,971,887
205.15% of 50 DAV
50 DAV is 2,911,000
|
$23.63
-1.48%
|
7/26/2022
|
$22.63
|
PP = $23.09
|
|
MB = $24.24
|
Most Recent Note - 8/15/2022 5:23:09 PM
Y - Churned heavy volume as it paused today after a streak of 6 consecutive gains for new 52-week highs triggered a technical buy signal. See the latest FSU analysis for more details and a new annotated graph.
>>> FEATURED STOCK ARTICLE : Churned Heavy Volume Perched at High After 6 Straight Gains - 8/15/2022 |
View all notes |
Set NEW NOTE alert |
Company Profile |
SEC
News |
Chart |
Request a new note
C
A
S
I |
CSL
-
NYSE
Carlisle Cos Inc
Diversified Operations
|
$316.14
|
+3.63
1.16% |
$317.33
|
479,633
123.62% of 50 DAV
50 DAV is 388,000
|
$315.00
0.36%
|
7/28/2022
|
$282.31
|
PP = $275.23
|
|
MB = $288.99
|
Most Recent Note - 8/15/2022 5:25:11 PM
G - Hit yet another new all-time high with today's 4th consecutive volume-driven gain, getting very extended from the previously noted base. Prior highs in the $275 area define initial support to watch on pullbacks.
>>> FEATURED STOCK ARTICLE : Carlisle Perched at All-Time High After Noted Breakout - 8/2/2022 |
View all notes |
Set NEW NOTE alert |
Company Profile |
SEC
News |
Chart |
Request a new note
C
A
S
I |
ENPH
-
NASDAQ
Enphase Energy Inc
Energy-Solar
|
$301.13
|
+1.87
0.62% |
$306.50
|
2,485,622
74.11% of 50 DAV
50 DAV is 3,354,000
|
$308.88
-2.51%
|
7/28/2022
|
$276.66
|
PP = $282.55
|
|
MB = $296.68
|
Most Recent Note - 8/12/2022 5:20:51 PM
G - Posted another gain today with below average volume, and its color code is changed to green after rising above its "max buy" level. The prior high in the $282 area has been noted as initial support to watch on pullbacks. Fundamentals remain strong.
>>> FEATURED STOCK ARTICLE : Pullback Following 3 Consecutive Gains With Heavier Volume - 8/1/2022 |
View all notes |
Set NEW NOTE alert |
Company Profile |
SEC
News |
Chart |
Request a new note
C
A
S
I |
PWR
-
NYSE
Quanta Services Inc
MATERIALS and CONSTRUCTION - General Contractors
|
$142.97
|
-0.49
-0.34% |
$143.46
|
624,729
47.40% of 50 DAV
50 DAV is 1,318,000
|
$146.84
-2.64%
|
7/28/2022
|
$141.83
|
PP = $140.14
|
|
MB = $147.15
|
Most Recent Note - 8/15/2022 5:27:56 PM
Y - Volume totals have been below average while recently wedging back above its pivot point since encountering some distributional pressure. Confirming volume-driven gains for new highs would be a reassuring sign of serious institutional buying demand. Fundamentals remain strong.
>>> FEATURED STOCK ARTICLE : Volume-Driven Breakout for Quanta Services - 7/28/2022 |
View all notes |
Set NEW NOTE alert |
Company Profile |
SEC
News |
Chart |
Request a new note
C
A
S
I |
CLFD
-
NASDAQ
Clearfield Inc
TELECOMMUNICATIONS - Cables / Satalite Equipment
|
$120.86
|
+2.62
2.22% |
$121.88
|
352,014
112.83% of 50 DAV
50 DAV is 312,000
|
$119.97
0.74%
|
7/29/2022
|
$94.10
|
PP = $86.81
|
|
MB = $91.15
|
Most Recent Note - 8/15/2022 5:30:19 PM
G - Posted another gain today with slightly above average volume for a new all-time high. Prior high in the $86 area defines initial support to watch on pullbacks. Fundamentals remain strong.
>>> FEATURED STOCK ARTICLE : Volume Heavy Behind Technical Breakout - 7/29/2022 |
View all notes |
Set NEW NOTE alert |
Company Profile |
SEC
News |
Chart |
Request a new note
C
A
S
I |
Symbol/Exchange
Company Name
Industry Group |
PRICE |
CHANGE
(%Change) |
Day High |
Volume
(% DAV)
(% 50 day avg vol) |
52 Wk Hi
% From Hi |
Featured
Date |
Price
Featured |
Pivot Featured |
|
Max Buy |
GFF
-
NYSE
Griffon Corporation
MATERIALS and CONSTRUCTION - General Building Materials
|
$33.41
|
-0.10
-0.30% |
$33.60
|
356,433
78.68% of 50 DAV
50 DAV is 453,000
|
$34.35
-2.74%
|
8/8/2022
|
$32.46
|
PP = $31.12
|
|
MB = $32.68
|
Most Recent Note - 8/11/2022 7:12:57 PM
G - Hit yet another new high with today's gain backed by near average volume, getting extended from the previously noted base. Prior highs in the $31 area define initial support to watch on pullbacks.
>>> FEATURED STOCK ARTICLE : Breakout for New High Backed by +52% Above Average Volume - 8/8/2022 |
View all notes |
Set NEW NOTE alert |
Company Profile |
SEC
News |
Chart |
Request a new note
C
A
S
I |
CLH
-
NYSE
Clean Harbors Inc
Pollution Control
|
$116.33
|
-2.46
-2.07% |
$118.33
|
337,039
106.32% of 50 DAV
50 DAV is 317,000
|
$118.89
-2.15%
|
8/10/2022
|
$111.78
|
PP = $115.10
|
|
MB = $120.86
|
Most Recent Note - 8/15/2022 5:33:20 PM
Y - Pulled back today with average volume. Prior gain and strong close above the pivot point backed by +116% above average volume triggered a technical buy signal. No resistance remains due to overhead supply. Fundamentals remain strong.
>>> FEATURED STOCK ARTICLE : Pollution Control Firm Perched Near Prior High - 8/10/2022 |
View all notes |
Set NEW NOTE alert |
Company Profile |
SEC
News |
Chart |
Request a new note
C
A
S
I |
|
|
|
THESE ARE NOT BUY RECOMMENDATIONS!
Comments contained in the body of this report are technical
opinions only. The material herein has been obtained
from sources believed to be reliable and accurate, however,
its accuracy and completeness cannot be guaranteed.
This site is not an investment advisor, hence it does
not endorse or recommend any securities or other investments.
Any recommendation contained in this report may not
be suitable for all investors and it is not to be deemed
an offer or solicitation on our part with respect to
the purchase or sale of any securities. All trademarks,
service marks and trade names appearing in this report
are the property of their respective owners, and are
likewise used for identification purposes only.
This report is a service available
only to active Paid Premium Members.
You may opt-out of receiving report notifications
at any time. Questions or comments may be submitted
by writing to Premium Membership Services 665 S.E. 10 Street, Suite 201 Deerfield Beach, FL 33441-5634 or by calling 1-800-965-8307
or 954-785-1121.
|
|
|