Recent Technical Weakness Hurt Outlook - Wednesday, August 15, 2018
Big Loss on Heavy Volume Tests 50-Day Moving Average - Thursday, June 21, 2018
Volume-Driven Gain For New High - Friday, May 4, 2018
Halted Slide Above 200 DMA Line, But Additional Rebound Needed - Tuesday, November 28, 2017
Perched Near Record High Ahead of Earnings News - Wednesday, November 1, 2017
Perched Near Pivot Point With No Resistance Remaining - Wednesday, October 4, 2017
New Base Being Built After Considerable Gap Higher - Monday, September 11, 2017
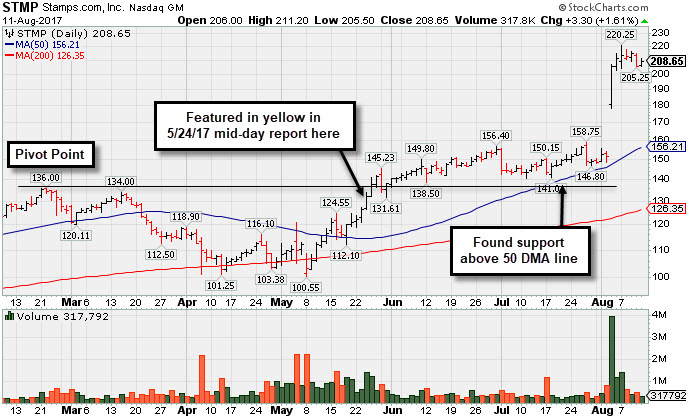
Blasted Higher After Latest Strong Earnings Report - Friday, August 11, 2017
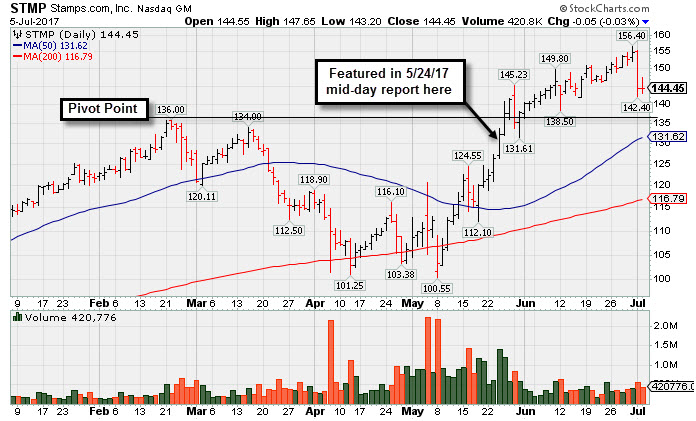
Pulling Back After Getting Extended From Prior Base - Wednesday, July 5, 2017
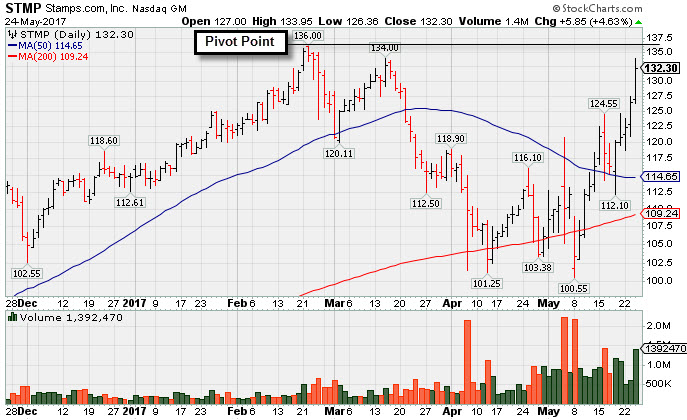
Rallying From Bottom of 13-Week Cup Shaped Base - Wednesday, May 24, 2017
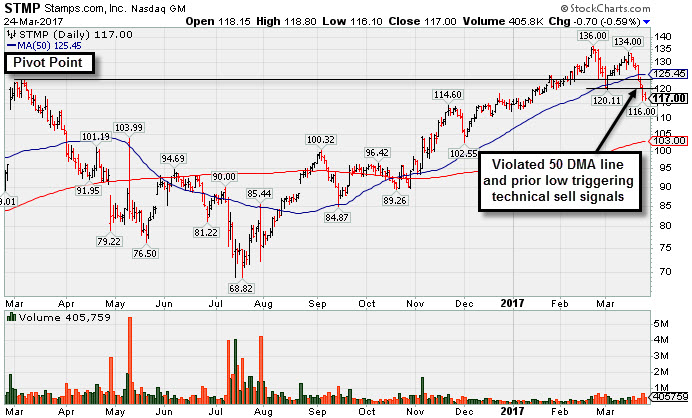
Technical Deterioration Noted After 50-Day Moving Average Violation - Friday, March 24, 2017
Recent Gains Have Lacked Heavy Volume Indicative of Accumulation - Thursday, February 16, 2017
Violation of 50-Day Moving Average and Prior Lows Triggered Sell Signal - Wednesday, January 13, 2016
Consolidation Was Brief Following Prior Breakaway Gap - Monday, December 28, 2015
Perched Near 52-Week High After More Bullish Action - Friday, December 11, 2015
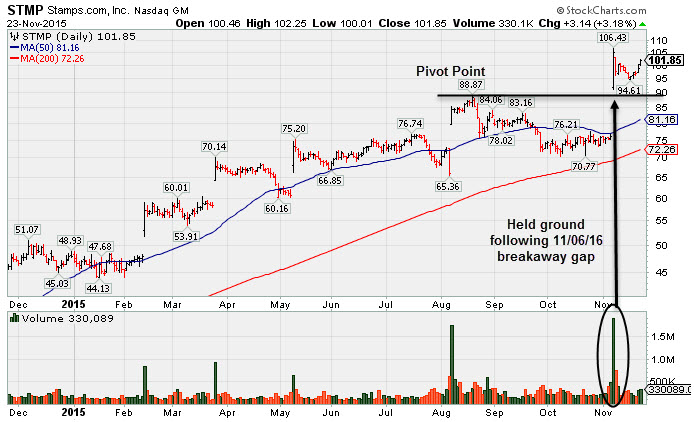
Volume-Driven Gain For Second Best Close - Monday, November 23, 2015
Big Breakaway Gap With Heavy Volume Following Earnings News - Friday, November 6, 2015
Upward Trendline and 50-Day Average Define Important Near-Term Support - Monday, December 02, 2013
Fundamental Flaw May Prompt Disciplined Investors to Look Elsewhere - Thursday, October 31, 2013
Forming New Set-Up After 50-Day Average Acted as Support - Tuesday, September 24, 2013
Stalled Following Gap Up Gain To New High - Friday, August 23, 2013
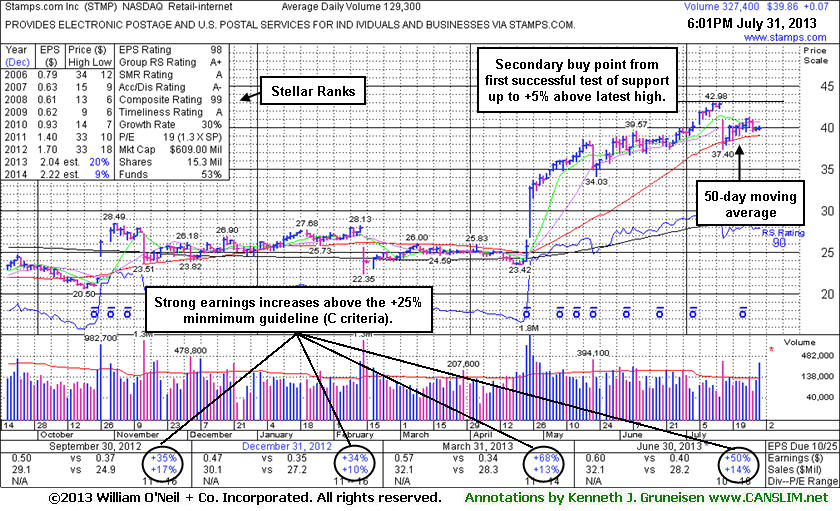
Following Test of Support Secondary Buy Point Exists - Wednesday, July 31, 2013
Confirming Gains Still Needed to Clinch Buy Signal - Tuesday, February 07, 2012
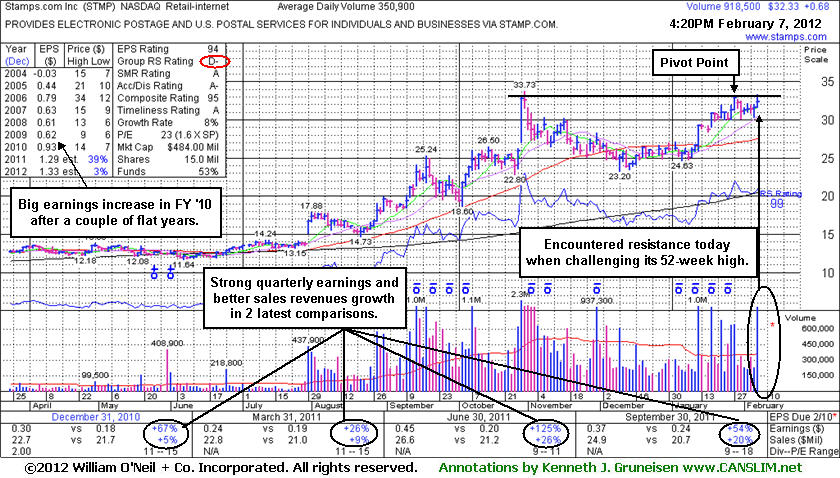
Recent Technical Weakness Hurt Outlook - Wednesday, August 15, 2018
Stamps.Com Inc (STMP -$4.80 or -2.03% to $232.15) suffered a 3rd consecutive loss today. Weakness last week was noted as it triggered a technical sell signal and nearly tested its 200-day moving average (DMA) line ($218) before rebounding. It will be dropped from the Featured Stocks list tonight. A subsequent rebound above the 50 DMA line ($264.71) is needed for its outlook to improve.
Reported Jun '18 quarterly earnings +32% on +20% sales revenues, continuing its strong earnings history. It recently met resistance near the prior high and was last shown in this FSU section with an annotated graph on 6/21/18 under the headline, "Big Loss on Heavy Volume Tests 50-Day Moving Average". STMP was highlighted in yellow with pivot point cited based on its 10/26/17 high plus 10 cents in the 5/04/18 mid-day report (read here).
Stamps.Com has earned an Earnings Per Share Rating of 95. Currently it has a Timeliness Rating of A and a Sponsorship rating of B. The Retail - Internet group now has a 91 Relative Strength Rating. The number of top-rated funds owning its shares rose from 385 in Jun '17 to 469 in Jun '18, a reassuring sign in recent months concerning the I criteria. Its current Up/Down Volume ratio of 0.8 is an unbiased indication its shares have been under distributional pressure over the past 50 days. Its small supply of only 17.9 million shares outstanding (S criteria) can contribute to greater price volatility in the event of institutional buying or selling.
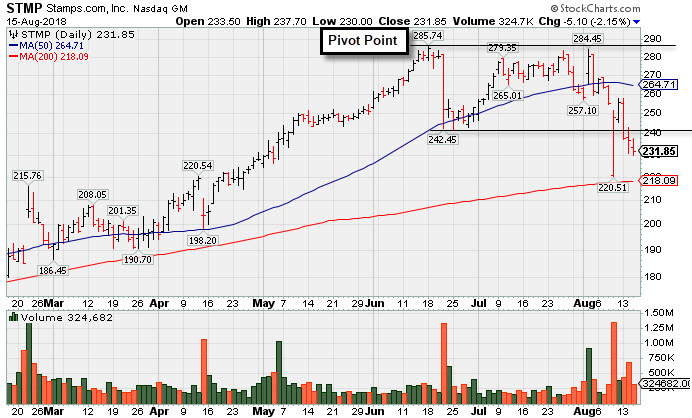
Big Loss on Heavy Volume Tests 50-Day Moving Average - Thursday, June 21, 2018
Stamps.Com Inc (STMP -$28.45 or -10.15% to $251.85) was down considerably with heavy volume behind a big loss today testing its 50-day moving average (DMA) line ($245). More damaging losses below the 50 DMA line would raise greater concerns and trigger a technical sell signal. Prior highs in the $233 area define support to watch.
STMP finished strong after highlighted yellow with pivot point cited based on its 10/26/17 high plus 10 cents in the 5/04/18 mid-day report (read here). It was last shown in this FSU section with an annotated graph on 5/04/18 under the headline, "Volume-Driven Gain For New High".
Fundamentals remain strong after it reported earnings +39% on +27% sales revenues for the Mar '18 quarter. It has earned an Earnings Per Share Rating of 98, putting it in the top 2% of all publicly traded stocks based on its earnings history over the past 5 years. Currently it has a Timeliness Rating of A and a Sponsorship rating of B.
The Retail - Internet group now has a 97 Relative Strength Rating. The number of top-rated funds owning its shares rose from 385 in Jun '17 to 425 in Mar '18, a reassuring sign in recent months concerning the I criteria. Its current Up/Down Volume ratio of 2.6 is an unbiased indication its shares have been under accumulation over the past 50 days. Its small supply of only 17.9 million shares outstanding (S criteria) can contribute to greater price volatility in the event of institutional buying or selling.
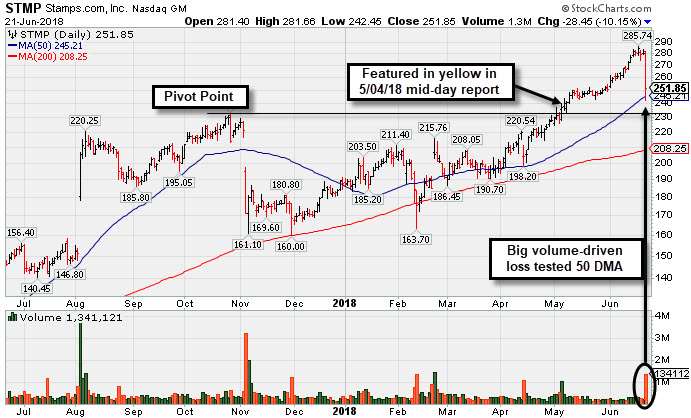
Volume-Driven Gain For New High - Friday, May 4, 2018
Stamps.Com Inc's (STMP +$8.95 or +3.92% to $237.30) finished strong after highlighted yellow with new pivot point cited based on its 10/26/17 high plus 10 cents in the earlier mid-day report (read here). It clawed into new all-time high territory with above average volume behind gains this week, and today's gain had +203% above average volume. Fundamentals remain strong after it reported earnings +39% on +27% sales revenues for the Mar '18 quarter. It has earned an Earnings Per Share Rating of 99, putting it in the top 1% of all publicly traded stocks based on its earnings history over the past 5 years. Currently it has a Timeliness Rating of A and a Sponsorship rating of B.
It found support at its 200-day moving average (DMA) line after dropped from the Featured Stocks list on 11/30/17. Its Relative Strength rating has improved to 92. It was last shown in this FSU section with an annotated graph on 11/28/17 under the headline, "Halted Slide Above 200 DMA Line, But Additional Rebound Needed".
The Retail - Internet group now has a 94 Relative Strength Rating. The number of top-rated funds owning its shares rose from 385 in Jun '17 to 414 in Mar '18, a reassuring sign in recent months concerning the I criteria. Its current Up/Down Volume ratio of 1.8 is an unbiased indication its shares have been under accumulation over the past 50 days. Its small supply of only 17.6 million shares outstanding (S criteria) can contribute to greater price volatility in the event of institutional buying or selling.
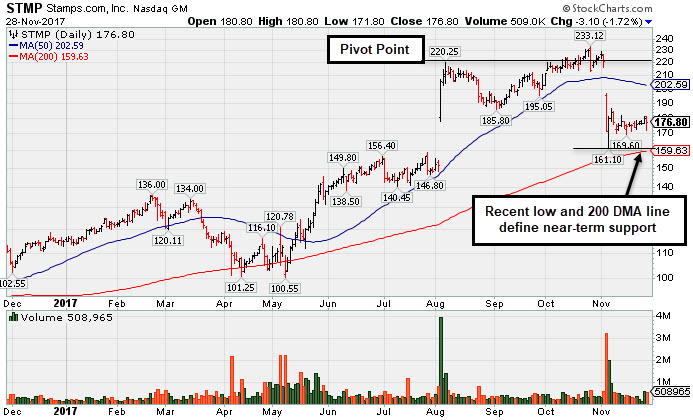
Halted Slide Above 200 DMA Line, But Additional Rebound Needed - Tuesday, November 28, 2017
Stamps.Com Inc's (STMP -$3.10 or -1.72% to 176.80) Relative Strength rating has slumped to 83. It has been holding its ground above its 200-day moving average (DMA) line ($159) since a gap down on 11/03/17 for a damaging volume-driven loss. A rebound above the 50 DMA line ($202.59) is needed for its outlook to improve.
A "negative reversal" and big loss on 10/26/17 with higher volume was noted after hitting an all-time high. The damaging loss had it falling back into the prior base, raising concerns soon after a volume-driven gain above the pivot point on 10/24/17 had triggered a new (or add-on) technical buy signal. The pivot point cited was based on its 8/07/17 high plus 10 cents. It was last shown in this FSU section with an annotated graph on 11/01/17 under the headline, "Perched Near Record High Ahead of Earnings News".
Fundamentals remain strong after strong Sep '17 quarterly earnings and sales increases versus the year-ago period. It has earned an Earnings Per Share Rating of 99, putting it in the top 1% of all publicly traded stocks based on its earnings history over the past 5 years. Currently it has a Timeliness Rating of B and a Sponsorship rating of B.
The Retail - Internet group now has a 77 Relative Strength Rating. The number of top-rated funds owning its shares rose from 354 in Dec '16 to 413 in Sep '17, a reassuring sign in recent months concerning the I criteria. Its current Up/Down Volume ratio of 1.4 is an unbiased indication its shares have been under accumulation over the past 50 days. Its small supply of only 17.5 million shares outstanding (S criteria) can contribute to greater price volatility in the event of institutional buying or selling.
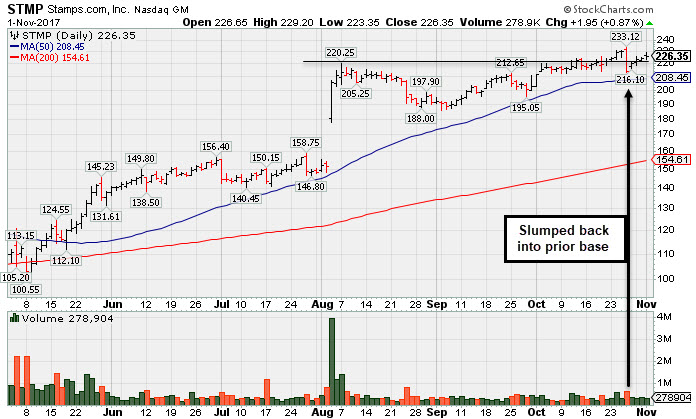
Perched Near Record High Ahead of Earnings News - Wednesday, November 1, 2017
Stamps.Com Inc (STMP +$1.95 or +0.87% to $226.35) has posted 4 consecutive gains with light volume since its "negative reversal" and big loss on 10/26/17 with higher volume after hitting an all-time high. The damaging loss had it falling back into the prior base, raising concerns. Its 50-day moving average (DMA) line ($208.45) defines important near-term support above the recent low ($195.05 on 9/28/17). Subsequent losses leading to violations would trigger technical sell signals. Keep in mind it is due to report Sep '17 quarterly results after the close on Thursday, November 2nd. Volume and volatility often increase near earnings news.
A volume-driven gain above the pivot point on 10/24/17 triggered a new (or add-on) technical buy signal. The pivot point cited was based on its 8/07/17 high plus 10 cents. It faces no near-term resistance, and it was last shown in this FSU section with an annotated graph on 10/04/17 under the headline, "Perched Near Pivot Point With No Resistance Remaining".
Fundamentals remain strong. It has earned an Earnings Per Share Rating of 99, putting it in the top 1% of all publicly traded stocks based on its earnings history over the past 5 years. Currently it has a Timeliness Rating of A and a Sponsorship rating of B.
The Retail - Internet group has an 81 Relative Strength Rating. The number of top-rated funds owning its shares rose from 354 in Dec '16 to 401 in Sep '17, a reassuring sign in recent months concerning the I criteria. Its current Up/Down Volume ratio of 1.6 is an unbiased indication its shares have been under accumulation over the past 50 days. Its small supply of only 16.9 million shares outstanding (S criteria) can contribute to greater price volatility in the event of institutional buying or selling.
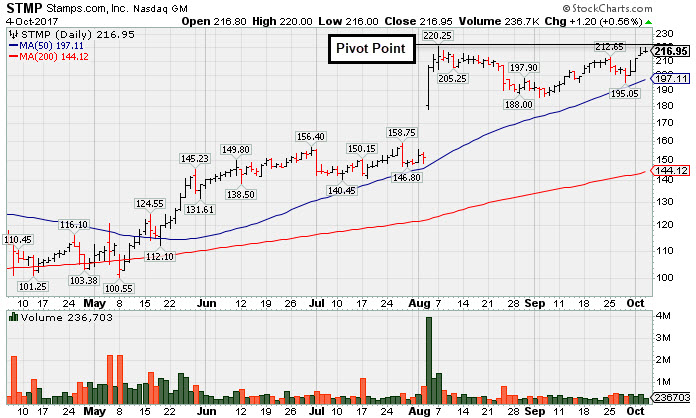
Perched Near Pivot Point With No Resistance Remaining - Wednesday, October 4, 2017
Stamps.Com Inc (STMP +$1.20 or +0.56% to $216.95) posted a 4th consecutive gain today with light volume, rising toward the new pivot point cited based on its 8/07/17 high plus 10 cents. It faces very little near-term resistance. Subsequent volume-driven gains above the pivot point are needed to trigger a new (or add-on) technical buy signal. The recent low ($185.80 on 9/05/17) and its 50-day moving average (DMA) line ($197) define important near-term support where violations would trigger technical sell signals.
There was a considerable gap higher on 8/03/17 following strong earnings news as it reported Jun '17 quarterly earnings +61% on +38% sales revenues. Bullish action has continued since last shown in this FSU section with an annotated graph on 9/11/17 under the headline, "New Base Being Built After Considerable Gap Higher".
Fundamentals remain strong. It has earned an Earnings Per Share Rating of 99, putting it in the top 1% of all publicly traded stocks based on its earnings history over the past 5 years. Currently it has a Timeliness Rating of A and a Sponsorship rating of B.
The Retail - Internet group has a 90 Relative Strength Rating. The number of top-rated funds owning its shares rose from 354 in Dec '16 to 399 in Jun '17, a reassuring sign in recent months concerning the I criteria. Its current Up/Down Volume ratio of 2.1 is an unbiased indication its shares have been under accumulation over the past 50 days. Its small supply of only 16.9 million shares outstanding (S criteria) can contribute to greater price volatility in the event of institutional buying or selling.
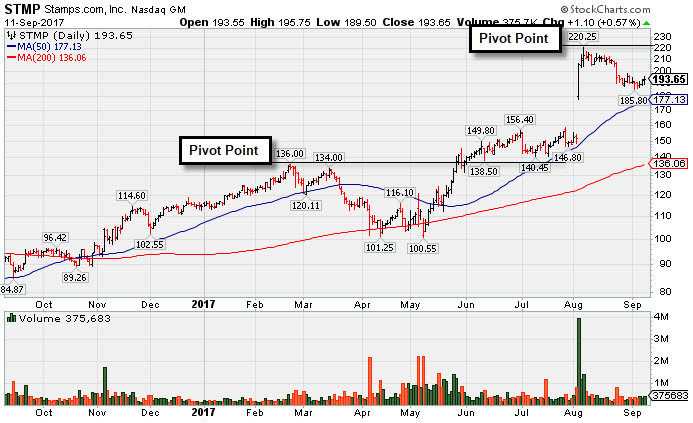
New Base Being Built After Considerable Gap Higher - Monday, September 11, 2017
Stamps.Com Inc (STMP +$1.10 or +0.57% to $193.65) has formed some of tight consolidations while its 50-day moving average (DMA) line ($177) has been catching up. A new pivot point is cited based on its 8/07/17 high plus 10 cents, as it is building on flat base of sufficient length to be valid. It faces some near-term resistance. Subsequent volume-driven gains above the pivot point are needed to trigger a new (or add-on) technical buy signal. The 50 DMA line defines near-term support well above prior highs in the $156 area.
Fundamentals remain strong. There was a considerable gap higher on 8/03/17 following strong earnings news as it reported Jun '17 quarterly earnings +61% on +38% sales revenues. The bullish action was last shown in this FSU section with an annotated graph on 8/11/17 under the headline, "Blasted Higher After Latest Strong Earnings Report".
It has earned an Earnings Per Share Rating of 99, putting it in the top 1% of all publicly traded stocks based on its earnings history over the past 5 years. Currently it has a Timeliness Rating of A and a Sponsorship rating of B.
The Retail - Internet group has a 98 Relative Strength Rating.The number of top-rated funds owning its shares rose from 354 in Dec '16 to 392 in Jun '17, a reassuring sign in recent months concerning the I criteria. Its current Up/Down Volume ratio of 1.4 is an unbiased indication its shares have been under accumulation over the past 50 days. Its small supply of only 16.9 million shares outstanding (S criteria) can contribute to greater price volatility in the event of institutional buying or selling.
Blasted Higher After Latest Strong Earnings Report - Friday, August 11, 2017
Stamps.Com Inc (STMP +$3.30 or +1.61% to $208.65) is holding its ground after gapping up on 8/03/17 and rallying further with a spurt of heavy volume gains. It had not formed a new base of sufficient length prior the considerable gap higher following strong earnings news as it reported Jun '17 quarterly earnings +61% on +38% sales revenues. Its 50-day moving average (DMA) line coincides with prior highs in the $156 area defining important near-term support.
STMP was last shown in this FSU section with an annotated graph on 7/05/17 under the headline, "Pulling Back After Getting Extended From Prior Base". It was highlighted in yellow in the 5/24/17 mid-day report (read here) while rallying near prior highs. A new pivot point was cited based on its 2/22/17 high plus 10 cents. Volume-driven gains for new highs triggered a technical buy signal.
Fundamentals remain strong as its strong growth track record continues. It has earned an Earnings Per Share Rating of 99, putting it in the top 1% of all publicly traded stocks based on its earnings history over the past 5 years. Currently it has a Timeliness Rating of A and a Sponsorship rating of B.
The Retail - Internet group has a 98 Relative Strength Rating.The number of top-rated funds owning its shares rose from 354 in Dec '16 to 389 in Jun '17, a reassuring sign in recent months concerning the I criteria. Its current Up/Down Volume ratio of 1.7 is an unbiased indication its shares have been under accumulation over the past 50 days. Its small supply of only 16.9 million shares outstanding (S criteria) can contribute to greater price volatility in the event of institutional buying or selling.
Pulling Back After Getting Extended From Prior Base - Wednesday, July 5, 2017
Stamps.Com Inc (STMP -$0.05 or -0.03% to $144.45) abruptly retreated from its 52-week high with a big loss on the prior session. It is extended from the prior base and it wedged higher with recent gains lacking great volume conviction. The prior high ($136 on 2/22/17) defines near term support above its 50-day moving average DMA line ($131.63).
STMP was last shown in this FSU section with an annotated graph on 5/24/17 under the headline, "Rallying From Bottom of 13-Week Cup Shaped Base". It was highlighted in yellow in the 5/24/17 mid-day report (read here) while rallying near prior highs. A new pivot point was cited based on its 2/22/17 high plus 10 cents. Volume-driven gains for new highs triggered a technical buy signal.
It reported earnings +62% on +28% sales revenues for the Mar '17 quarter, continuing its strong growth track record. It has earned an Earnings Per Share Rating of 99, putting it in the top 1% of all publicly traded stocks based on its earnings history over the past 5 years. Currently it has a Timeliness Rating of A and a Sponsorship rating of C.
The Retail - Internet group has a 94 Relative Strength Rating.The number of top-rated funds owning its shares rose from 354 in Dec '16 to 381 in Mar '17, a reassuring sign in recent months concerning the I criteria. Its current Up/Down Volume ratio of 1.6 is an unbiased indication its shares have been under accumulation over the past 50 days. Its small supply of only 16.9 million shares outstanding (S criteria) can contribute to greater price volatility in the event of institutional buying or selling.
Rallying From Bottom of 13-Week Cup Shaped Base - Wednesday, May 24, 2017
Stamps.Com Inc (STMP +$5.85 or +4.63% to $132.30) was highlighted in yellow in the earlier mid-day report while rallying near prior highs. A new pivot point was cited based on its 2/22/17 high plus 10 cents. It is rallying from the bottom of a 13-week cup shaped base. Subsequent volume-driven gains for new highs may trigger a technical buy signal. Fundamentals have remained strong through the Mar '17 quarter. It found support near its 200-day moving average (DMA) line after dropped from the Featured Stocks list on 3/29/17.
STMP was last shown in this FSU section with an annotated graph on 3/24/17 under the headline, "Technical Deterioration Noted After 50-Day Moving Average Violation". It reported earnings +62% on +28% sales revenues for the Mar '17 quarter, continuing its strong growth track record. It has earned an Earnings Per Share Rating of 99, putting it in the top 1% of all publicly traded stocks based on its earnings history over the past 5 years. Currently it has a Timeliness Rating of A and a Sponsorship rating of C.
The Retail - Internet group has a 95 Relative Strength Rating.The number of top-rated funds owning its shares rose from 354 in Dec '16 to 370 in Mar '17, a reassuring sign in recent months concerning the I criteria. Its small supply of only 16.9 million shares outstanding (S criteria) can contribute to greater price volatility in the event of institutional buying or selling.
Technical Deterioration Noted After 50-Day Moving Average Violation - Friday, March 24, 2017
Stamps.Com Inc (STMP -$0.70 or -0.59% to $117.00) sank further below the 50-day moving average (DMA) line today after recent losses triggered worrisome technical sell signals. Only a prompt rebound above the 50 DMA line ($125.45) would help its outlook improve.
It reported earnings +74% on +52% sales revenues for the Dec '16 quarter, continuing its strong growth track record. It has earned an Earnings Per Share Rating of 99, putting it in the top 1% of all publicly traded stocks based on its earnings history over the past 5 years.
The Retail - Internet has a C- Group Relative Strength Rating which has been slumping in recent weeks. The number of top-rated funds owning its shares fell from 373 in Jun '16 to 349 in Dec'16, not a reassuring sign in recent months concerning the I criteria. Its small supply of only 16.8 million shares outstanding (S criteria) can contribute to greater price volatility in the event of institutional buying or selling.
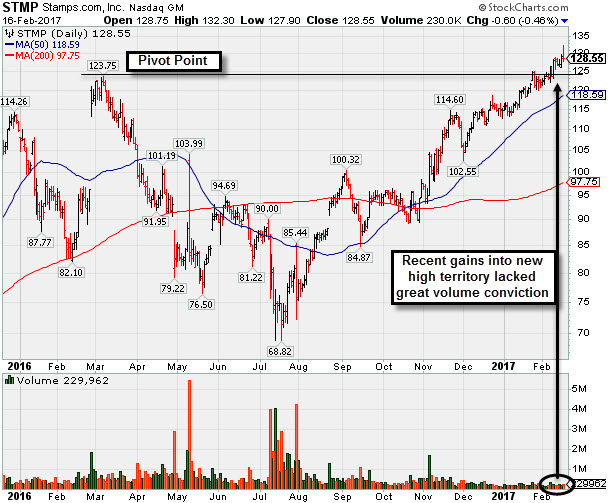
Recent Gains Have Lacked Heavy Volume Indicative of Accumulation - Thursday, February 16, 2017
Stamps.Com Inc (STMP -$0.60 or -0.46% to $128.55) was highlighted in yellow with pivot point cited based on its 3/07/16 high plus 10 cents in the earlier mid-day report (read here). Subsequent volume-driven gains may help clinch a convincing technical buy signal. Recently it has been wedging to new highs with gains lacking great volume conviction.
It is due to report Dec'16 earnings on 2/23/17, and volume and volatility often increase near earnings news. It reported earnings +104% on +79% sales revenues for the Sep '16 quarter, continuing its strong growth track record with a fourth consecutive earnings increase in the triple digits, percentage-wise, versus the year ago period(s).
It has earned an Earnings Per Share Rating of 99, putting it in the top 1% of all publicly traded stocks based on its earnings history over the past 5 years. The Retail - Internet firm has other strong leaders in the group confirming the L criteria, as the group has a B- Group Relative Strength Rating. Its annual earnings (A criteria) history has shown strong and steady increases since FY '09 following a couple of flat years. The number of top-rated funds owning its shares rose from 232 in Dec '14 to 343 in Dec'16, a reassuring sign concerning the I criteria. Its small supply of only 17.1 million shares outstanding (S criteria) can contribute to greater price volatility in the event of institutional buying or selling.
Charts courtesy www.stockcharts.com
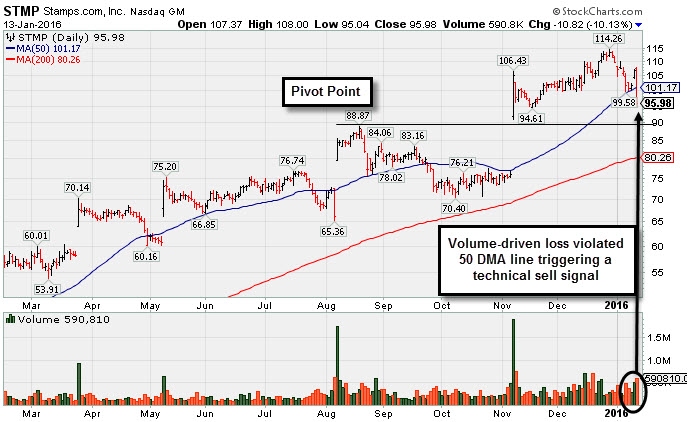
Violation of 50-Day Moving Average and Prior Lows Triggered Sell Signal - Wednesday, January 13, 2016
Stamps.Com Inc (STMP -$10.82 or -10.13% to $95.98) suffered a damaging volume-driven loss today and triggered a technical sell signal. It violated its 50-day moving average (DMA) line which was previously noted as important near-term support to watch. Its latest consolidation was too brief to be considered a sound base. Its last appearance in this FSU section with an annotated graph was on 12/28/15 under the headline, "Consolidation Was Brief Following Prior Breakaway Gap".
STMP was highlighted in yellow with pivot point cited based on its 8/19/15 high plus 10 cents in the 11/06/15 mid-day report (read here). Nearly 8 times average volume was behind its considerable "breakaway gap". Breakaway gaps are one noted exception where chasing a stock more than +5% above prior highs is permitted under the fact-based investment system guidelines, but risk increases the further above prior highs one makes any purchases.
Bullish action came after it reported earnings +61% on +37% sales revenues for the Sep '15 quarter, well above the +25% minimum guideline (C criteria), continuing its strong earnings history matching the fact-based investment system's winning models. Earnings rose +44%, +76%, and 61% in the Mar, Jun, and Sep '15 quarters, respectively, versus the year ago periods. Sales revenues rose +32%, +41%, and +37% during that same span.
It has earned an Earnings Per Share Rating of 99, putting it in the top 1% of all publicly traded stocks based on its earnings history over the past 5 years. The Retail - Internet firm has other strong leaders in the group confirming the L criteria, as the group has an A+ Group Relative Strength Rating. Its annual earnings (A criteria) history has shown strong and steady increases since FY '09 following a couple of flat years. The number of top-rated funds owning its shares rose from 232 in Dec '14 to 319 in Sep '15, a reassuring sign concerning the I criteria. Its small supply of only 16.6 million shares outstanding (S criteria) can contribute to greater price volatility in the event of institutional buying or selling.
Charts courtesy www.stockcharts.com
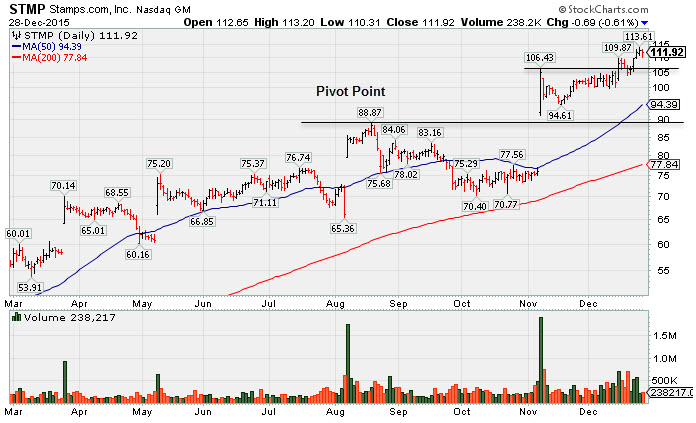
Consolidation Was Brief Following Prior Breakaway Gap - Monday, December 28, 2015
Stamps.Com Inc (STMP -$0.69 or -0.61% to $111.92 ) is perched near its 52-week high after volume-driven gains. Its 50-day moving average (DMA) line ($94.39) and recent lows define near-term support to watch. Disciplined investors avoid chasing extended stocks. Its latest consolidation was too brief to be considered a sound base, yet it stubbornly held its ground and showed bullish action since last appearing in this FSU section with an annotated graph on 12/11/15 under the headline, "Perched Near 52-Week High After More Bullish Action".
STMP was highlighted in yellow with pivot point cited based on its 8/19/15 high plus 10 cents in the 11/06/15 mid-day report (read here). Nearly 8 times average volume was behind its considerable "breakaway gap". Breakaway gaps are one noted exception where chasing a stock more than +5% above prior highs is permitted under the fact-based investment system guidelines, but risk increases the further above prior highs one makes any purchases.
Bullish action came after it reported earnings +61% on +37% sales revenues for the Sep '15 quarter, well above the +25% minimum guideline (C criteria), continuing its strong earnings history matching the fact-based investment system's winning models. Earnings rose +44%, +76%, and 61% in the Mar, Jun, and Sep '15 quarters, respectively, versus the year ago periods. Sales revenues rose +32%, +41%, and +37% during that same span.
It has earned an Earnings Per Share Rating of 99, putting it in the top 1% of all publicly traded stocks based on its earnings history over the past 5 years. The Retail - Internet firm has other strong leaders in the group confirming the L criteria, as the group has an A+ Group Relative Strength Rating. Its annual earnings (A criteria) history has shown strong and steady increases since FY '09 following a couple of flat years. The number of top-rated funds owning its shares rose from 232 in Dec '14 to 316 in Sep '15, a reassuring sign concerning the I criteria. Its small supply of only 16.6 million shares outstanding (S criteria) can contribute to greater price volatility in the event of institutional buying or selling.
Charts courtesy www.stockcharts.com
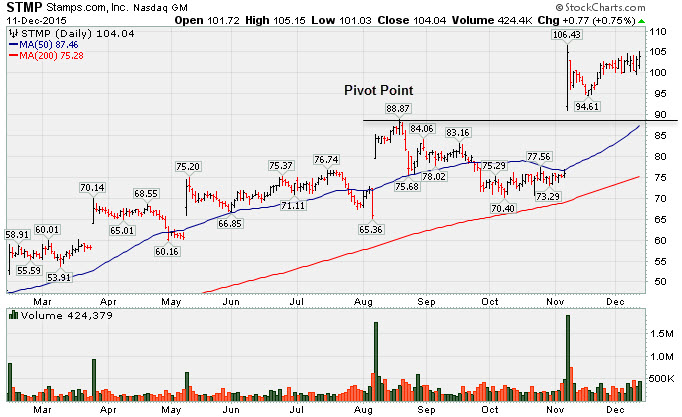
Perched Near 52-Week High After More Bullish Action - Friday, December 11, 2015
Stamps.Com Inc (STMP +$0.77 or +0.75% to $104.04) is still consolidating in a very tight range near its 52-week high. Prior highs in the $88 area define important near-term support to watch. Disciplined investors avoid chasing extended stocks. It has been consolidating since last shown in this FSU section with an annotated graph on 11/23/15 under the headline, "Volume-Driven Gain For Second Best Close". It was highlighted in yellow with pivot point cited based on its 8/19/15 high plus 10 cents in the 11/06/15 mid-day report (read here). Nearly 8 times average volume was behind its considerable "breakaway gap". Breakaway gaps are one noted exception where chasing a stock more than +5% above prior highs is permitted under the fact-based investment system guidelines, but risk increases the further above prior highs one makes any purchases.
Bullish action came after it reported earnings +61% on +37% sales revenues for the Sep '15 quarter, well above the +25% minimum guideline (C criteria), continuing its strong earnings history matching the fact-based investment system's winning models. Earnings rose +44%, +76%, and 61% in the Mar, Jun, and Sep '15 quarters, respectively, versus the year ago periods. Sales revenues rose +32%, +41%, and +37% during that same span.
It has earned an Earnings Per Share Rating of 99, putting it in the top 1% of all publicly traded stocks based on its earnings history over the past 5 years. The Retail - Internet firm has other strong leaders in the group confirming the L criteria, as the group has an A+ Group Relative Strength Rating. Its annual earnings (A criteria) history has shown strong and steady increases since FY '09 following a couple of flat years. The number of top-rated funds owning its shares rose from 232 in Dec '14 to 312 in Sep '15, a reassuring sign concerning the I criteria. Its small supply of only 16.5 million shares outstanding (S criteria) can contribute to greater price volatility in the event of institutional buying or selling.
Charts courtesy www.stockcharts.com
Volume-Driven Gain For Second Best Close - Monday, November 23, 2015
Stamps.Com Inc (STMP +$3.14 or +3.18% to $101.85) rose today with above average volume for its best close since its big "breakaway gap" on 10/28/15. Disciplined investors avoid chasing extended stocks. It has been consolidating since last shown in this FSU section with an annotated graph on 11/06/15 under the headline, "Big Breakaway Gap With Heavy Volume Following Earnings News". It was highlighted in yellow with pivot point cited based on its 8/19/15 high plus 10 cents in the earlier mid-day report (read here).
Nearly 8 times average volume was behind its considerable "breakaway gap". Breakaway gaps are one noted exception where chasing a stock more than +5% above prior highs is permitted under the fact-based investment system guidelines, but risk increases the further above prior highs one makes any purchases.
Bullish action came after it reported earnings +61% on +37% sales revenues for the Sep '15 quarter, well above the +25% minimum guideline (C criteria), continuing its strong earnings history matching the fact-based investment system's winning models. Earnings rose +44%, +76%, and 61% in the Mar, Jun, and Sep '15 quarters, respectively, versus the year ago periods. Sales revenues rose +32%, +41%, and +37% during that same span.
It has earned an Earnings Per Share Rating of 99, putting it in the top 1% of all publicly traded stocks based on its earnings history over the past 5 years. The Retail - Internet firm has other strong leaders in the group confirming the L criteria, as the group has an A+ Group Relative Strength Rating. Its annual earnings (A criteria) history has shown strong and steady increases since FY '09 following a couple of flat years. The number of top-rated funds owning its shares rose from 232 in Dec '14 to 309 in Sep '15, a reassuring sign concerning the I criteria. Its small supply of only 16.5 million shares outstanding (S criteria) can contribute to greater price volatility in the event of institutional buying or selling.
Charts courtesy www.stockcharts.com
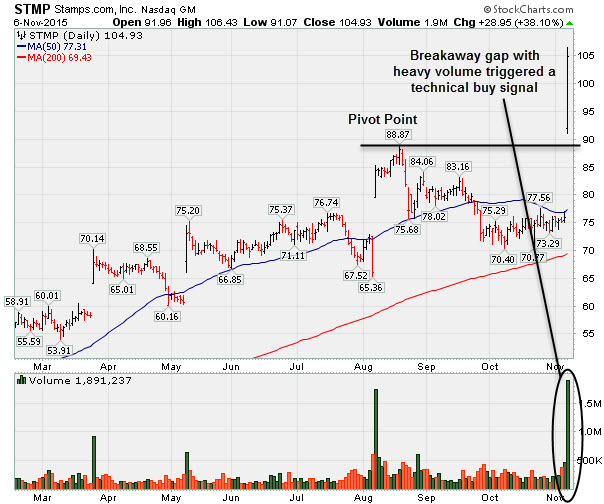
Big Breakaway Gap With Heavy Volume Following Earnings News - Friday, November 6, 2015
Stamps.Com Inc (STMP +$28.95 or +38.10% to $104.93) was highlighted in yellow with pivot point cited based on its 8/19/15 high plus 10 cents (read here). It hit a new 52-week high with nearly 8 times average volume behind today's considerable "breakaway gap". Breakaway gaps are one noted exception where chasing a stock more than +5% above prior highs is permitted under the fact-based investment system guidelines, but risk increases the further above prior highs one makes any purchases.
Bullish action came after it reported earnings +61% on +37% sales revenues for the Sep '15 quarter, well above the +25% minimum guideline (C criteria), continuing its strong earnings history matching the fact-based investment system's winning models. Earnings rose +44%, +76%, and 61% in the Mar, Jun, and Sep '15 quarters, respectively, versus the year ago periods. Sales revenues rose +32%, +41%, and +37% during that same span.
STMP has managed a choppy ascent following a deep consolidation after last shown in this FSU section with an annotated graph on 12/02/13 under the headline, " Upward Trendline and 50-Day Average Define Important Near-Term Support".
It has earned an Earnings Per Share Rating of 99, putting it in the top 1% of all publicly traded stocks based on its earnings history over the past 5 years. The Retail - Internet firm has other strong leaders in the group confirming the L criteria, as the group has an A+ Group Relative Strength Rating. Its annual earnings (A criteria) history has shown strong and steady increases since FY '09 following a couple of flat years. The number of top-rated funds owning its shares rose from 232 in Dec '14 to 303 in Sep '15, a reassuring sign concerning the I criteria. Its small supply of only 16.5 million shares outstanding (S criteria) can contribute to greater price volatility in the event of institutional buying or selling.
Charts courtesy www.stockcharts.com
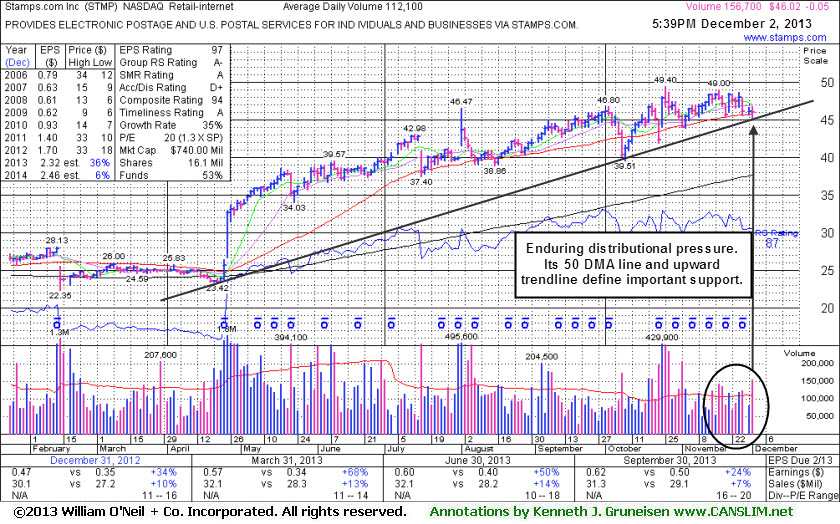
Upward Trendline and 50-Day Average Define Important Near-Term Support - Monday, December 02, 2013
Stamps.Com Inc (STMP -$0.05 or -0.11% to $46.02) is still finding support near its 50-day moving average (DMA) line which recently acted as support. An upward trendline also comes into play as a technical support level. More damaging losses below those levels would raise greater concerns and trigger worrisome technical sell signals.
Earnings were +24% on +7% sales revenues for the Sep '13 quarter, just below the +25% minimum earnings guideline (C criteria). STMP has been resilient was last shown in this FSU section with an annotated graph on 10/31/13 under the headline, "Fundamental Flaw May Prompt Disciplined Investors to Look Elsewhere", consolidating near prior highs in the $46 area. Disciplined investors might watch for continued technical strength and better earnings results in the next quarter, meanwhile looking to take action sooner on any fresh buy candidates without flaws.
It has earned an Earnings Per Share Rating of 97, putting it in the top 3% of all publicly traded stocks based on its earnings history over the past 5 years. The Retail - Internet firm has other strong leaders in the group confirming the L criteria, as the group has an A- Group Relative Strength Rating. Its annual earnings (A criteria) history has shown strong and steady increases since FY '09 following a couple of flat years. The number of top-rated funds owning its shares rose from 194 in Dec '12 to 231 in Sep '13, a reassuring sign concerning the I criteria. Its small supply of only 15.6 million shares outstanding (S criteria) can contribute to greater price volatility in the event of institutional buying or selling.
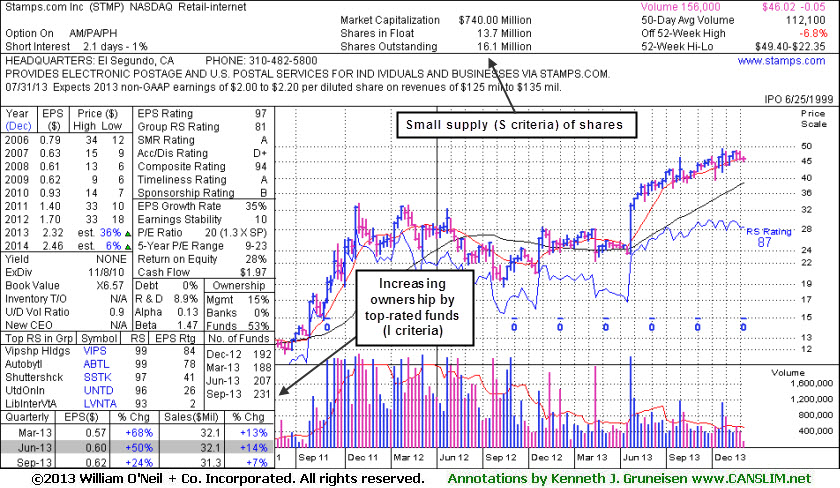
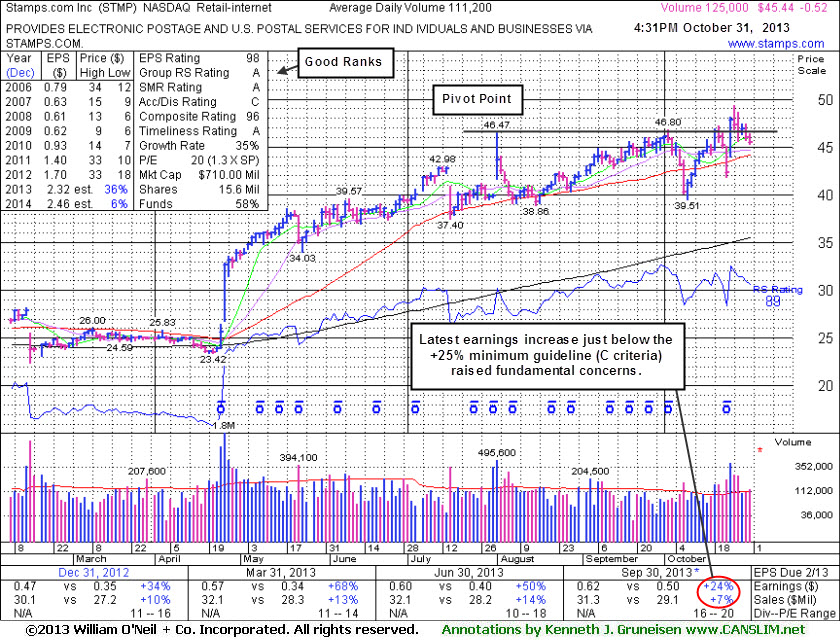
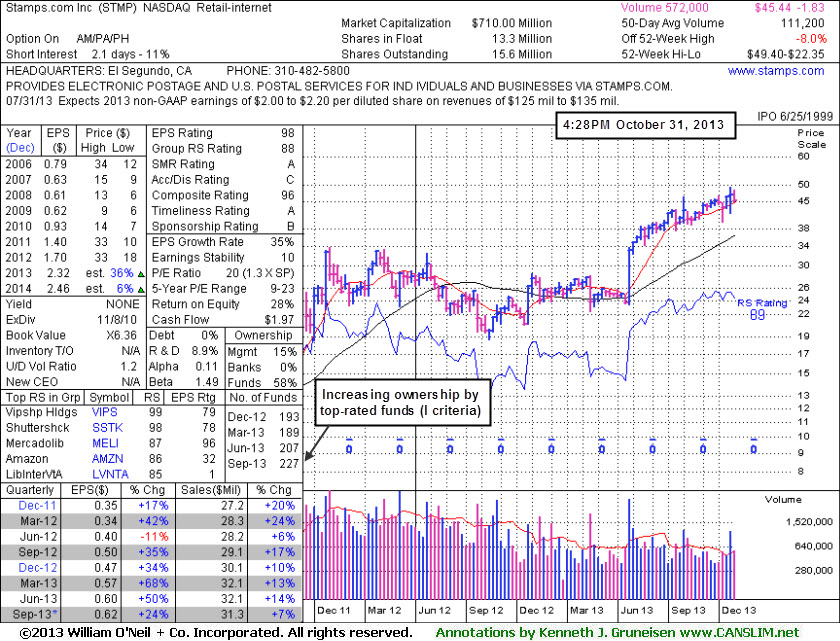
Fundamental Flaw May Prompt Disciplined Investors to Look Elsewhere - Thursday, October 31, 2013
Stamps.Com Inc (STMP +$0.82 or +1.84% to $45.46) is consolidating near prior highs in the $46 area. It churned above average volume at its new 52-week high but made limited progress after clearing prior resistance. Fundamental concerns were raised by waning sales revenues and earnings increases after it reported earnings +24% on +7% sales revenues for the Sep '13 quarter, just below the +25% minimum earnings guideline (C criteria). Disciplined investors might sooner look to take action on a buy candidate without any fresh flaws developing in their fundamentals.
STMP was last shown in this FSU section with an annotated graph on 9/24/13 under the headline, "Forming New Set-Up After 50-Day Average Acted as Support". It has earned an Earnings Per Share Rating of 98, putting it in the top 2% of all publicly traded stocks based on its earnings history over the past 5 years. The Retail - Internet firm has other strong leaders in the group confirming the L criteria, as the group has an A Group Relative Strength Rating. Its annual earnings (A criteria) history has shown strong and steady increases since FY '09 following a couple of flat years. The number of top-rated funds owning its shares rose from 194 in Dec '12 to 227 in Sep '13, a reassuring sign concerning the I criteria. Its small supply of only 15.6 million shares outstanding (S criteria) can contribute to greater price volatility in the event of institutional buying or selling.
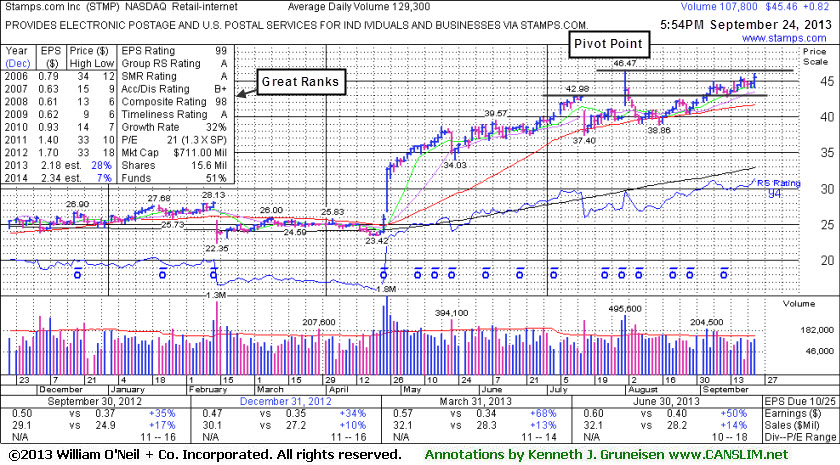
Forming New Set-Up After 50-Day Average Acted as Support - Tuesday, September 24, 2013
Stamps.Com Inc (STMP +$0.82 or +1.84% to $45.46) finished at a best-ever close with today's gain on light volume. A new pivot point was cited based on its 8/01/13 high plus 10 cents. Subsequent volume-driven gains to new highs may trigger a new (or add-on) technical buy signal. It was last shown in this FSU section with an annotated graph on 8/23/13 under the headline, "Stalled Following Gap Up Gain To New High ". It found encouraging support at its 50-day moving average (DMA) line and it has recently been wedging higher with gains lacking great volume conviction.
After clearing multi-year resistance in the $33 area it subsequently made steady progress. It reported earnings +50% on +14% sales for the quarter ended June 30, 2013 versus the year ago period, continuing its strong earnings track record. It has earned an Earnings Per Share Rating of 99, putting it in the top 1% of all publicly traded stocks based on its earnings history over the past 5 years. The Retail - Internet firm has other strong leaders in the group confirming the L criteria, as the group has an A Group Relative Strength Rating. Its annual earnings (A criteria) history has shown strong and steady increases since FY '09 following a couple of flat years. The number of top-rated funds owning its shares rose from 194 in Dec '12 to 207 in Jun '13, a reassuring sign concerning the I criteria. Its small supply of only 15.6 million shares outstanding (S criteria) can contribute to greater price volatility in the event of institutional buying or selling.
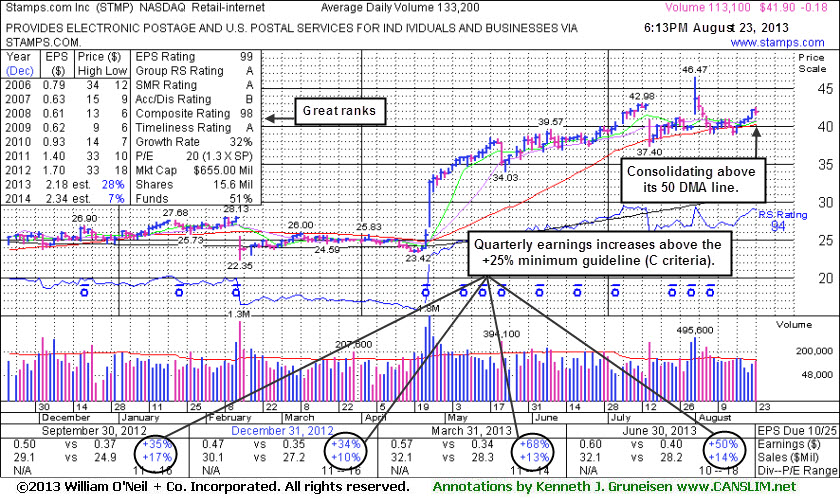
Stalled Following Gap Up Gain To New High - Friday, August 23, 2013
Stamps.Com Inc (STMP -$0.18 or +0.18% to $41.90) has recently been consolidating above its 50-day moving average (DMA) line. It was last shown in this FSU section with an annotated graph on 7/31/13 under the headline, "Following Test of Support Secondary Buy Point Exists". It stalled following a considerable volume-driven gap up gain on 8/01/13. Keep in mind that the broader market direction (M criteria) weighs heavily into the mix as historic studies showed that 3 out of 4 stocks typically move in the same direction of the major averages. For as long as the current market correction continues, odds are not favorable for most stocks making meaningful headway.
Pay close attention to stocks that hold up well during corrections and watch for those that are the first ones breaking into new high ground upon any new confirmed rally. Meanwhile, if holding onto current gains, investors should stand ready to reduce exposure before too much damage starts to mount. Disciplined investors always limit losses by selling any stock that falls more than -7% from their purchase price, but sometimes weak technical action may hint that it is a smart time to sell even before losses reach that important maximum loss threshold.
After clearing multi-year resistance in the $33 area it subsequently made steady progress. STMP had not formed a sound new base, however it was highlighted in yellow in the 7/31/13 mid-day report (read here) as it was noted - "A valid secondary buy point exists following its successful test of support up to +5% above its prior high. Reported earnings +68% on +13% sales revenues for the quarter ended March 31, 2013 versus the year ago period, marking a 3rd consecutive quarter above the +25% minimum guideline (C criteria). Due to report earnings after the close, and volume and volatility often increase near earnings news. "
After the close it reported earnings +50% on +14% sales for the quarter ended June 30, 2013 versus the year ago period, continuing its strong earnings track record. It has earned an Earnings Per Share Rating of 99, putting it in the top 1% of all publicly traded stocks based on its earnings history over the past 5 years. The Retail - Internet firm has other strong leaders in the group confirming the L criteria, as the group has an A Group Relative Strength Rating. Its annual earnings (A criteria) history has shown strong and steady increases since FY '09 following a couple of flat years. The number of top-rated funds owning its shares rose from 194 in Dec '12 to 204 in Jun '13, a reassuring sign concerning the I criteria. Its small supply of only 15.6 million shares outstanding (S criteria) can contribute to greater price volatility in the event of institutional buying or selling.
Following Test of Support Secondary Buy Point Exists - Wednesday, July 31, 2013
In the Certification they teach that stocks can be bought from their first test of the 10-week moving average (WMA) line up to as much as +5% above the latest high following an earlier technical breakout. The approach offers investors a "secondary buy point" if they missed an opportunity to accumulate shares at an earlier breakout, or if they wish to make add-on purchases and "force feed" their winning positions. The 10 WMA line closely corresponds with the 50-day moving average (DMA) line shown on the graph below. Obviously any damaging pullback may prompt investors to limit their losses at the -7% threshold from their purchase price, as always.
Stamps.Com Inc (STMP +$0.07 or +0.18% to $39.86) found prompt support at its 50-day moving average (DMA) line when it was hit with distributional pressure since last noted in the 6/25/13 mid-day report. Disciplined investors may watch for it to possibly form a proper base of sufficient length and be noted in the weeks ahead. The graph below shows its powerful breakout in late April. After clearing multi-year resistance in the $33 area it subsequently made steady progress by mostly wedging higher with gains lacking great volume conviction. That lack of great volume conviction in recent month helps explain why it failed to meet the screening criteria to show up in the daily mid-day report which is produced via a screening of the high-ranked Leaders List since the 6/25/13 mid-day report had noted - "It has not formed a sound base yet made gradual progress above multi-year highs in the $33 area since last noted in the 4/29/13 mid-day report - "Patient and disciplined investors may watch for a new base or secondary buy point to possibly develop and be noted in the weeks ahead. Reported earnings +68% on +13% sales revenues for the quarter ended March 31, 2013 versus the year ago period, marking a 3rd consecutive quarter above the +25% minimum guideline (C criteria). It survived but failed to impress since dropped from the Featured Stocks list on 2/14/12 based on the fundamental and technical concerns."
STMP had not formed a sound new base, however it was highlighted in yellow in today's mid-day report (read here) as it was noted - "A valid secondary buy point exists following its successful test of support up to +5% above its prior high. Reported earnings +68% on +13% sales revenues for the quarter ended March 31, 2013 versus the year ago period, marking a 3rd consecutive quarter above the +25% minimum guideline (C criteria). Due to report earnings after the close, and volume and volatility often increase near earnings news. "
After the close it reported earnings +50% on +14% sales for the quarter ended June 30, 2013 versus the year ago period, continuing its strong earnings track record. It has earned an Earnings Per Share Rating of 98, putting it in the top 2% of all publicly traded stocks based on its earnings history over the past 5 years. The Retail - Internet firm has other strong leaders in the group confirming the L criteria, as the group has an A+ Group Relative Strength Rating. Its annual earnings (A criteria) history has shown strong and steady increases since FY '09 following a couple of flat years. The number of top-rated funds owning its shares rose from 194 in Dec '12 to 199 in Jun '13, a reassuring sign concerning the I criteria. Its small supply of only 15.3 million shares outstanding (S criteria) can contribute to greater price volatility in the event of institutional buying or selling.
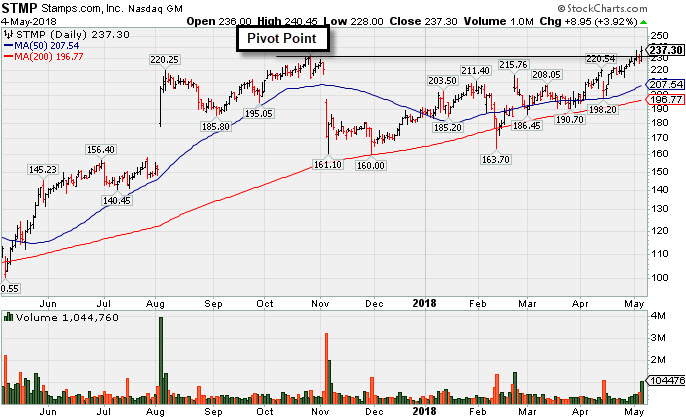
Confirming Gains Still Needed to Clinch Buy Signal - Tuesday, February 07, 2012
Stamps.Com Inc (STMP +$0.68 or +2.15% to $32.33) tallied a volume-driven gain today. It was featured in yellow in the earlier mid-day report while perched within close striking distance of its 52-week high after a 14-week cup-with-handle shaped base pattern. Disciplined investors may watch for a strong volume-driven gain above its pivot point to trigger a technical buy signal. However it finished below that mark and near the middle of its intra-day range, so confirming gains are needed.
The high-ranked Retail - Internet firm has other strong leaders in the group confirming the L criteria, but the group's low ranks (see red circle) would otherwise be of greater concern. It reported earnings +54% on +20% sales revenues for the quarter ended September 30, 2011 versus the year ago period. Recent quarterly comparisons showed improved sales revenues increases, and its strong earnings increases satisfy the C criteria. Prior reports noted that its annual earnings (A criteria) history did not show strong and steady increases, however FY '10 showed a big increase following a couple of flat years. The number of top-rated funds owning its shares rose from 166 in Jun '11 to 199 in Dec '11, a reassuring sign concerning the I criteria. Its current Up/Down Volume Ratio of 1.4 also provides an unbiased hint its shares have recently been under accumulation.