Paypal Perched at Record High - Wednesday, July 28, 2021
Paypal Holdings Inc (PYPL +$1.50 or +0.50% to $301.98) was highlighted in yellow in the 7/27/21 mid-day report (read here) with new pivot point cited based on its 7/13/21 high after a cup-with-handle base. It quietly wedged to a new all-time high. Subsequent gains above its pivot point backed by at least +40% above average volume may trigger a new buy signal. It reported Jun '21 quarterly results after the close. Volume and volatility often increase near earnings news.
PYPL reported Mar '21 quarterly earnings +85% on +31% sales revenues versus the year ago period, its 4th strong comparison above the +25% minimum guideline (C criteria). Annual earnings (A criteria) growth has been strong and steady.
It has a large supply 1.175 billion shares outstanding (S criteria). The high-ranked Finance - Credit Card/Payment Processing firm saw the number of top-rated funds owning its shares rise from 3,666 in Sep '20 to 4,260 in Jun '21, a reassuring sign concerning the I criteria. Its current Up/Down Volume Ratio of 1.5 is an unbiased indication its shares have been under accumulation over the past 50 days. It has a Timeliness Rating of A and Sponsorship Rating of B.
Charts courtesy wwwstockcharts.com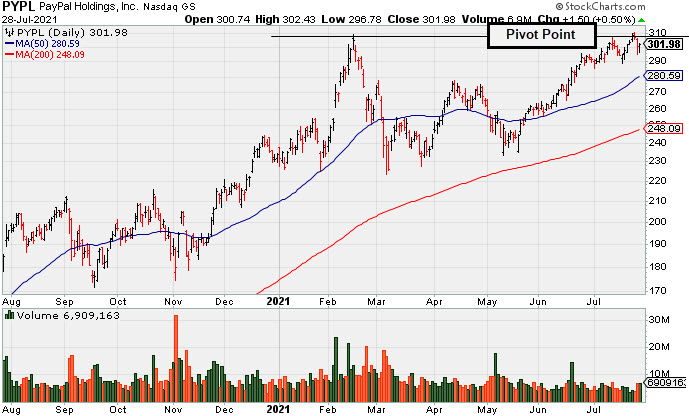
Perched Near Record High Ahead of Earnings News - Tuesday, July 23, 2019
Paypal Holdings Inc (PYPL +$1.53 or +1.29% to $120.22) is due to report Jun '19 quarterly earnings news after the close on Wednesday, July 24th. Volume and volatility often increase near earnings news. It has been hovering near its all-time high, however it did not form a sound base but wedged higher in recent weeks with gains lacking great volume conviction. PYPL promptly rebounded after a big loss on 6/03/19 violated its 50-day moving average (DMA) line and prior low ($106.52) on 6/03/19 triggering technical sell signals.
It reported earnings +37% on +12% sales revenues for the Mar '19 quarter and has reported 9 consecutive quarterly earnings increases above the +25% minimum guideline (C criteria). The high-ranked Finance - Credit Card/Payment Processing firm saw the number of top-rated funds owning its shares rise from 2,054 in Mar '17 to 2,840 in Mar '19, a reassuring sign concerning the I criteria. Its current Up/Down Volume Ratio of 1.2 is an unbiased indication its shares have been under accumulation over the past 50 days. It has a Timeliness Rating of A and Sponsorship Rating of B.
Patient investors may watch for a new base or secondary buy point to possibly develop and be noted in the weeks ahead. PYPL was last shown in this FSU section on 6/19/19 with an annotated graph under the headline, "Popular Payments Firm Extended From Any Sound Base". PYPL was highlighted in yellow with new pivot point cited based on its 9/13/18 high plus 10 cents in the 1/24/19 mid-day report (read here).
Charts courtesy wwwstockcharts.com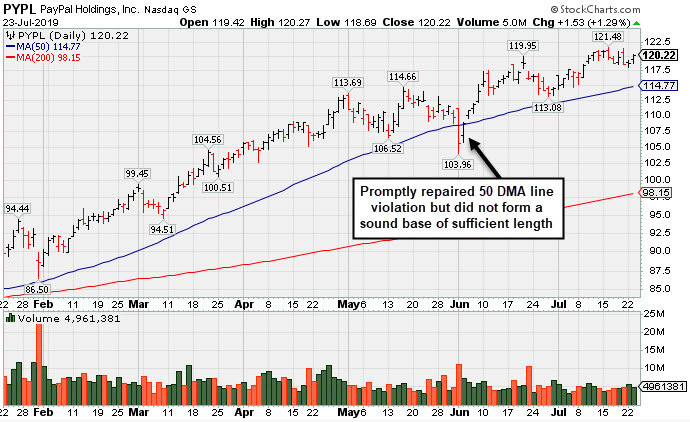
Popular Payments Firm Extended From Any Sound Base - Wednesday, June 19, 2019
Paypal Holdings Inc (PYPL +1.11 or +0.96% to $117.09) is perched near its all-time high with no resistance remaining due to overhead supply. It did not form a sound base yet promptly rebounded after a big loss on 6/03/19 violated its 50-day moving average (DMA) line and prior low ($106.52) on 6/03/19 triggering technical sell signals.
Recently it reported earnings +37% on +12% sales revenues for the Mar '19 quarter, and it has now tallied 9 consecutive quarterly earnings increases above the +25% minimum guideline (C criteria). The high-ranked Finance - Credit Card/Payment Processing firm saw the number of top-rated funds owning its shares rise from 2,054 in Mar '17 to 2,810 in Mar '19, a reassuring sign concerning the I criteria. Its current Up/Down Volume Ratio of 1.6 is an unbiased indication its shares have been under accumulation over the past 50 days. It has a Timeliness Rating of A and Sponsorship Rating of B.
Recently it reported earnings +37% on +12% sales revenues for the Mar '19 quarter, and it has now tallied 9 consecutive quarterly earnings increases above the +25% minimum guideline (C criteria). The high-ranked Finance - Credit Card/Payment Processing firm saw the number of top-rated funds owning its shares rise from 2,054 in Mar '17 to 2,810 in Mar '19, a reassuring sign concerning the I criteria. Its current Up/Down Volume Ratio of 1.6 is an unbiased indication its shares have been under accumulation over the past 50 days. It has a Timeliness Rating of A and Sponsorship Rating of B.
Patient investors may watch for a new base or secondary buy point to possibly develop and be noted in the weeks ahead. PYPL was last shown in this FSU section on 5/15/19 with an annotated graph under the headline, "Hovering Near All Time High Extended From Any Sound Base". PYPL was highlighted in yellow with new pivot point cited based on its 9/13/18 high plus 10 cents in the 1/24/19 mid-day report (read here).
Charts courtesy wwwstockcharts.com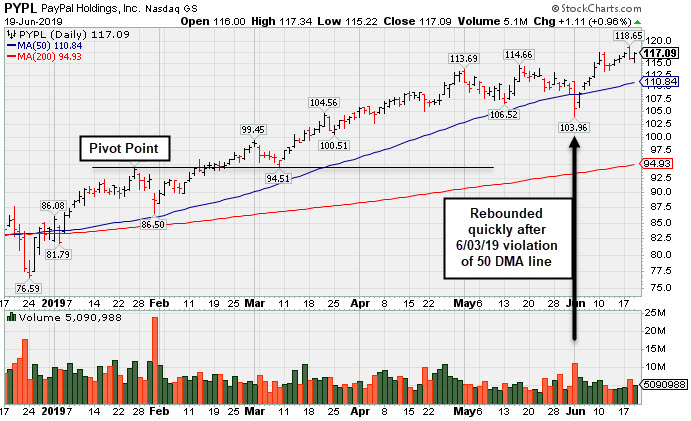
Hovering Near All Time High Extended From Any Sound Base - Wednesday, May 15, 2019
Paypal Holdings Inc (PYPL $2.41 or + 2.21% to $111.50) is consolidating above its 50-day moving average (DMA) line ($105.55) which defines near-term support to watch. Recently it reported earnings +37% on +12% sales revenues for the Mar '19 quarter, and it has now tallied 9 consecutive quarterly earnings increases above the +25% minimum guideline (C criteria).
Patient investors may watch for a new base or secondary bu point to possibly develop and be noted in the weeks ahead. PYPL was last shown in this FSU section on 4/02/19 with an annotated graph under the headline, "Extended From Base After Gains in Recent Weeks Lacking Volume." PYPL was highlighted in yellow with new pivot point cited based on its 9/13/18 high plus 10 cents in the 1/24/19 mid-day report (read here).
The high-ranked Finance - Credit Card/Payment Processing firm saw the number of top-rated funds owning its shares rise from 2,054 in Mar '17 to 2,770 in Mar '19, a reassuring sign concerning the I criteria. Its current Up/Down Volume Ratio of 1.5 is an unbiased indication its shares have been under accumulation over the past 50 days. It has a Timeliness Rating of A and Sponsorship Rating of B.
Charts courtesy wwwstockcharts.com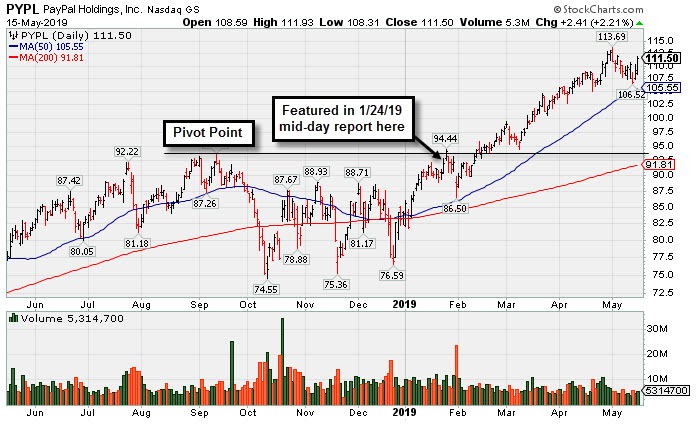
Extended From Base After Gains in Recent Weeks Lacking Volume - Tuesday, April 2, 2019
Paypal Holdings Inc (PYPL -$0.32 or -0.30% to $105.23) is perched at its all-time high after quietly wedging into new high territory, extended from any sound base. It reported +25% earnings on +13% sales revenues for the Dec '18 quarter. Fundamentals remain strong, as it has now tallied 8 consecutive quarterly earnings increases above the +25% minimum guideline (C criteria).
Patient investors may watch for a new base or secondary bu point to possibly develop and be noted in the weeks ahead. PYPL was last shown in this FSU section on 2/22/19 with an annotated graph under the headline,"Wedging into New High Territory With Gains Lacking Volume". PYPL was highlighted in yellow with new pivot point cited based on its 9/13/18 high plus 10 cents in the 1/24/19 mid-day report (read here).
The high-ranked Finance - Credit Card/Payment Processing firm saw the number of top-rated funds owning its shares rise from 2,054 in Mar '17 to 2,545 in Dec '18, a reassuring sign concerning the I criteria. Its current Up/Down Volume Ratio of 1.6 is an unbiased indication its shares have been under slight accumulation over the past 50 days. It has a Timeliness Rating of A and Sponsorship Rating of B.
Charts courtesy wwwstockcharts.com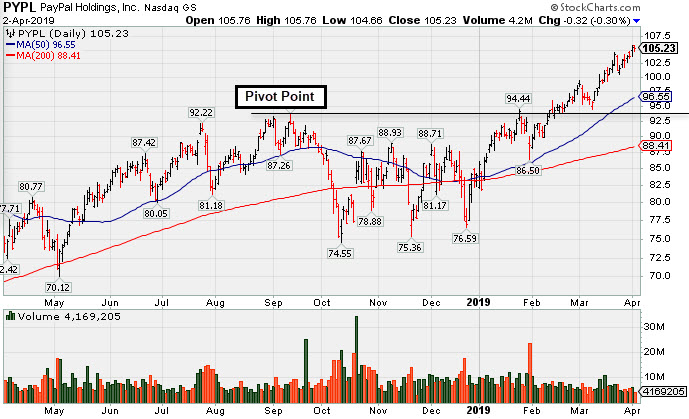
Wedging into New High Territory With Gains Lacking Volume - Friday, February 22, 2019
Paypal Holdings Inc (PYPL +1.02 or +1.07% to $95.98) finished near the session high with another gain on light volume, quietly wedging into new high territory. Recently it reported +25% earnings on +13% sales revenues for the Dec '18 quarter and there was a shakeout near its 50-day moving average line while members were reminded again - "Volume and volatility often increase near earnings news." Fundamentals remain strong, as it has now tallied 7 consecutive quarterly earnings increases above the +25% minimum guideline (C criteria).PYPL was last shown in this FSU section on 1/24/19 with an annotated graph under the headline,"Perched Within Striking Distance of High Ahead of Earnings News". The high-ranked Finance - Credit Card/Payment Processing firm saw the number of top-rated funds owning its shares rise from 2,054 in Mar '17 to 2,520 in Dec '18, a reassuring sign concerning the I criteria. Its current Up/Down Volume Ratio of 1.4 is an unbiased indication its shares have been under slight accumulation over the past 50 days. It has a Timeliness Rating of A and Sponsorship Rating of B.
Disciplined investors note that the recent gains above the pivot point lacked the +40% above average volume needed to trigger a proper technical buy signal. PYPL was highlighted in yellow with new pivot point cited based on its 9/13/18 high plus 10 cents in the 1/24/19 mid-day report (read here). Subsequent gains above the pivot point backed by at least +40% above average volume are needed to clinch a proper technical buy signal.Its 50-day moving average (DMA) line ($89.15) defines important near-term support to watch on pullbacks.
Charts courtesy wwwstockcharts.com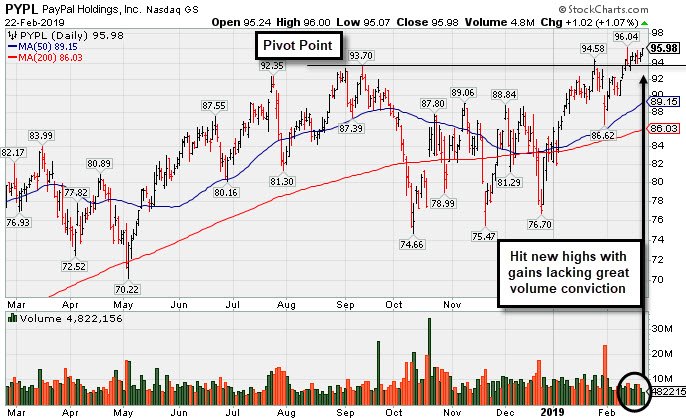
Perched Within Striking Distance of High Ahead of Earnings News - Thursday, January 24, 2019
Paypal Holdings Inc (PYPL +$1.70 or +1.88% to $92.20) was highlighted in yellow with new pivot point cited based on its 9/13/18 high plus 10 cents in the earlier mid-day report (read here). It is challenging its all-time high. Subsequent gains above the pivot point backed by at least +40% above average volume are needed to trigger a proper technical buy signal. Its 50-day moving average (DMA) line ($85.37) and 200 DMA line define important near-term support above recent lows in the $75 area.Keep in mind that it is due to report earnings news on 1/30/19. Volume and volatility often increase near earnings news. Fundamentals remain strong. It reported earnings +26% on +14% sales revenues for the Sep '18 quarter, its 6th consecutive quarterly earnings increase above the +25% minimum guideline (C criteria).
PYPL went through a choppy consolidation since last shown in this FSU section on 9/12/18 with an annotated graph under the headline, "Consolidating Above 50-Day Moving Average Near High". The high-ranked Finance - Credit Card/Payment Processing firm saw the number of top-rated funds owning its shares rise from 2,054 in Mar '17 to 2,486 in Dec '18, a reassuring sign concerning the I criteria. Its current Up/Down Volume Ratio of 1.2 is an unbiased indication its shares have been under slight accumulation over the past 50 days. It has a Timeliness Rating of A and Sponsorship Rating of B.
Charts courtesy wwwstockcharts.com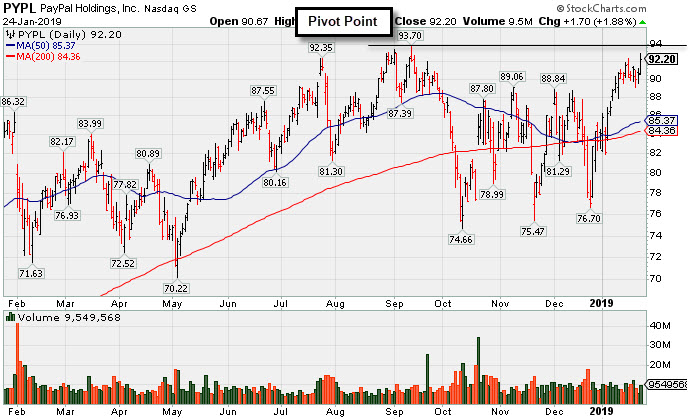
Consolidating Above 50-Day Moving Average Near High - Wednesday, September 12, 2018
Paypal Holdings Inc (PYPL +$0.97 or +1.06% to $92.40) posted a 3rd consecutive gain rising back above its "max buy" level and its color code is changed to green. Its 50-day moving average (DMA) line ($87.71) defines important near-term support above prior lows.It recently reported earnings +26% on +23% sales revenues for the Jun '18 quarter, its 5th consecutive quarterly earnings increase above the +25% minimum guideline (C criteria). PYPL was last shown in this FSU section on 7/26/18 with an annotated graph under the headline, "Paypal Pulling Back From Record High". It was highlighted in yellow in the 2/01/18 mid-day report (read here) while testing support at prior highs and its 10 week moving average line.
Very encouraging sales revenues and earnings growth rate acceleration was noted in prior sequential quarterly comparisons, making it a better match with the fact-based investment system's winning models.Sales revenues rose by +17%, +18%, +21%, and +26% in the Mar, Jun, Sep, Dec '17 quarters, respectively, versus the year ago periods. Its annual earnings (A criteria) history has been very strong and steady.
The high-ranked Finance - Credit Card/Payment Processing firm saw the number of top-rated funds owning its shares rise from 2,054 in Mar '17 to 2,484 in Jun '18, a reassuring sign concerning the I criteria. Its current Up/Down Volume Ratio of 1.2 is an unbiased indication its shares have been under slight accumulation over the past 50 days. It has a Timeliness Rating of B and Sponsorship Rating of B.
Charts courtesy wwwstockcharts.com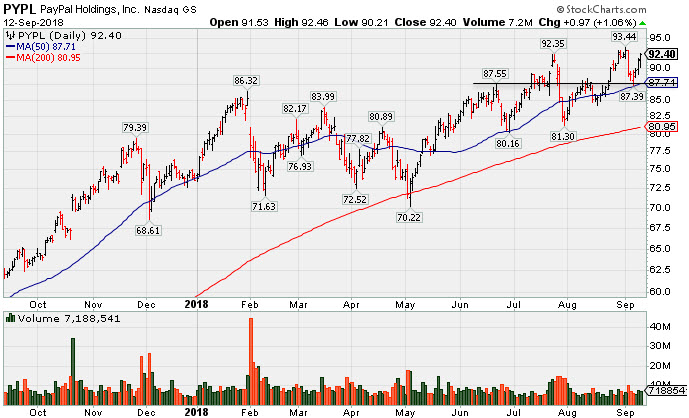
Paypal Pulling Back From Record High - Thursday, July 26, 2018
Paypal Holdings Inc (PYPL -$2.23 or -2.44% to $89.14) pulled back from its all-time high. Gains backed by above average volume while hitting new all-time highs were noted indications of recent institutional buying demand.It recently reported earnings +26% on +23% sales revenues for the Jun '18 quarter, its 5th consecutive quarterly earnings increase above the +25% minimum guideline (C criteria). A valid secondary buy point exists up to 5% above the prior high ($87.55 on 6/21/18) since finding support at the 10 WMA line following a prior breakout. The 50 DMA line ($84.62) defines near-term support above the prior low ($80.16 on 6/28/18).
PYPL was last shown in this FSU section on 6/8/18 with an annotated graph under the headline, "Gains Have Lacked Volume While Approaching All-Time High". It was highlighted in yellow in the 2/01/18 mid-day report (read here) while testing support at prior highs and its 10 week moving average line.
Very encouraging sales revenues and earnings growth rate acceleration was noted in prior sequential quarterly comparisons, making it a better match with the fact-based investment system's winning models.Sales revenues rose by +17%, +18%, +21%, and +26% in the Mar, Jun, Sep, Dec '17 quarters, respectively, versus the year ago periods. Its annual earnings (A criteria) history has been very strong and steady.
The high-ranked Finance - Credit Card/Payment Processing firm saw the number of top-rated funds owning its shares rise from 2,054 in Mar '17 to 2,363 in Jun '18, a reassuring sign concerning the I criteria. Its current Up/Down Volume Ratio of 2.0 is an unbiased indication its shares have been nearly neutral concerning accumulation/distribution over the past 50 days. It has a Timeliness Rating of A and Sponsorship Rating of B.
Charts courtesy wwwstockcharts.com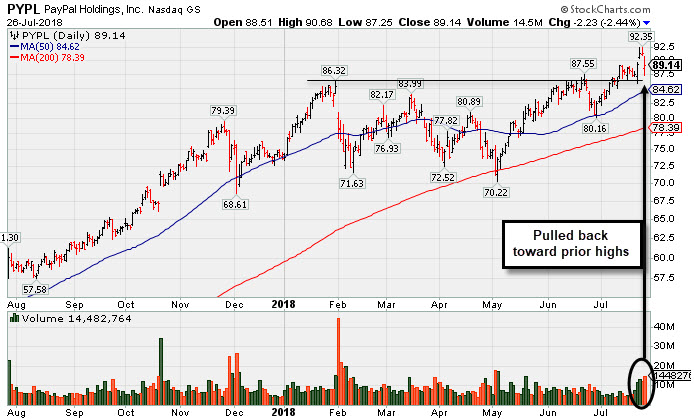
Gains Have Lacked Volume While Approaching All-Time High - Friday, June 8, 2018
Paypal Holdings Inc (PYPL +$1.07 or +1.28% to $84.34) is perched near its all-time high. During its recent streak of gains volume was light while wedging above the pivot point cited based on its 4/18/18 high and challenging its 52-week high. Confirming gains backed by at least +40% above average volume would be a reassuring sign of fresh institutional buying demand that can lead to a sustainable rally.The 50-day moving average (DMA) line ($78.26) defines near-term support above its 200 DMA line and prior lows in the $71-72 area. Fundamentals remain strong. It reported earnings +30% on +24% sales revenues for the Mar '18 quarter, its 4th consecutive quarterly earnings increase above the +25% minimum guideline (C criteria). PYPL was last shown in this FSU section on 4/27/18 with an annotated graph under the headline, "Slumping Near Important Near-Term Support". It was highlighted in yellow in the 2/01/18 mid-day report (read here) while testing support at prior highs and its 10 week moving average line.
Very encouraging sales revenues and earnings growth rate acceleration was noted in prior sequential quarterly comparisons, making it a better match with the fact-based investment system's winning models.Sales revenues rose by +17%, +18%, +21%, and +26% in the Mar, Jun, Sep, Dec '17 quarters, respectively, versus the year ago periods. Its annual earnings (A criteria) history has been very strong and steady.
The high-ranked Finance - Credit Card/Payment Processing firm saw the number of top-rated funds owning its shares rise from 2,054 in Mar '17 to 2,436 in Mar '18, a reassuring sign concerning the I criteria. Its current Up/Down Volume Ratio of 1.6 is an unbiased indication its shares have been nearly neutral concerning accumulation/distribution over the past 50 days. It has a Timeliness Rating of A and Sponsorship Rating of B.
Charts courtesy wwwstockcharts.com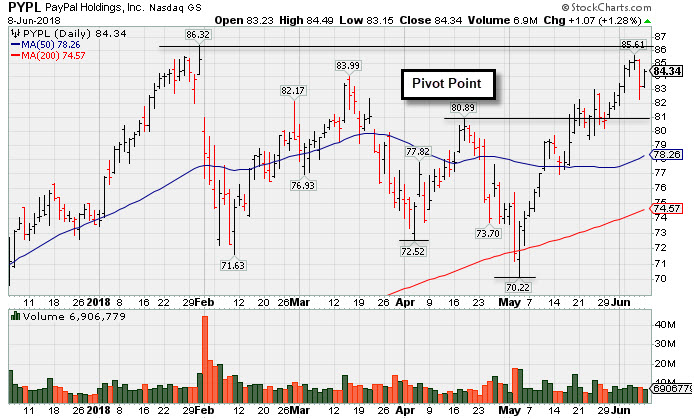
Slumping Near Important Near-Term Support - Friday, April 27, 2018
Paypal Holdings Inc (PYPL -$1.90 or -2.50% to $74.13) slumped and has been struggling below its 50-day moving average (DMA) line ($78.13) raising concerns. Prior lows in the $71-72 area define important near-term support along with its 200 DMA line ($71.60), and more damaging losses would trigger technical sell signals. A rebound above the 50 DMA line is needed for its outlook to improveFundamentals remain strong. It reported earnings +30% on +24% sales revenues for the Mar '18 quarter, its 4th consecutive quarterly earnings increase above the +25% minimum guideline (C criteria). PYPL was last shown in this FSU section on 3/27/18 with an annotated graph under the headline, "Sputtering Below 50-Day Moving Average Again". It was highlighted in yellow in the 2/01/18 mid-day report (read here) while testing support at prior highs and its 10 week moving average line.
Very encouraging sales revenues and earnings growth rate acceleration was noted in prior sequential quarterly comparisons, making it a better match with the fact-based investment system's winning models.Sales revenues rose by +17%, +18%, +21%, and +26% in the Mar, Jun, Sep, Dec '17 quarters, respectively, versus the year ago periods. Its annual earnings (A criteria) history has been very strong and steady.
The high-ranked Finance - Credit Card/Payment Processing firm saw the number of top-rated funds owning its shares rise from 2,054 in Mar '17 to 2,408 in Mar '18, a reassuring sign concerning the I criteria. Its current Up/Down Volume Ratio of 1.1 is an unbiased indication its shares have been nearly neutral concerning accumulation/distribution over the past 50 days. It has a Timeliness Rating of B and Sponsorship Rating of B.
Charts courtesy wwwstockcharts.com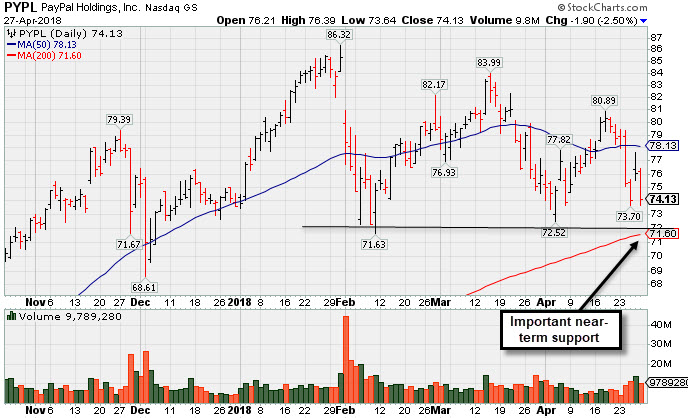
Sputtering Below 50-Day Moving Average Again - Tuesday, March 27, 2018
Paypal Holdings Inc (PYPL -$2.64 or -3.34% to $76.31) met resistance and slumped further below its 50-day moving average (DMA) line ($79.67) with a big loss on light volume today. The prior low ($71.63 on 2/09/18) defines the next important support level where a violation would raise concerns and trigger a more worrisome technical sell signal.Fundamentals remain strong. It was last shown in this FSU section on 2/26/18 with an annotated graph under the headline, "Quietly Consolidating Back Above 50-Day Moving Average". It was highlighted in yellow in the 2/01/18 mid-day report (read here) while testing support at prior highs and its 10 week moving average line.
Sales revenues rose by +17%, +18%, +21%, and +26% in the Mar, Jun, Sep, Dec '17 quarters, respectively, versus the year ago periods. This is very encouraging sales revenues and earnings growth rate acceleration in sequential quarterly comparisons, making it a better match with the fact-based investment system's winning models. Its annual earnings (A criteria) history has been very strong and steady. It reported earnings +31% on +26% sales revenues for the Dec '17 quarter, its 3rd consecutive quarterly earnings increase above the +25% minimum guideline (C criteria).
The high-ranked Finance - Credit Card/Payment Processing firm saw the number of top-rated funds owning its shares rise from 2,054 in Mar '17 to 2,413 in Dec '17, a reassuring sign concerning the I criteria. Its current Up/Down Volume Ratio of 1.0 is an unbiased indication its shares have been neutral concerning accumulation/distribution over the past 50 days. It has a Timeliness Rating of A and Sponsorship Rating of B.
Charts courtesy wwwstockcharts.com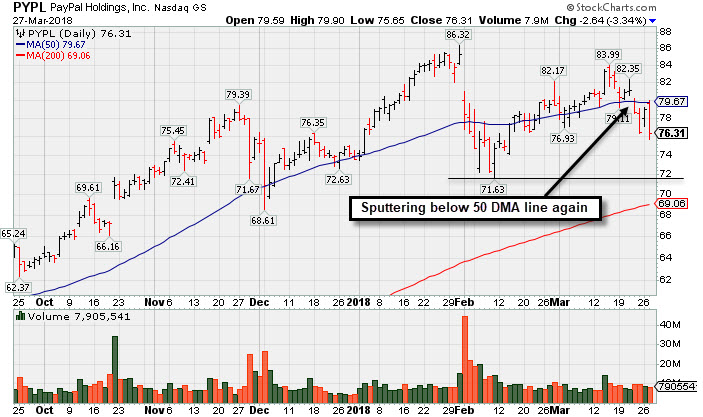
Quietly Consolidating Back Above 50-Day Moving Average - Monday, February 26, 2018
Paypal Holdings Inc (PYPL -$0.34 or -0.43% to $79.35) is quietly consolidating above its 50-day moving average (DMA) line ($78.02). Subsequent losses below the recent low ($71.63 on 2/09/18) would raise concerns and trigger a more worrisome technical sell signal.It was last shown in this FSU section on 2/01/18 with an annotated graph under the headline, " Gap Down Following Earnings News Tests Important Support Level". It was highlighted in yellow in the 2/01/18 mid-day report (read here) while testing support at prior highs and its 10 week moving average line.
Sales revenues rose by +17%, +18%, +21%, and +26% in the Mar, Jun, Sep, Dec '17 quarters, respectively, versus the year ago periods. This is very encouraging sales revenues and earnings growth rate acceleration in sequential quarterly comparisons, making it a better match with the fact-based investment system's winning models. Its annual earnings (A criteria) history has been very strong and steady. It reported earnings +31% on +26% sales revenues for the Dec '17 quarter, its 3rd consecutive quarterly earnings increase above the +25% minimum guideline (C criteria).
The high-ranked Finance - Credit Card/Payment Processing firm saw the number of top-rated funds owning its shares rise from 2,054 in Mar '17 to 2,392 in Dec '17, a reassuring sign concerning the I criteria. Its current Up/Down Volume Ratio of 1.3 is an unbiased indication its shares have been under accumulation over the past 50 days. It has a Timeliness Rating of A and Sponsorship Rating of B.
Charts courtesy wwwstockcharts.com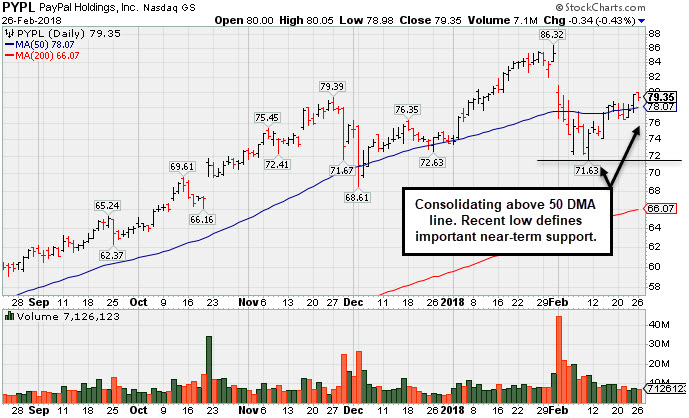
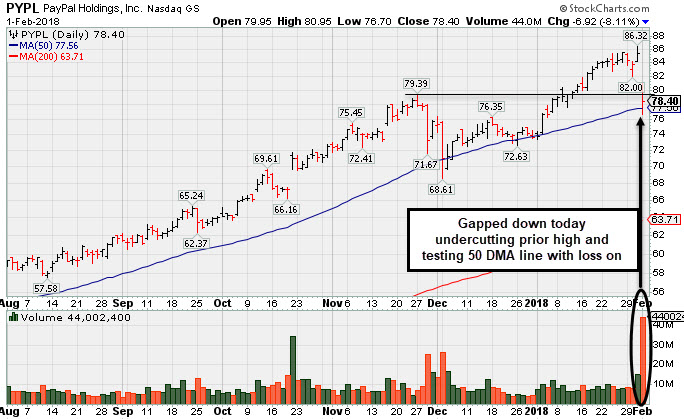
Gap Down Following Earnings News Tests Important Support Level - Thursday, February 1, 2018
Paypal Holdings Inc (PYPL -$6.92 or -8.11% to $78.40) gapped down today undercutting its prior high and testing support at its 50-day moving average (DMA) line ($77.56). It was highlighted in yellow in the earlier mid-day report (read here) while testing support at prior highs and its 10 week moving average line ($78.00). The well-known digital payments firm is featured at a "secondary buy point" following a breakout in recent weeks from a flat base above its 50-day moving average (DMA) line. More damaging losses, however, may trigger a technical sell signal.Sales revenues rose by +17%, +18%, +21%, and +26% in the Mar, Jun, Sep, Dec '17 quarters, respectively, versus the year ago periods. This is very encouraging sales revenues and earnings growth rate acceleration in sequential quarterly comparisons, making it a better match with the fact-based investment system's winning models. Its annual earnings (A criteria) history has been very strong and steady. It reported earnings +31% on +26% sales revenues for the Dec '17 quarter, its 3rd consecutive quarterly earnings increase above the +25% minimum guideline (C criteria).
The high-ranked Finance - Credit Card/Payment Processing firm saw the number of top-rated funds owning its shares rise from 2,056 in Mar '17 to 2,351 in Dec '17, a reassuring sign concerning the I criteria. Its current Up/Down Volume Ratio of 1.3 is an unbiased indication its shares have been under accumulation over the past 50 days. It has a Timeliness Rating of A and Sponsorship Rating of B.
Charts courtesy wwwstockcharts.com