Rallied But Slumped Back Near 50-Day Moving Average - Tuesday, May 28, 2019
Finished Strong After Featured Again in Mid-Day Report - Thursday, April 11, 2019
Consolidating Near 50-Day Moving Average After Finding Support - Wednesday, November 14, 2018
Sputtering Below 50-Day Moving Average Near Prior High - Thursday, October 25, 2018
Retreating After +138% Rally in Under 12 Months - Tuesday, October 2, 2018
Volume Totals Cooling While Perched Near Record High - Thursday, August 16, 2018
Hovering Near Record High After Big Gap Up and Volume-Driven Gain - Monday, June 25, 2018
Trading Near 50-Day Average After Falling Into Prior Base - Monday, May 7, 2018
Quietly Hovering Near All-Time High - Thursday, April 5, 2018
Retailer Rebounding Within Striking Distance of Prior High - Friday, March 9, 2018
Rebound Above 50-day Moving Average is Needed to Help Outlook - Monday, February 12, 2018
Consolidating After Negating Breakout From Advanced Base - Wednesday, January 17, 2018
Retail - Discount & Variety Firm Has Strong Fundamentals - Tuesday, December 19, 2017
Getting Extended From Prior Base With Earnings News Due - Friday, November 24, 2017
Prior Highs Define Important Support While Consolidating - Tuesday, October 31, 2017
Finished Strong With Above Average Volume Behind Big Gain - Friday, October 6, 2017
Retail - Discount & Variety Firm Perched Near Highs - Friday, June 2, 2017
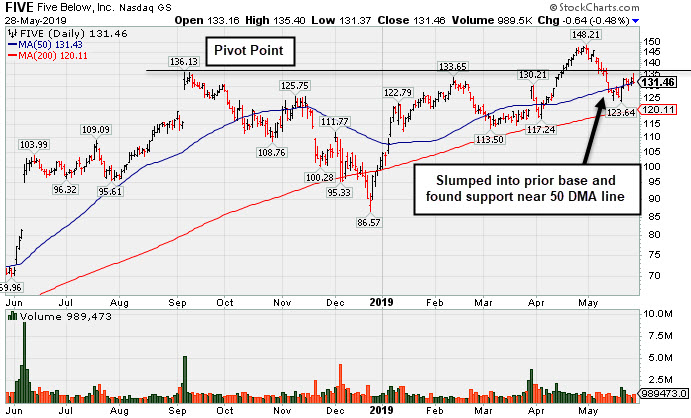
Rallied But Slumped Back Near 50-Day Moving Average - Tuesday, May 28, 2019
Five Below Inc (FIVE -$0.64 or -0.48% to $131.46) is consolidating near its 50-day moving average (DMA) line ($131.43). Below that important short-term average, the recent low ($123.64 on 5/20/19) defines important near-term support above its 200 DMA line. It has sputtered in recent weeks, but made good progress for a couple of weeks after finishing strong when highlighted in yellow with new pivot point cited based on its 2/12/19 high plus 10 cents in the 4/11/19 mid-day report (read here). It was last shown in this FSU section on 4/11/19 with an annotated graph under the headline, "Finished Strong After Featured Again in Mid-Day Report".
Recently it reported earnings +34% on +19% sales revenues for the Jan '19 quarter versus the year ago period. Three of the past 4 quarterly earnings comparisons had increases above the +25% minimum guideline (C criteria). The Retail - Discount & Variety firm has a 97 Earnings Per Share Rating and matches the fact-based investment system's winning models with a good annual earnings (A criteria) track record.
It traded up as much as +159% since highlighted in yellow with new pivot point cited based on its 5/19/17 high plus 10 cents in the 10/06/17 mid-day report (read here). Its current Up/Down Volume Ratio of 1.4 is an unbiased indication its shares have been under accumulation over the past 50 days. Its current Timeliness Rating is A and its Sponsorship Rating is B.
FIVE had a choppy history since its $17 IPO in July 2012 and 3 subsequent Secondary Offerings. It still has a small supply of 55.8 million shares outstanding (S criteria), which can lead to greater price volatility in the event of institutional buying or selling. The number of top-rated funds owning its shares rose from 465 in Sep '17 to 687 in Mar '19, a reassuring sign concerning the I criteria.
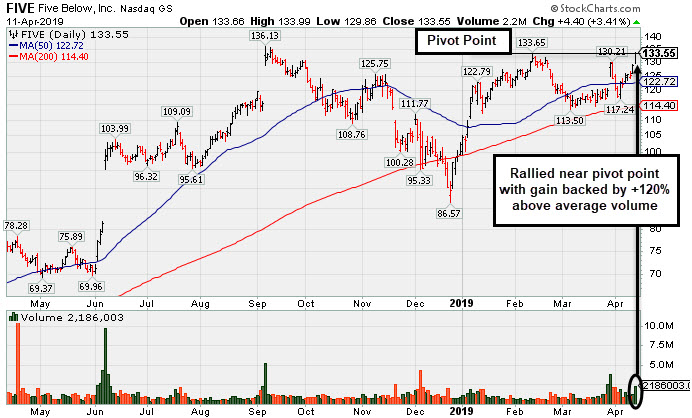
Finished Strong After Featured Again in Mid-Day Report - Thursday, April 11, 2019
Five Below Inc (FIVE +$0.67 or 0.55% to $122.88) finished strong after highlighted in yellow with new pivot point cited based on its 2/12/19 high plus 10 cents in the earlier mid-day report. It went through a deep consolidation since dropped from the Featured Stocks list on 11/27/18. Subsequent gains backed by at least +40% above average volume and a strong close above the pivot point may clinch a technical buy signal. It faces very little resistance due to overhead supply up to the $136 level.
Recently it reported earnings +34% on +19% sales revenues for the Jan '19 quarter versus the year ago period. Three of the past 4 quarterly earnings comparisons had increases above the +25% minimum guideline (C criteria). The Retail - Discount & Variety firm has a 95 Earnings Per Share Rating and matches the fact-based investment system's winning models with a good annual earnings (A criteria) track record.
Its current Up/Down Volume Ratio of 1.0 is an unbiased indication its shares have been neutral concerning accumulation/distribution over the past 50 days. Its current Timeliness Rating is B and its Sponsorship Rating is B. FIVE was last shown in this FSU section on 11/14/18 with an annotated graph under the headline, "Consolidating Near 50-Day Moving Average After Finding Support". It traded up as much as +138% since highlighted in yellow with new pivot point cited based on its 5/19/17 high plus 10 cents in the 10/06/17 mid-day report (read here).
FIVE had a choppy history since its $17 IPO in July 2012 and 3 subsequent Secondary Offerings. It still has a small supply of 55.8 million shares outstanding (S criteria), which can lead to greater price volatility in the event of institutional buying or selling. The number of top-rated funds owning its shares rose from 465 in Sep '17 to 679 in Mar '19, a reassuring sign concerning the I criteria.
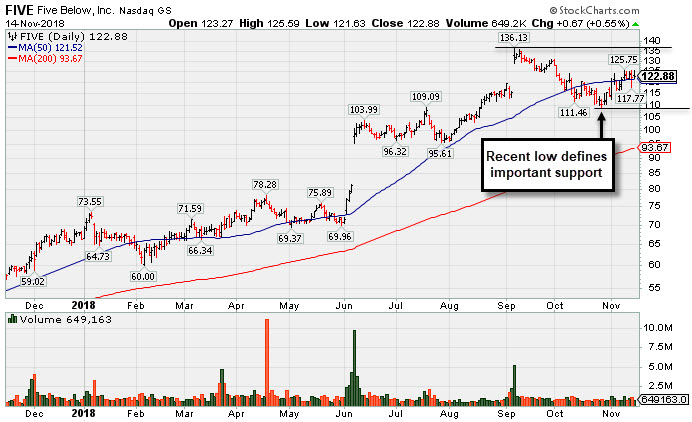
Consolidating Near 50-Day Moving Average After Finding Support - Wednesday, November 14, 2018
Five Below Inc (FIVE +$0.67 or 0.55% to $122.88) posted another small gain today while consolidating above its 50-day moving average (DMA) line ($121.53). It still faces resistance due to overhead supply up to the $136 level. It found support near the prior high, but subsequent losses below the recent low ($108.76 on 10/26/18) would raise serious concerns.
Earnings rose +40% on +23% sales revenues for the Jul '18 quarter, continuing its strong earnings track record as 9 of the past 10 quarterly comparisons versus the year ago periods showed earnings increases above the +25% minimum guideline (C criteria). The Retail - Discount & Variety firm has a 98 Earnings Per Share Rating and matches the fact-based investment system's winning models with a good annual earnings (A criteria) track record.
Its current Up/Down Volume Ratio of 1.2 is an unbiased indication its shares have been under accumulation over the past 50 days. Its current Timeliness Rating is A and its Sponsorship Rating is B. FIVE was last shown in this FSU section on 10/25/18 with an annotated graph under the headline, "Sputtering Below 50-Day Moving Average Near Prior High". It traded up as much as +138% since highlighted in yellow with new pivot point cited based on its 5/19/17 high plus 10 cents in the 10/06/17 mid-day report (read here).
FIVE had a choppy history since its $17 IPO in July 2012 and 3 subsequent Secondary Offerings. It still has a small supply of 55.7 million shares outstanding (S criteria), which can lead to greater price volatility in the event of institutional buying or selling. The number of top-rated funds owning its shares rose from 465 in Sep '17 to 606 in Sep '18, a reassuring sign concerning the I criteria.
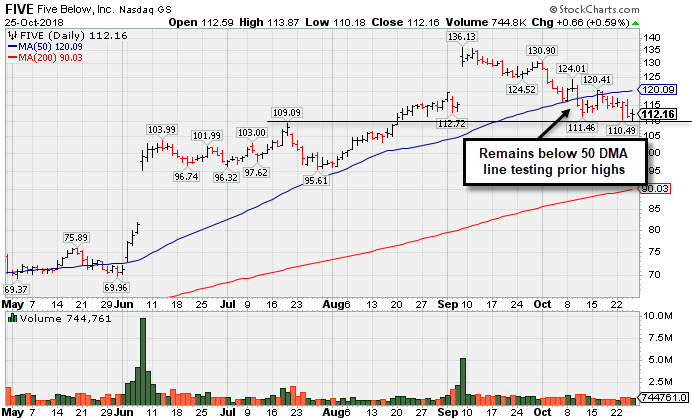
Sputtering Below 50-Day Moving Average Near Prior High - Thursday, October 25, 2018
Five Below Inc (FIVE +$0.66 or +0.59% to $112.16) is still sputtering below its 50-day moving average (DMA) line ($120.09). A rebound above the 50 DMA line is needed for its outlook to improve. The prior high ($109.09 on 7/19/18) defines the next important support level to watch.
Earnings rose +40% on +23% sales revenues for the Jul '18 quarter, continuing its strong earnings track record as 9 of the past 10 quarterly comparisons versus the year ago periods showed earnings increases above the +25% minimum guideline (C criteria). The Retail - Discount & Variety firm has a 98 Earnings Per Share Rating and matches the fact-based investment system's winning models with a good annual earnings (A criteria) track record.
Its current Up/Down Volume Ratio of 1.4 is an unbiased indication its shares have been under accumulation over the past 50 days. Its current Timeliness Rating is A and its Sponsorship Rating is B. FIVE was last shown in this FSU section on 10/02/18 with an annotated graph under the headline, "Retreating After +138% Rally in Under 12 Months". It traded up as much as +138% since highlighted in yellow with new pivot point cited based on its 5/19/17 high plus 10 cents in the 10/06/17 mid-day report (read here).
FIVE had a choppy history since its $17 IPO in July 2012 and 3 subsequent Secondary Offerings. It still has a small supply of 55.7 million shares outstanding (S criteria), which can lead to greater price volatility in the event of institutional buying or selling. The number of top-rated funds owning its shares rose from 465 in Sep '17 to 590 in Sep '18, a reassuring sign concerning the I criteria.
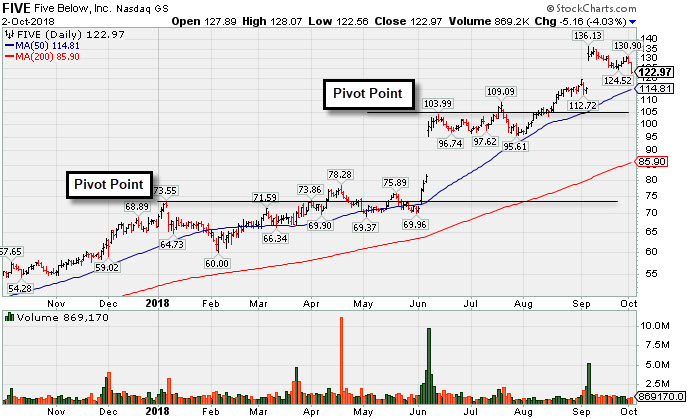
Retreating After +138% Rally in Under 12 Months - Tuesday, October 2, 2018
Five Below Inc (FIVE -$5.16 or -4.03% to $122.97) fell to a 3 week low, slumping toward its 50-day moving average (DMA) line ($114.81) and prior high ($109.09 on 7/19/18) which define important near-term support to watch.
Earnings rose +40% on +23% sales revenues for the Jul '18 quarter, continuing its strong earnings track record as 9 of the past 10 quarterly comparisons versus the year ago periods showed earnings increases above the +25% minimum guideline (C criteria). The Retail - Discount & Variety firm has a 98 Earnings Per Share Rating and matches the fact-based investment system's winning models with a good annual earnings (A criteria) track record.
Its current Up/Down Volume Ratio of 2.1 is an unbiased indication its shares have been under accumulation over the past 50 days. Its current Timeliness Rating is A and its Sponsorship Rating is B. FIVE was last shown in this FSU section on 8/16/18 with an annotated graph under the headline, "Volume Totals Cooling While Perched Near Record High". It gapped up on 9/07/18 and traded up as much as +138% since highlighted in yellow with new pivot point cited based on its 5/19/17 high plus 10 cents in the 10/06/17 mid-day report (read here).
FIVE had a choppy history since its $17 IPO in July 2012 and 3 subsequent Secondary Offerings. It still has a small supply of 55.7 million shares outstanding (S criteria), which can lead to greater price volatility in the event of institutional buying or selling. The number of top-rated funds owning its shares rose from 465 in Sep '17 to 547 in Jun '18, a reassuring sign concerning the I criteria.
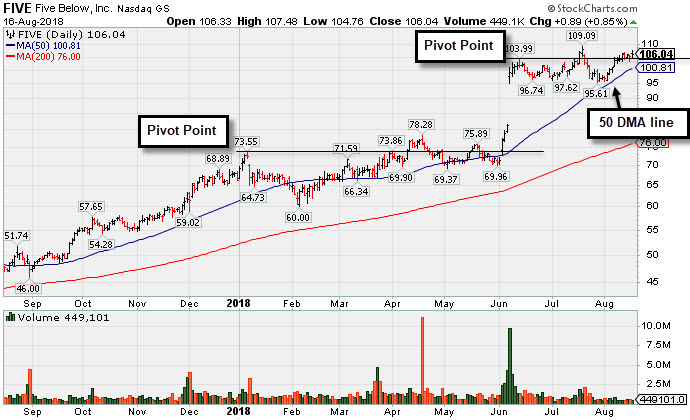
Volume Totals Cooling While Perched Near Record High - Thursday, August 16, 2018
Five Below Inc's (FIVE +$0.89 or +0.85% to $106.04) volume totals have been cooling and it is quietly perched within close striking distance of its prior high. Its 50-day moving average (DMA) line ($100.81) defines near-term support above prior lows in the $95-96 area. Subsequent confirming gains above the pivot point must have a minimum of +40% above average volume to trigger a proper new (or add-on) technical buy signal.
Fundamentals have been very strong. It reported earnings +133% on +27% sales revenues for the Apr '18 quarter, continuing its strong earnings track record as 8 of the past 9 quarterly comparisons versus the year ago periods showed earnings increases above the +25% minimum guideline (C criteria). The Retail - Discount & Variety firm has a 98 Earnings Per Share Rating and matches the fact-based investment system's winning models with a good annual earnings (A criteria) track record.
Its current Up/Down Volume Ratio of 2.0 is an unbiased indication its shares have been under accumulation over the past 50 days. Its current Timeliness Rating is A and its Sponsorship Rating is B. FIVE held its ground since last shown in this FSU section on 6/25/18 with an annotated graph under the headline, "Hovering Near Record High After Big Gap Up and Volume-Driven Gain". It has traded up as much as +90.1% since highlighted in yellow with new pivot point cited based on its 5/19/17 high plus 10 cents in the 10/06/17 mid-day report (read here).
FIVE had a choppy history since its $17 IPO in July 2012 and 3 subsequent Secondary Offerings. It still has a small supply of 55.6 million shares outstanding (S criteria), which can lead to greater price volatility in the event of institutional buying or selling. The number of top-rated funds owning its shares rose from 465 in Sep '17 to 551 in Jun '18, a reassuring sign concerning the I criteria.
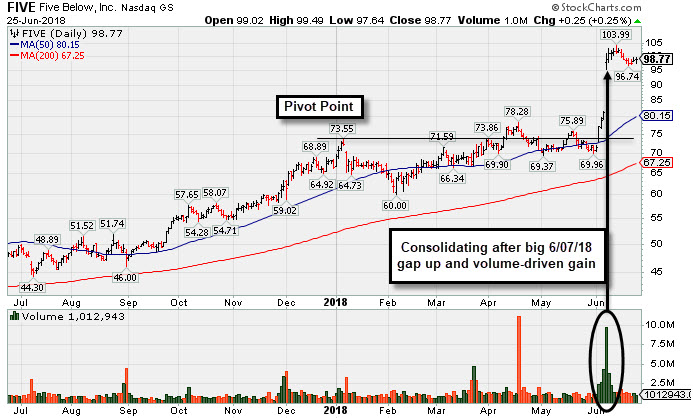
Hovering Near Record High After Big Gap Up and Volume-Driven Gain - Monday, June 25, 2018
Five Below Inc's (FIVE +$0.25 or +0.25% to $98.77) volume totals have been cooling while hovering near its all-time high, very extended from the previously noted base. Disciplined investors avoid chasing stocks that are too extended from a sound base.
Fundamentals have been very strong. It reported earnings +133% on +27% sales revenues for the Apr '18 quarter, continuing its strong earnings track record as 8 of the past 9 quarterly comparisons versus the year ago periods showed earnings increases above the +25% minimum guideline (C criteria). The Retail - Discount & Variety firm has a highest possible 99 Earnings Per Share Rating and matches the fact-based investment system's winning models with a good annual earnings (A criteria) track record.
Its current Up/Down Volume Ratio of 1.1 is an unbiased indication its shares have nearly neutral concerning accumulation/distribution over the past 50 days. Its current Timeliness Rating is A and its Sponsorship Rating is B. FIVE gapped up on 6/07/18 and rallied to new highs with considerable gains since last shown in this FSU section on 5/07/18 with an annotated graph under the headline, "Trading Near 50-Day Average After Falling Into Prior Base". It has traded up as much as +82% since highlighted in yellow with new pivot point cited based on its 5/19/17 high plus 10 cents in the 10/06/17 mid-day report (read here).
FIVE had a choppy history since its $17 IPO in July 2012 and 3 subsequent Secondary Offerings. It still has a small supply of 55.6 million shares outstanding (S criteria), which can lead to greater price volatility in the event of institutional buying or selling. The number of top-rated funds owning its shares rose from 465 in Sep '17 to 501 in Mar '18, a reassuring sign concerning the I criteria.
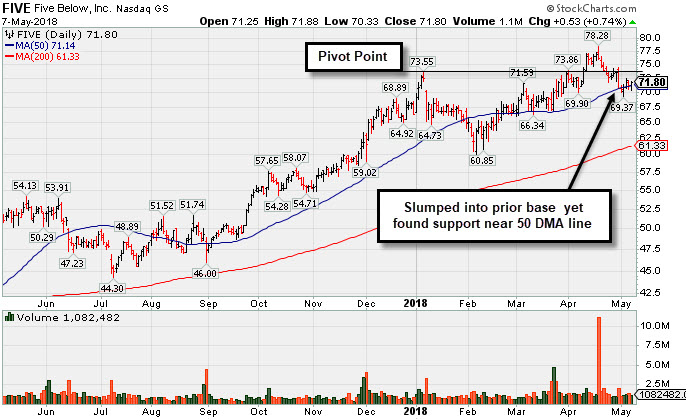
Trading Near 50-Day Average After Falling Into Prior Base - Monday, May 7, 2018
Five Below Inc (FIVE +$0.53 or +0.74% to $71.80) has recently sputtered below prior highs and into the prior base raising concerns. It has been finding support near its 50-day moving average (DMA) line ($71.14). More damaging losses may trigger a more worrisome technical sell signal. Its current Up/Down Volume Ratio of 0.7 is an unbiased indication its shares have been neutral concerning accumulation/distribution over the past 50 days. Its current Timeliness Rating is C and its Sponsorship Rating is C.
FIVE rallied to new highs but encountered distributional pressure since last shown in this FSU section on 4/05/18 with an annotated graph under the headline, "Quietly Hovering Near All-Time High". It has traded up as much as +37% since highlighted in yellow with new pivot point cited based on its 5/19/17 high plus 10 cents in the 10/06/17 mid-day report (read here).
Fundamentals have been very strong. Recently it reported earnings +31% on +30% sales revenues for the Jan '18 quarter, continuing its strong earnings track record as 7 of the past 8 quarterly comparisons versus the year ago periods showed earnings increases above the +25% minimum guideline (C criteria). The Retail - Discount & Variety firm has a 97 Earnings Per Share Rating and matches the fact-based investment system's winning models with a good annual earnings (A criteria) track record.
FIVE had a choppy history since its $17 IPO in July 2012 and 3 subsequent Secondary Offerings. It still has a small supply of 55.5 million shares outstanding (S criteria), which can lead to greater price volatility in the event of institutional buying or selling. The number of top-rated funds owning its shares rose from 465 in Sep '17 to 489 in Mar '18, a reassuring sign concerning the I criteria.
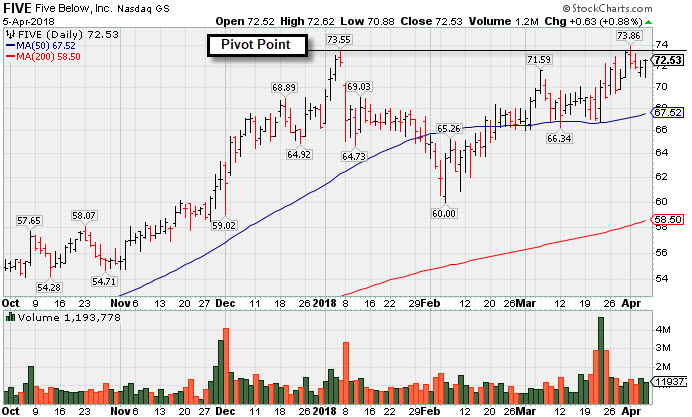
Quietly Hovering Near All-Time High - Thursday, April 5, 2018
Five Below Inc (FIVE +$0.63 or +0.88% to $72.53) is quietly perched near its all-time high. It touched a new high on 4/02/18 but finished lower. A new pivot point has been cited based on its 1/05/18 high plus 10 cents. Gains above the stock's pivot point with at least +40% above average volume are needed to trigger a proper new (or add-on) technical buy signal. The 50-day moving average (DMA) line ($67.52) and then the recent low ($60.00 on 2/06/18) define the next important near-term support levels to watch on pullbacks.
FIVE has made gradual progress since last shown in this FSU section on 3/09/18 with an annotated graph under the headline, "Retailer Rebounding Within Striking Distance of Prior High"
. It has traded up as much as +29.2% since highlighted in yellow with new pivot point cited based on its 5/19/17 high plus 10 cents in the 10/06/17 mid-day report (read here).
Recently it reported earnings +31% on +30% sales revenues for the Jan '18 quarter, continuing its strong earnings track record. Fundamentals have been very strong as it reported earnings +80% on +29% sales revenues for the Oct '17 quarter. The Retail - Discount & Variety firm has a 98 Earnings Per Share Rating and matches the fact-based investment system's winning models with a good annual earnings (A criteria) track record.
FIVE had a choppy history since its $17 IPO in July 2012 and 3 subsequent Secondary Offerings. It has a small supply of 55.5 million shares outstanding (S criteria). Its current Timeliness Rating is B and its Sponsorship Rating is B.
The number of top-rated funds owning its shares rose from 465 in Sep '17 to 472 in Mar '18, a reassuring sign concerning the I criteria. Its current Up/Down Volume Ratio of 1.0 is an unbiased indication its shares have been neutral concerning accumulation/distribution over the past 50 days.
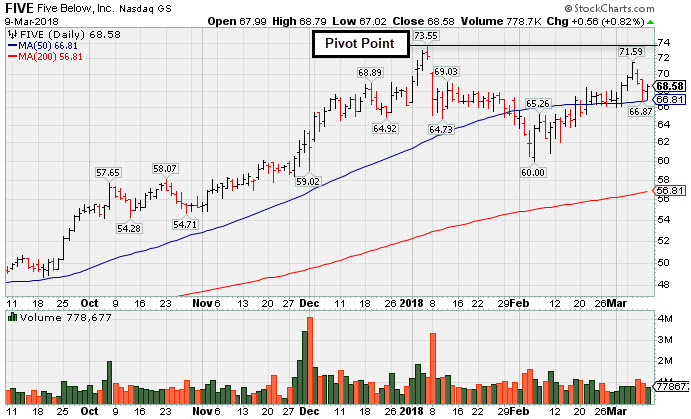
Retailer Rebounding Within Striking Distance of Prior High - Friday, March 9, 2018
Five Below Inc (FIVE +0.56 or +0.82% to $68.58) is consolidating above its 50-day moving average (DMA) line ($66.74). A new pivot point has been cited based on its 1/05/18 high plus 10 cents. Subsequent volume-driven gains for new highs may trigger a new (or add-on) technical buy signal. The recent low ($60.00 on 2/06/18) defines the next important near-term support to watch on pullbacks.
FIVE has made gradual progress since last shown in this FSU section on 2/12/18 with an annotated graph under the headline, "Rebound Above 50-day Moving Average is Needed to Help Outlook". Five Below traded up as much as +44.89% since highlighted in yellow with new pivot point cited based on its 5/19/17 high plus 10 cents in the 10/06/17 mid-day report (read here).
It is due to report earnings news an March 21st. Volume and volatility often increase near earnings news. Fundamentals have been very strong as it reported earnings +80% on +29% sales revenues for the Oct '17 quarter, continuing its strong earnings track record. The Retail - Discount & Variety firm has a highest possible 99 Earnings Per Share Rating and matches the fact-based investment system's winning models with a good annual earnings (A criteria) track record. It has been showing acceleration in sales revenues and earnings in sequential quarterly comparisons.
FIVE had a choppy history since its $17 IPO in July 2012 and 3 subsequent Secondary Offerings. It has a small supply of 55.2 million shares outstanding (S criteria). Its current Timeliness Rating is A and its Sponsorship Rating is C.
The number of top-rated funds owning its shares rose from 432 in Jun '16 to 471 in Dec '17, a reassuring sign concerning the I criteria. Its current Up/Down Volume Ratio of 1.0 is an unbiased indication its shares have been neutral concerning accumulation/distribution over the past 50 days.
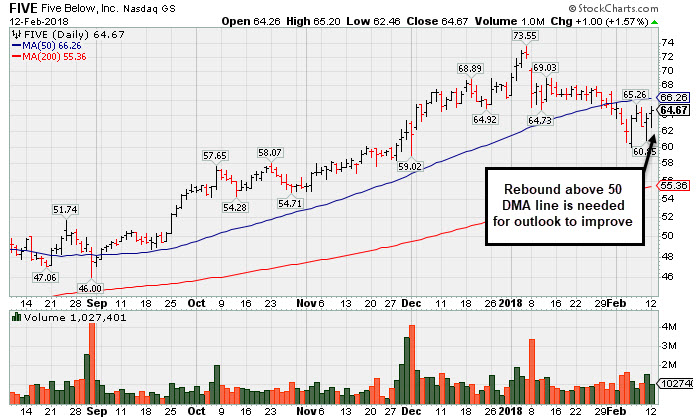
Rebound Above 50-day Moving Average is Needed to Help Outlook - Monday, February 12, 2018
Five Below Inc (FIVE +$1.00 or +1.57% to $64.67) posted a gain with below average volume today. A rebound above the 50-day moving average (DMA) line ($66.26) is needed to help its outlook improve. Weak action on 1/08/18 negated a recent breakout from an advanced "3 weeks tight" base.
FIVE was last shown in this FSU section on 1/17/18 with an annotated graph under the headline, "Consolidating After Negating Breakout From Advanced Base". The subsequent slump below the prior low ($64.73 on 1/10/18) and below its 50-day moving average (DMA) line triggered technical sell signals.
Five Below has traded up as much as +44.89% since highlighted in yellow with new pivot point cited based on its 5/19/17 high plus 10 cents in the 10/06/17 mid-day report (read here). Fundamentals remain very strong as it reported earnings +80% on +29% sales revenues for the Oct '17 quarter, continuing its strong earnings track record. The Retail - Discount & Variety firm has a highest possible 99 Earnings Per Share Rating and matches the fact-based investment system's winning models with a good annual earnings (A criteria) track record. It has been showing acceleration in sales revenues and earnings in sequential quarterly comparisons.
FIVE had a choppy history since its $17 IPO in July 2012 and 3 subsequent Secondary Offerings. It has a small supply of 55.2 million shares outstanding (S criteria). Its current Timeliness Rating is A and its Sponsorship Rating is C. The number of top-rated funds owning its shares rose from 432 in Jun '16 to 460 in Dec '17, a reassuring sign concerning the I criteria. Its current Up/Down Volume Ratio of 1.1 is an unbiased indication its shares have been under slight accumulation over the past 50 days.
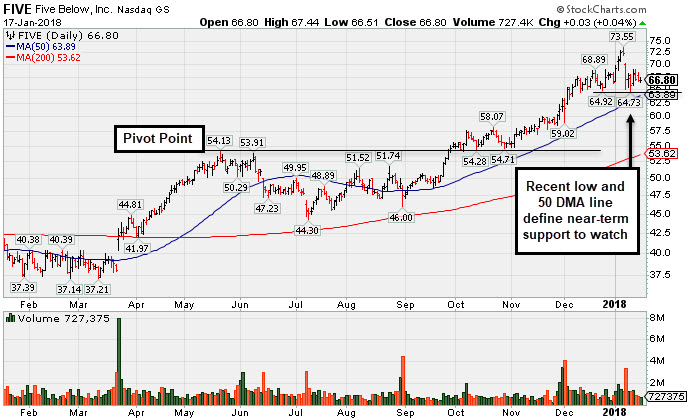
Consolidating After Negating Breakout From Advanced Base - Wednesday, January 17, 2018
Five Below Inc (FIVE +$0.03 or +0.04% to $66.80) is consolidating after weak action on 1/08/18 negated a recent breakout from an advanced "3 weeks tight" base. The recent low ($64.73 on 1/10/18) defines important near term support above its 50-day moving average (DMA) line ($63.98) where damaging losses may trigger technical sell signals.
FIVE was last shown in this FSU section on 12/19/17 with an annotated graph under the headline, "Retail - Discount & Variety Firm Has Strong Fundamentals". It has traded up as much as +44.89% since highlighted in yellow with new pivot point cited based on its 5/19/17 high plus 10 cents in the 10/06/17 mid-day report (read here).
Fundamentals remain very strong as it reported earnings +80% on +29% sales revenues for the Oct '17 quarter, continuing its strong earnings track record. The Retail - Discount & Variety firm has a highest possible 99 Earnings Per Share Rating and matches the fact-based investment system's winning models with a good annual earnings (A criteria) track record. It has been showing acceleration in sales revenues and earnings in sequential quarterly comparisons.
FIVE had a choppy history since its $17 IPO in July 2012 and 3 subsequent Secondary Offerings. It has a small supply of 55.2 million shares outstanding (S criteria). Its current Timeliness Rating is A and its Sponsorship Rating is C. The number of top-rated funds owning its shares rose from 432 in Jun '16 to 460 in Dec '17, a reassuring sign concerning the I criteria. Its current Up/Down Volume Ratio of 1.5 is an unbiased indication its shares have been under slight accumulation over the past 50 days.
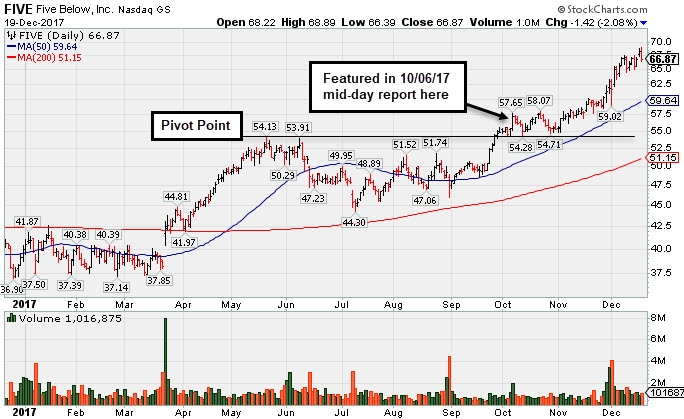
Retail - Discount & Variety Firm Has Strong Fundamentals - Tuesday, December 19, 2017
Five Below Inc (FIVE -$1.42 or -2.08% to $66.87) touched a new all-time high today but reversed into the red. It is very extended from its prior base. Its 50-day moving average (DMA) line ($59.64) defines support above prior highs in the $57-58 area.
Fundamentals remain strong as it reported earnings +80% on +29% sales revenues for the Oct '17 quarter, continuing its strong earnings track record. The Retail - Discount & Variety firm has a highest possible 99 Earnings Per Share Rating and matches the fact-based investment system's winning models with a good annual earnings (A criteria) track record.It has been showing acceleration in sales revenues and earnings in sequential quarterly comparisons.
FIVE was last shown in this FSU section on 11/24/17 with an annotated graph under the headline, "Getting Extended From Prior Base With Earnings News Due ". It has traded up as much as +20.58% since highlighted in yellow with new pivot point cited based on its 5/19/17 high plus 10 cents in the 10/06/17 mid-day report (read here).
FIVE had a choppy history since its $17 IPO in July 2012 and 3 subsequent Secondary Offerings. It has a small supply of 55.2 million shares outstanding (S criteria). Its current Timeliness Rating is A and its Sponsorship Rating is B. The number of top-rated funds owning its shares rose from 432 in Jun '16 to 473 in Sep '17, a reassuring sign concerning the I criteria. Its current Up/Down Volume Ratio of 1.4 is an unbiased indication its shares have been under slight accumulation over the past 50 days.
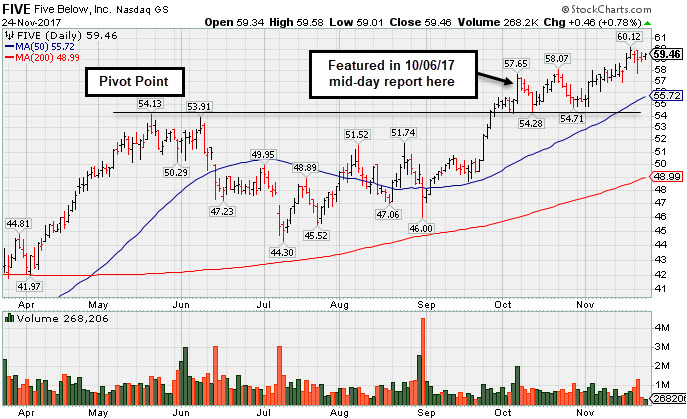
Getting Extended From Prior Base With Earnings News Due - Friday, November 24, 2017
Five Below Inc (FIVE +$0.46 or +0.78% to $59.46) is perched near its all-time high, extended from its prior base. Its 50-day moving average (DMA) line ($55.72) and prior low ($54.71 on 10/27/17) define near-term support to watch on pullbacks.
FIVE was last shown in this FSU section on 10/31/17 with an annotated graph under the headline, "Prior Highs Define Important Support While Consolidating". It finished strong after highlighted in yellow with new pivot point cited based on its 5/19/17 high plus 10 cents in the 10/06/17 mid-day report (read here).
The Retail - Discount & Variety firm has a highest possible 99 Earnings Per Share Rating. It is due to report Oct '17 quarterly results after the close on Thursday, 11/30/17. Volume and volatility often increase near earnings news. It has been showing acceleration in sales revenues and earnings in sequential quarterly comparisons through Jul '17. Earnings rose +67% on +29% sales revenues for the Jul '17 quarter, and 3 of the past 4 earnings increases were above the +25% minimum guideline (C criteria), helping it better match the fact-based investment system's winning models. It has a good annual earnings (A criteria) track record.
FIVE had a choppy history since its $17 IPO in July 2012 and 3 subsequent Secondary Offerings. It has a small supply of 55.2 million shares outstanding (S criteria). Its current Timeliness Rating is A and its Sponsorship Rating is C. The number of top-rated funds owning its shares rose from 432 in Jun '16 to 472 in Sep '17, a reassuring sign concerning the I criteria. Its current Up/Down Volume Ratio of 1.6 is an unbiased indication its shares have been under slight accumulation over the past 50 days.
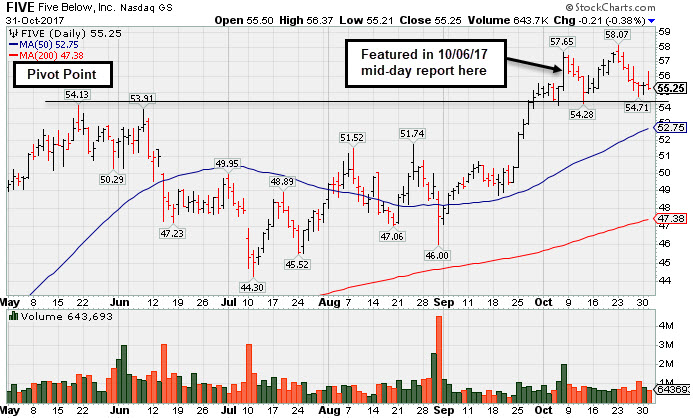
Prior Highs Define Important Support While Consolidating - Tuesday, October 31, 2017
Five Below Inc (FIVE -$0.21 or -0.38% to $55.25) is consolidating above prior highs in the $54 area defining initial support to watch above its 50-day moving average (DMA) line ($52.75).
It was last shown in this FSU section on 10/06/17 with an annotated graph under the headline, "Finished Strong With Above Average Volume Behind Big Gain". It finished strong after highlighted in yellow with new pivot point cited based on its 5/19/17 high plus 10 cents in the earlier mid-day report.
Quarterly and annual earnings history (C and A criteria) has been strong. Also showing acceleration in sales revenues and earnings in sequential quarterly comparisons through Jul '17..
The Retail - Discount & Variety firm has a 99 Earnings Per Share Rating. It posted earnings +67% on +29% sales revenues for the Jul '17 quarter, and 3 of the past 4 earnings increases were above the +25% minimum guideline (C criteria), helping it better match the fact-based investment system's winning models. It has a good annual earnings (A criteria) track record.
FIVE had a choppy history since its $17 IPO in July 2012 and 3 subsequent Secondary Offerings. It has a small supply of 55.2 million shares outstanding (S criteria). Its current Timeliness Rating is A and its Sponsorship Rating is B. The number of top-rated funds owning its shares rose from 432 in Jun '16 to 479 in Jun '17, a reassuring sign concerning the I criteria. Its current Up/Down Volume Ratio of 1.6 is an unbiased indication its shares have been under slight accumulation over the past 50 days.
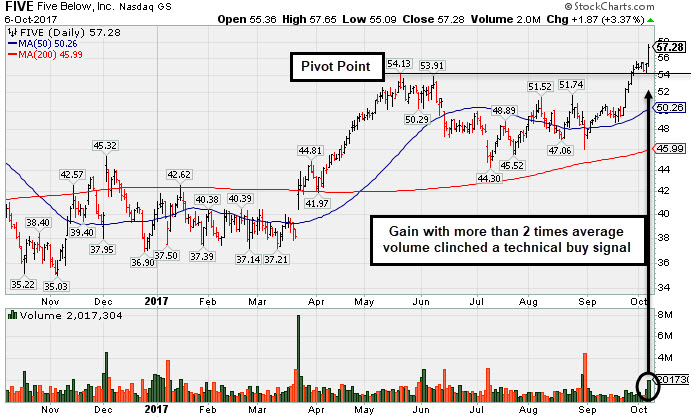
Finished Strong With Above Average Volume Behind Big Gain - Friday, October 6, 2017
Five Below Inc (FIVE +$1.87 or +3.37% to $57.28) finished strong after highlighted in yellow with new pivot point cited based on its 5/19/17 high plus 10 cents in the earlier mid-day report. Recent gains above the prior high lacked great volume conviction. Today's gain was backed by +130% above average volume, having the look of heavier institutional buying demand, however it is getting extended from the latest base
Found support above its 200 DMA line during its consolidation and rebounded since dropped from the Featured Stocks list on 6/27/17. Quarterly and annual earnings history (C and A criteria) has been strong. Also showing acceleration in sales revenues and earnings in sequential quarterly comparisons through Jul '17..
The Retail - Discount & Variety firm has a 99 Earnings Per Share Rating. It posted earnings +67% on +29% sales revenues for the Jul '17 quarter, and 3 of the past 4 earnings increases were above the +25% minimum guideline (C criteria), helping it better match the fact-based investment system's winning models. It has a good annual earnings (A criteria) track record.
FIVE had a choppy history since its $17 IPO in July 2012 and 3 subsequent Secondary Offerings. It has a small supply of 55.2 million shares outstanding (S criteria). Its current Timeliness Rating is A and its Sponsorship Rating is B. The number of top-rated funds owning its shares rose from 432 in Jun '16 to 478 in Jun '17, a reassuring sign concerning the I criteria. Its current Up/Down Volume Ratio of 1.5 is an unbiased indication its shares have been under slight accumulation over the past 50 days.
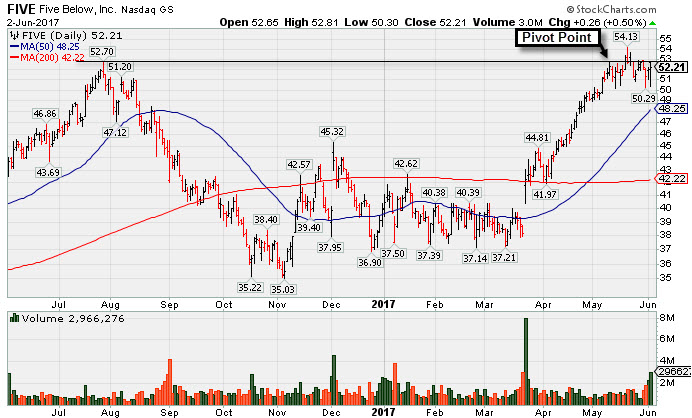
Retail - Discount & Variety Firm Perched Near Highs - Friday, June 2, 2017
Five Below Inc (FIVE +$0.26 or +0.50% to $52.21) was highlighted in yellow with pivot point cited based on its 5/10/17 high in the earlier mid-day report (read here). A convincing volume-driven gain above the pivot point is still needed to clinch a proper technical buy signal.
The Retail - Discount & Variety firm has a 96 Earnings Per Share Rating. It posted earnings +25% on +21% sales revenues for the Apr '17 quarter, and 3 of the past 4 earnings increases were above the +25% minimum guideline (C criteria), helping it better match the fact-based investment system's winning models. It has a good annual earnings (A criteria) track record.
FIVE had a choppy history since its $17 IPO in July 2012 and 3 subsequent Secondary Offerings. It has a small supply of 55.1 million shares outstanding (S criteria). Its current Timeliness Rating is C and its Sponsorship Rating is also C. The number of top-rated funds owning its shares rose from 432 in Jun '16 to 464 in Mar '17, a reassuring sign concerning the I criteria. Its current Up/Down Volume Ratio of 1.8 is an unbiased indication its shares have been under slight accumulation over the past 50 days.