You are not logged in.
This means you
CAN ONLY VIEW reports that were published prior to Wednesday, March 12, 2025.
You
MUST UPGRADE YOUR MEMBERSHIP if you want to see any current reports.
AFTER MARKET UPDATE - THURSDAY, AUGUST 18TH, 2022
Previous After Market Report Next After Market Report >>>
|
|
|
|
DOW |
+18.72 |
33,999.04 |
+0.06% |
|
Volume |
678,134,634 |
-13% |
|
Volume |
4,605,696,200 |
-10% |
|
NASDAQ |
+27.22 |
12,965.34 |
+0.21% |
|
Advancers |
1,780 |
59% |
|
Advancers |
2,306 |
53% |
|
S&P 500 |
+9.70 |
4,283.74 |
+0.23% |
|
Decliners |
1,259 |
41% |
|
Decliners |
2,034 |
47% |
|
Russell 2000 |
+13.41 |
2,000.73 |
+0.68% |
|
52 Wk Highs |
55 |
|
|
52 Wk Highs |
79 |
|
|
S&P 600 |
+10.68 |
1,291.22 |
+0.83% |
|
52 Wk Lows |
30 |
|
|
52 Wk Lows |
73 |
|
|
 |
Leadership Improved as Major Indices Posted Small Gains
Kenneth J. Gruneisen - Passed the CAN SLIM® Master's Exam
The S&P 500 rose 0.2%, aiming for its fifth consecutive weekly gain, which would match its longest winning streak since November 2021. The Dow added 18 points, while the Nasdaq Composite advanced 0.2%. The volume totals reported were mixed, lighter than the prior session on the NYSE and higher on the Nasdaq exchange. Advancers led decliners by a 3-2 margin on the NYSE but advancers only led by a narrow margin on the Nasdaq exchange. There were 33 high-ranked companies from the Leaders List that hit new 52-week highs and were listed on the BreakOuts Page, nearly doubling the total of 17 on the prior session. New 52-week highs outnumbered new 52-week lows on the NYSE and on the Nasdaq exchange. The market is in a confirmed uptrend (M criteria). Any sustainable rally requires a healthy crop of leading stocks hitting new highs, so the recent improvement in leadership was a reassuring sign.
Chart courtesy of www.stockcharts.com%20on%20Tuesday.%20Yesterday,%20the%20broad%20benchmark%20eclipsed%20the%204,300%20level%20for%20the%20first%20time%20since%20late%20April.%20The%20Nasdaq%20Composite%20fell%201.3%%20amid%20weakness%20in%20mega-cap%20tech%20shares.%20The%20volume%20totals%20reported%20were%20mixed,%20lighter%20than%20the%20prior%20session%20on%20the%20NYSE%20and%20higher%20on%20the%20Nasdaq%20exchange.%20Decliners%20led%20advancers%20by%20a%204-1%20margin%20on%20the%20NYSE%20ad%20by%20a%203-1%20margin%20on%20the%20Nasdaq%20exchange.%20There%20were%2017%20high-ranked%20companies%20from%20the%20Leaders%20List%20that%20hit%20new%2052-week%20highs%20and%20were%20listed%20on%20the%20BreakOuts%20Page,%20down%20from%20the%20total%20of%2045%20on%20the%20prior%20session.%20New%2052-week%20highs%20outnumbered%20new%2052-week%20lows%20on%20the%20NYSE,%20but%20new%20lows%20outnumbered%20new%20highs%20on%20the%20Nasdaq%20exchange.%20The%20market%20is%20in%20a%20confirmed%20uptrend%20(M%20criteria).%20Any%20sustainable%20rally%20requires%20a%20healthy%20crop%20of%20leading%20stocks%20hitting%20new%20highs,%20so%20the%20recent%20improvement%20in%20leadership%20was%20a%20reassuring%20sign.) 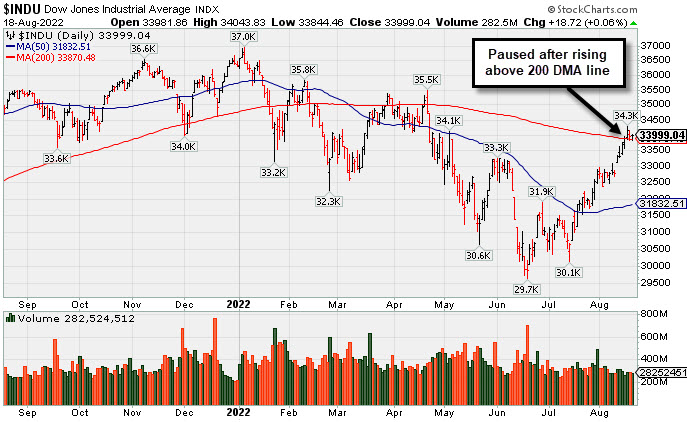 PICTURED: The Dow Jones Industrial Average paused after rising above its downward sloping 200-day moving average (DMA) line.
U.S. stocks finished higher on Thursday after struggling for direction as Wall Street weighed data, earnings, and the likely path of Federal Reserve (Fed) rate hikes. Trading volume was roughly 20% below the average of the past 30 days, which exacerbated volatility.
On the data front, weekly initial jobless claims fell to 250,000, ebbing for the first time in three weeks. Separately, the Philadelphia Fed’s business outlook unexpectedly expanded for the first time since May. Existing home sales fell for a sixth straight month, down 5.9% in July, to its lowest point since May 2020, while the leading index of economic indicators dipped 0.4% during the same period.
In earnings, Cisco Systems Inc. (CSCO +5.81%) gapped up following upbeat results that included a top and bottom line beat and better-than-expected guidance as supply chain disruptions begin to abate. Kohl’s Corp. (KSS -7.72%) fell after the department store retailer slashed its full-year outlook as inflation dents customer buying power.
Oil climbed for a second day as yesterday’s government inventory report showing strong U.S. fuel consumption supported bullish sentiment and alleviated recessionary concerns. Treasuries strengthened, with the yield on the 10-year note down two basis points (0.02%) to 2.87%, while a gauge of the U.S. dollar jumped 0.8%. In central bank news, the latest commentary from regional Fed officials continued to reiterate the need for further rate increases in order to rein in inflation. |
 Kenneth J. Gruneisen started out as a licensed stockbroker in August 1987, a couple of months prior to the historic stock market crash that took the Dow Jones Industrial Average down -22.6% in a single day. He has published daily fact-based fundamental and technical analysis on high-ranked stocks online for two decades. Through FACTBASEDINVESTING.COM, Kenneth provides educational articles, news, market commentary, and other information regarding proven investment systems that work in good times and bad.
Comments contained in the body of this report are technical opinions only and are not necessarily those of Gruneisen Growth Corp. The material herein has been obtained from sources believed to be reliable and accurate, however, its accuracy and completeness cannot be guaranteed. Our firm, employees, and customers may effect transactions, including transactions contrary to any recommendation herein, or have positions in the securities mentioned herein or options with respect thereto. Any recommendation contained in this report may not be suitable for all investors and it is not to be deemed an offer or solicitation on our part with respect to the purchase or sale of any securities. |
|
 |
Semiconductor, Networking, and Commodity-Linked Groups Rose
Kenneth J. Gruneisen - Passed the CAN SLIM® Master's Exam
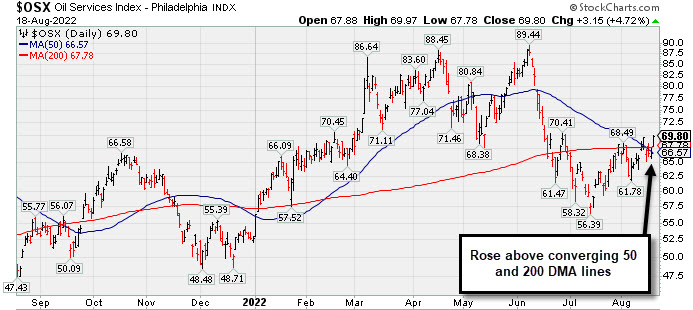
The tech sector saw big gains from the Semiconductor Index ($SOX +2.28%) and the Networking Index ($NWX +2.90%) while the Biotech Index ($BTK -0.69%) finished with a modest loss on the session. Commodity-linked groups had a positive bias as the Oil Services Index ($OSX +4.72%) and Integrated Oil Index ($XOI +2.19%) both posted solid gains while the Gold & Silver Index ($XAU +0.69%) edged higher. Remarkably unchanged for the day were the Broker/Dealer Index ($XBD -0.03%), Bank Index ($BKX -0.01%), and the Retail Index ($RLX -0.02%).
PICTURED: The Oil Services Index ($OSX +4.72%) posted a solid gain and rose above its converging 50-day and 200-day moving average (DMA) lines.
| Oil Services |
$OSX |
69.80 |
+3.15 |
+4.72% |
+32.40% |
| Integrated Oil |
$XOI |
1,627.94 |
+34.96 |
+2.19% |
+38.17% |
| Semiconductor |
$SOX |
3,037.84 |
+67.72 |
+2.28% |
-23.02% |
| Networking |
$NWX |
856.31 |
+24.16 |
+2.90% |
-11.82% |
| Broker/Dealer |
$XBD |
468.32 |
-0.13 |
-0.03% |
-3.81% |
| Retail |
$RLX |
3,586.75 |
-0.88 |
-0.02% |
-15.14% |
| Gold & Silver |
$XAU |
106.73 |
+0.73 |
+0.69% |
-19.41% |
| Bank |
$BKX |
114.38 |
-0.01 |
-0.01% |
-13.49% |
| Biotech |
$BTK |
4,929.23 |
-34.33 |
-0.69% |
-10.68% |
|
|
|
 |
Earnings Report Below +25% Minimum and Encountering Distributional Pressure
Kenneth J. Gruneisen - Passed the CAN SLIM® Master's Exam
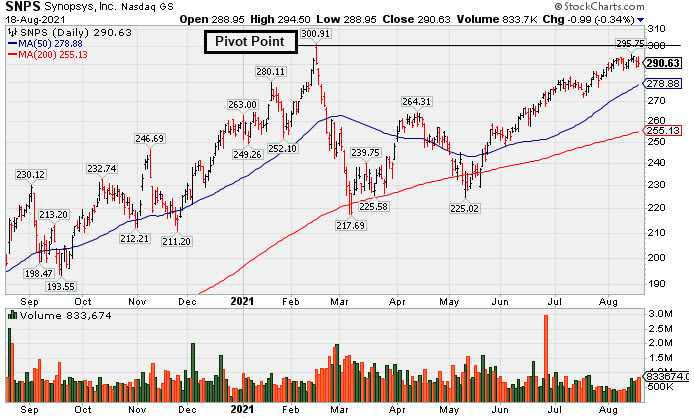
Synopsys Inc (SNPS -$7.68 or -2.02% to $373.32) churned heavy volume for a 2nd consecutive session while retreating from its all-time high, enduring distributional pressure. It was highlighted in yellow in the 8/17/22 mid-day report with pivot point cited based on its 12/28/21 high plus 10 cents (read here). However, it reported Jul '22 quarterly earnings +16% on +18% sales revenues versus the year ago period, below the +25% minimum earnings guideline (C criteria), raising fundamental concerns. Volume and volatility often increase near earnings news.
SNPS has a 95 Earnings Per Share Rating. It may still be worth keeping an eye on. Subsequent gains above the pivot point backed by at least +40% above average volume may help clinch a convincing technical buy signal. Earnings for the Jan and Apr '22 quarters versus the year ago periods were well above the +25% minimum guideline (C criteria). Annual earnings (A criteria) history has been strong and steady.
The number of top-rated funds owning its shares rose from 1,993 in Sep '20 to 2,563 in Jun '22, a reassuring sign concerning the I criteria. Its current Up/Down Volume Ratio of 1.6 is an unbiased indication its shares have been under accumulation over the past 50 days. It has a Timeliness Rating of A and Sponsorship Rating of B. |
|
|
Color Codes Explained :
Y - Better candidates highlighted by our
staff of experts.
G - Previously featured
in past reports as yellow but may no longer be buyable under the
guidelines.
***Last / Change / Volume data in this table is the closing quote data***
Symbol/Exchange
Company Name
Industry Group |
PRICE |
CHANGE
(%Change) |
Day High |
Volume
(% DAV)
(% 50 day avg vol) |
52 Wk Hi
% From Hi |
Featured
Date |
Price
Featured |
Pivot Featured |
|
Max Buy |
 IMXI
-
NASDAQ
IMXI
-
NASDAQ
International Money Exp
Financial Svcs-Specialty
|
$25.99
|
+0.64
2.52% |
$26.23
|
486,065
94.38% of 50 DAV
50 DAV is 515,000
|
$26.11
-0.46%
|
7/1/2022
|
$21.27
|
PP = $21.38
|
|
MB = $22.45
|
Most Recent Note - 8/16/2022 6:13:52 PM
G - Perched near its all-time high, extended from the previously noted base. Prior highs in the $22 area and its 50 DMA line ($22.13) define important near-term support to watch. Reported Jun '22 quarterly earnings +21% on +17% sales revenues versus the year ago period, below the +25% minimum earnings guideline (C criteria).
>>> FEATURED STOCK ARTICLE : Finished Strong With Another Volume-Driven Gain After Earnings - 8/3/2022 |
View all notes |
Set NEW NOTE alert |
Company Profile |
SEC
News |
Chart |
Request a new note
C
A
S
I |
HRMY
-
NASDAQ
Harmony Biosciences Holdings
Medical-Biomed/Biotech
|
$46.34
|
-0.21
-0.45% |
$48.15
|
672,286
115.06% of 50 DAV
50 DAV is 584,300
|
$57.13
-18.89%
|
7/6/2022
|
$54.12
|
PP = $52.85
|
|
MB = $55.49
|
Most Recent Note - 8/17/2022 10:33:59 AM
G - Color code is changed to green after it gapped down today violating its 50 DMA line ($50.56) and prior low ($48.85) with a damaging loss raising concerns and triggering a technical sell signal. Only a prompt rebound above the 50 DMA line would help its outlook improve. Met stubborn resistance in the $57 area after reporting Jun '22 quarterly earnings +54% on +45% sales revenues versus the year ago period.
>>> FEATURED STOCK ARTICLE : Churning Higher Volume While Perched Near High After Earnings News - 8/4/2022 |
View all notes |
Set NEW NOTE alert |
Company Profile |
SEC
News |
Chart |
Request a new note
C
A
S
I |
CI
-
NYSE
Cigna Corp
Medical-Managed Care
|
$290.89
|
-0.71
-0.24% |
$292.16
|
1,842,038
91.24% of 50 DAV
50 DAV is 2,019,000
|
$293.50
-0.89%
|
7/7/2022
|
$276.55
|
PP = $273.68
|
|
MB = $287.36
|
Most Recent Note - 8/16/2022 6:19:29 PM
G - Hovering at its all-time high holding its ground after rising above its "max buy" level. Reported earnings for the Jun '22 quarter rose +19% on +5% sales revenues versus the year ago period, breaking a streak of 3 quarterly earnings increases above the +25% minimum guideline (C criteria), raising concerns. Near-term support to watch is at its 50 DMA line ($269.11).
>>> FEATURED STOCK ARTICLE : Wedging Higher With Lighter Volume Behind Gain for New High - 8/9/2022 |
View all notes |
Set NEW NOTE alert |
Company Profile |
SEC
News |
Chart |
Request a new note
C
A
S
I |
AN
-
NYSE
Autonation Inc
SPECIALTY RETAIL - Auto Dealerships
|
$126.64
|
-0.56
-0.44% |
$127.21
|
325,526
45.98% of 50 DAV
50 DAV is 708,000
|
$135.57
-6.59%
|
7/20/2022
|
$122.03
|
PP = $126.49
|
|
MB = $132.81
|
Most Recent Note - 8/17/2022 4:57:27 PM
Y - Abruptly retreated today with below average volume, retesting prior highs which define initial support to watch. Big gain on the prior session backed by +46% above average volume cleared resistance in the $126 area triggering a technical buy signal. Faces no resistance due to overhead supply. Reported Jun '22 quarterly earnings +34% on -2% sales revenues versus the year ago period.
>>> FEATURED STOCK ARTICLE : Autonation Hovering Near Stubborn Resistance - 8/11/2022 |
View all notes |
Set NEW NOTE alert |
Company Profile |
SEC
News |
Chart |
Request a new note
C
A
S
I |
ESQ
-
NASDAQ
Esquire Financial Hldgs
Finance-Commercial Loans
|
$40.46
|
+0.25
0.62% |
$40.86
|
21,227
34.80% of 50 DAV
50 DAV is 61,000
|
$41.68
-2.93%
|
7/26/2022
|
$37.74
|
PP = $39.19
|
|
MB = $41.15
|
Most Recent Note - 8/16/2022 6:17:58 PM
Y - Encountered distributional pressure as there was a "negative reversal" today with +112% above average volume after hitting a new all-time high. It closed near the session low. Wedged above resistance in the $39 area with gains lacking volume conviction. Confirming gains above the pivot point backed by at least +40% above average volume may help clinch a proper technical buy signal. Its 50 DMA line ($35.51) defines important near-term support.
>>> FEATURED STOCK ARTICLE : Closed at Session High With Gain for New All-Time High - 8/12/2022 |
View all notes |
Set NEW NOTE alert |
Company Profile |
SEC
News |
Chart |
Request a new note
C
A
S
I |
Symbol/Exchange
Company Name
Industry Group |
PRICE |
CHANGE
(%Change) |
Day High |
Volume
(% DAV)
(% 50 day avg vol) |
52 Wk Hi
% From Hi |
Featured
Date |
Price
Featured |
Pivot Featured |
|
Max Buy |
GPK
-
NYSE
Graphic Packaging Hldg
CONSUMER NON-DURABLES - Packaging and Containers
|
$23.57
|
+0.22
0.94% |
$23.71
|
2,947,462
98.91% of 50 DAV
50 DAV is 2,980,000
|
$23.64
-0.30%
|
7/26/2022
|
$22.63
|
PP = $23.09
|
|
MB = $24.24
|
 Most Recent Note - 8/18/2022 5:30:34 PM
Y - Posted a gain today with average volume for a best-ever close by 3 cents. Churned heavy volume but made limited progress since its 8/10/22 breakout, action indicative of distributional pressure.
>>> FEATURED STOCK ARTICLE : Churned Heavy Volume Perched at High After 6 Straight Gains - 8/15/2022 |
View all notes |
Set NEW NOTE alert |
Company Profile |
SEC
News |
Chart |
Request a new note
C
A
S
I |
CSL
-
NYSE
Carlisle Cos Inc
Diversified Operations
|
$315.80
|
+1.73
0.55% |
$317.76
|
338,946
84.95% of 50 DAV
50 DAV is 399,000
|
$318.71
-0.91%
|
7/28/2022
|
$282.31
|
PP = $275.23
|
|
MB = $288.99
|
Most Recent Note - 8/18/2022 5:27:39 PM
G - Posted a quiet gain today, hovering at its all-time high, very extended from the previously noted base. Prior highs in the $275 area define initial support to watch on pullbacks.
>>> FEATURED STOCK ARTICLE : Carlisle Perched at All-Time High After Noted Breakout - 8/2/2022 |
View all notes |
Set NEW NOTE alert |
Company Profile |
SEC
News |
Chart |
Request a new note
C
A
S
I |
ENPH
-
NASDAQ
Enphase Energy Inc
Energy-Solar
|
$294.00
|
+0.87
0.30% |
$304.48
|
2,131,202
63.92% of 50 DAV
50 DAV is 3,334,000
|
$308.88
-4.82%
|
7/28/2022
|
$276.66
|
PP = $282.55
|
|
MB = $296.68
|
Most Recent Note - 8/16/2022 6:09:58 PM
Y - Lost ground today with average volume, and its color code is changed to yellow after pulling back below its "max buy" level. The prior high in the $282 area has been noted as initial support to watch on pullbacks. Fundamentals remain strong.
>>> FEATURED STOCK ARTICLE : Pullback Following 3 Consecutive Gains With Heavier Volume - 8/1/2022 |
View all notes |
Set NEW NOTE alert |
Company Profile |
SEC
News |
Chart |
Request a new note
C
A
S
I |
PWR
-
NYSE
Quanta Services Inc
MATERIALS and CONSTRUCTION - General Contractors
|
$144.48
|
+0.36
0.25% |
$146.30
|
572,996
45.26% of 50 DAV
50 DAV is 1,266,000
|
$146.84
-1.61%
|
7/28/2022
|
$141.83
|
PP = $140.14
|
|
MB = $147.15
|
Most Recent Note - 8/16/2022 6:06:01 PM
Y - Volume totals have been below average after recently wedging back above its pivot point since encountering some distributional pressure. Confirming volume-driven gains for new highs would be a reassuring sign of serious institutional buying demand. Fundamentals remain strong. See the latest FSU analysis for more details and a new annotated graph.
>>> FEATURED STOCK ARTICLE : Stalled After Breakout But Still Quietly Hovering Near High - 8/16/2022 |
View all notes |
Set NEW NOTE alert |
Company Profile |
SEC
News |
Chart |
Request a new note
C
A
S
I |
CLFD
-
NASDAQ
Clearfield Inc
TELECOMMUNICATIONS - Cables / Satalite Equipment
|
$122.97
|
+4.97
4.21% |
$123.32
|
249,405
77.45% of 50 DAV
50 DAV is 322,000
|
$121.88
0.89%
|
7/29/2022
|
$94.10
|
PP = $86.81
|
|
MB = $91.15
|
Most Recent Note - 8/18/2022 5:25:33 PM
G - Posted a gain with below average volume and closed near the session high. Very extended from any sound base. Prior high in the $86 area defines initial support to watch. Fundamentals remain strong.
>>> FEATURED STOCK ARTICLE : Clearfield Showed Resilience After Considerable Rally - 8/17/2022 |
View all notes |
Set NEW NOTE alert |
Company Profile |
SEC
News |
Chart |
Request a new note
C
A
S
I |
Symbol/Exchange
Company Name
Industry Group |
PRICE |
CHANGE
(%Change) |
Day High |
Volume
(% DAV)
(% 50 day avg vol) |
52 Wk Hi
% From Hi |
Featured
Date |
Price
Featured |
Pivot Featured |
|
Max Buy |
GFF
-
NYSE
Griffon Corporation
MATERIALS and CONSTRUCTION - General Building Materials
|
$33.52
|
+1.04
3.20% |
$33.60
|
225,952
49.77% of 50 DAV
50 DAV is 454,000
|
$34.35
-2.42%
|
8/8/2022
|
$32.46
|
PP = $31.12
|
|
MB = $32.68
|
Most Recent Note - 8/16/2022 6:12:21 PM
G - Pulled back today for a 3rd consecutive small loss with light volume, hovering near its 52-week high. Prior highs in the $31 area define initial support to watch on pullbacks.
>>> FEATURED STOCK ARTICLE : Breakout for New High Backed by +52% Above Average Volume - 8/8/2022 |
View all notes |
Set NEW NOTE alert |
Company Profile |
SEC
News |
Chart |
Request a new note
C
A
S
I |
CLH
-
NYSE
Clean Harbors Inc
Pollution Control
|
$118.22
|
+0.74
0.63% |
$118.39
|
230,322
71.98% of 50 DAV
50 DAV is 320,000
|
$118.92
-0.59%
|
8/10/2022
|
$111.78
|
PP = $115.10
|
|
MB = $120.86
|
Most Recent Note - 8/18/2022 5:26:44 PM
Y - Posted a quiet gain today. Gain and strong close above the pivot point backed by +116% above average volume on 8/12/22 triggered a technical buy signal. No resistance remains due to overhead supply. Fundamentals remain strong.
>>> FEATURED STOCK ARTICLE : Pollution Control Firm Perched Near Prior High - 8/10/2022 |
View all notes |
Set NEW NOTE alert |
Company Profile |
SEC
News |
Chart |
Request a new note
C
A
S
I |
SNPS
-
NASDAQ
Synopsys Inc
COMPUTER SOFTWARE and SERVICES - Technical and System Software
|
$373.32
|
-7.68
-2.02% |
$391.00
|
1,918,690
212.01% of 50 DAV
50 DAV is 905,000
|
$391.17
-4.56%
|
8/17/2022
|
$381.37
|
PP = $377.70
|
|
MB = $396.59
|
Most Recent Note - 8/18/2022 5:23:55 PM
Y - Encountering distributional pressure while pulling back from its all-time high. Highlighted in yellow in the prior mid-day report with pivot point cited based on its 12/28/21 high plus 10 cents. However, it reported Jul '22 quarterly earnings +16% on +18% sales revenues versus the year ago period, below the +25% minimum earnings guideline (C criteria), raising fundamental concerns. Volume and volatility often increase near earnings news. Subsequent gains above the pivot point backed by at least +40% above average volume may help clinch a convincing technical buy signal. See the latest FSU for more detailed analysis and a new annotated graph.
>>> FEATURED STOCK ARTICLE : Earnings Report Below +25% Minimum and Encountering Distributional Pressure - 8/18/2022 |
View all notes |
Set NEW NOTE alert |
Company Profile |
SEC
News |
Chart |
Request a new note
C
A
S
I |
|
|
|
THESE ARE NOT BUY RECOMMENDATIONS!
Comments contained in the body of this report are technical
opinions only. The material herein has been obtained
from sources believed to be reliable and accurate, however,
its accuracy and completeness cannot be guaranteed.
This site is not an investment advisor, hence it does
not endorse or recommend any securities or other investments.
Any recommendation contained in this report may not
be suitable for all investors and it is not to be deemed
an offer or solicitation on our part with respect to
the purchase or sale of any securities. All trademarks,
service marks and trade names appearing in this report
are the property of their respective owners, and are
likewise used for identification purposes only.
This report is a service available
only to active Paid Premium Members.
You may opt-out of receiving report notifications
at any time. Questions or comments may be submitted
by writing to Premium Membership Services 665 S.E. 10 Street, Suite 201 Deerfield Beach, FL 33441-5634 or by calling 1-800-965-8307
or 954-785-1121.
|
|
|