You are not logged in.
This means you
CAN ONLY VIEW reports that were published prior to Monday, February 26, 2024.
You
MUST UPGRADE YOUR MEMBERSHIP if you want to see any current reports.
AFTER MARKET UPDATE - TUESDAY, JULY 9TH, 2019
Previous After Market Report Next After Market Report >>>
|
|
|
|
DOW |
-22.65 |
26,783.49 |
-0.08% |
|
Volume |
667,572,910 |
-9% |
|
Volume |
1,838,954,442 |
-5% |
|
NASDAQ |
+43.35 |
8,141.73 |
+0.54% |
|
Advancers |
1,476 |
52% |
|
Advancers |
1,610 |
52% |
|
S&P 500 |
+3.68 |
2,979.63 |
+0.12% |
|
Decliners |
1,365 |
48% |
|
Decliners |
1,460 |
48% |
|
Russell 2000 |
+1.20 |
1,562.59 |
+0.08% |
|
52 Wk Highs |
132 |
|
|
52 Wk Highs |
77 |
|
|
S&P 600 |
-1.72 |
946.94 |
-0.18% |
|
52 Wk Lows |
42 |
|
|
52 Wk Lows |
46 |
|
|
 |
Major Indices Finished Mixed on Session
Kenneth J. Gruneisen - Passed the CAN SLIM® Master's Exam
The major averages were mixed Tuesday, as the U.S. and China resumed trade talks and investors awaited key updates from the Federal Reserve. The Dow fell 23 points, while the S&P 500 ticked up 0.1%. The Nasdaq Composite outperformed, ending the session 0.5% higher amid strength from FAANG stocks. The volume totals reported were lighter than the prior session totals on both the NYSE and on the Nasdaq exchange. Advancers narrowl led decliners on the NYSE and on the Nasdaq exchange. There were 37 high-ranked companies from the Leaders List hit new 52-week highs and were listed on the BreakOuts Page, versus the total of 39 on the prior session. New 52-week highs totals outnumbered new 52-week lows on the NYSE and Nasdaq exchange. The major indices (M criteria) are in a "confirmed uptrend" under the fact-based system. The Featured Stocks Page provides the most timely analysis on high-ranked leaders. Charts used courtesy of www.stockcharts.com
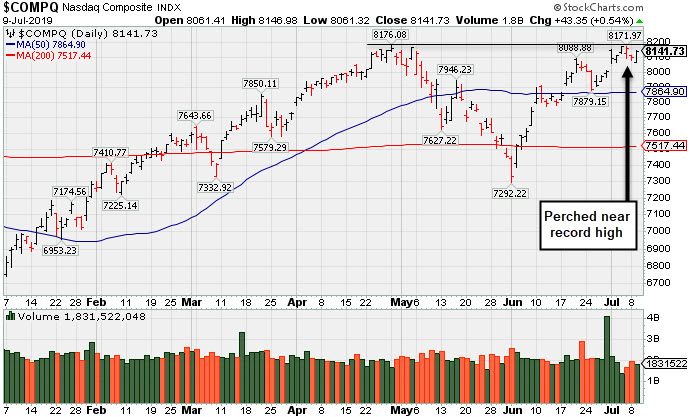
PICTURED: The Nasdaq Composite Index remains perched near its record high.
Materials stocks lagged, with Dow Inc. (DOW -1.34%) falling after German chemical maker BASF (BASFY +2.72%) issued a pessimistic forward outlook amid lingering trade concerns. The Consumer Staples group also underperformed, with PepsiCo (PEP -0.62%) fell despite topping analyst profit projections in its quarterly report this morning. In M&A news, Acacia Communications (ACIA +35.06%) gapped up after agreeing to a $2.6 billion takeover offer from Cisco Systems (CSCO +0.27%) .
Treasuries weakened, with the yield on the benchmark 10-year note rising one basis point to 2.06% ahead of key central bank updates tomorrow. The Federal Reserve will release the minutes from its June policy meeting tomorrow afternoon at 2 p.m. ET, while Fed Chair Jerome Powell is also scheduled to appear for his semi-annual testimony before Congress Wednesday and Thursday. On the data front, a report this morning showed small business optimism slipped modestly from a seven month high in June. Meanwhile, the Jobs Openings and Labor Turnover Survey (JOLTS) revealed U.S. job decreased more than expected for a second-consecutive month in May.
In commodities, WTI crude oil added 0.5% to finish at $57.96/barrel amid continued tensions between the U.S. and Iran. Gold eased 0.1%, the fifth consecutive daily decline for the yellow metal, to finish at $1399.00/ounce.
|
 Kenneth J. Gruneisen started out as a licensed stockbroker in August 1987, a couple of months prior to the historic stock market crash that took the Dow Jones Industrial Average down -22.6% in a single day. He has published daily fact-based fundamental and technical analysis on high-ranked stocks online for two decades. Through FACTBASEDINVESTING.COM, Kenneth provides educational articles, news, market commentary, and other information regarding proven investment systems that work in good times and bad.
Comments contained in the body of this report are technical opinions only and are not necessarily those of Gruneisen Growth Corp. The material herein has been obtained from sources believed to be reliable and accurate, however, its accuracy and completeness cannot be guaranteed. Our firm, employees, and customers may effect transactions, including transactions contrary to any recommendation herein, or have positions in the securities mentioned herein or options with respect thereto. Any recommendation contained in this report may not be suitable for all investors and it is not to be deemed an offer or solicitation on our part with respect to the purchase or sale of any securities. |
|
 |
Tech, Retail, and Financial Groups Rose
Kenneth J. Gruneisen - Passed the CAN SLIM® Master's Exam
The Retail Index ($RLX +0.77%), Broker/Dealer Index ($XBD +0.65%), and Bank Index ($BKX +1.58%) posted unanimous gains that lifted the major indices. The Biotech Index ($BTK +1.58%), Networking Index ($NWX +1.29%), and Semiconductor Index ($SOX +0.74%) unanimously gained ground. The Gold & Silver Index ($XAU +0.91%) rose and the Integrated Oil Index ($XOI +0.17%) also inched higher while the Oil Services Index ($OSX -0.40%) ended lower.
Charts courtesy of www.stockcharts.com
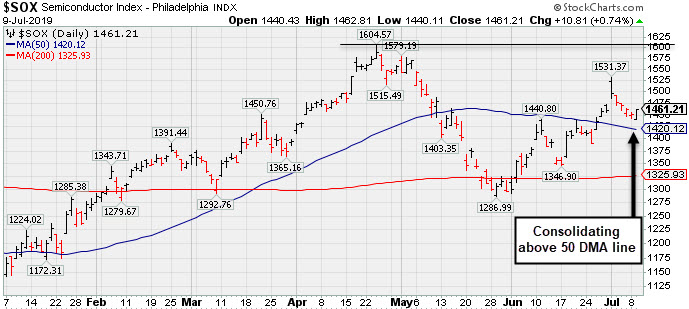 PICTURED: The Semiconductor Index ($SOX +0.74%) is consolidating above its 50-day moving average (DMA) line while rebounding toward its all-time high.
| Oil Services |
$OSX |
79.75 |
-0.32 |
-0.40% |
-1.05% |
| Integrated Oil |
$XOI |
1,262.33 |
+2.15 |
+0.17% |
+8.91% |
| Semiconductor |
$SOX |
1,461.21 |
+10.80 |
+0.74% |
+26.49% |
| Networking |
$NWX |
578.22 |
+7.34 |
+1.29% |
+18.32% |
| Broker/Dealer |
$XBD |
270.48 |
+1.75 |
+0.65% |
+13.96% |
| Retail |
$RLX |
2,443.84 |
+18.71 |
+0.77% |
+25.23% |
| Gold & Silver |
$XAU |
83.91 |
+0.76 |
+0.91% |
+18.75% |
| Bank |
$BKX |
99.22 |
+0.64 |
+0.65% |
+15.65% |
| Biotech |
$BTK |
4,758.92 |
+74.11 |
+1.58% |
+12.75% |
|
|
|
 |
Recently Sputtering Below 50-Day Moving Average
Kenneth J. Gruneisen - Passed the CAN SLIM® Master's Exam
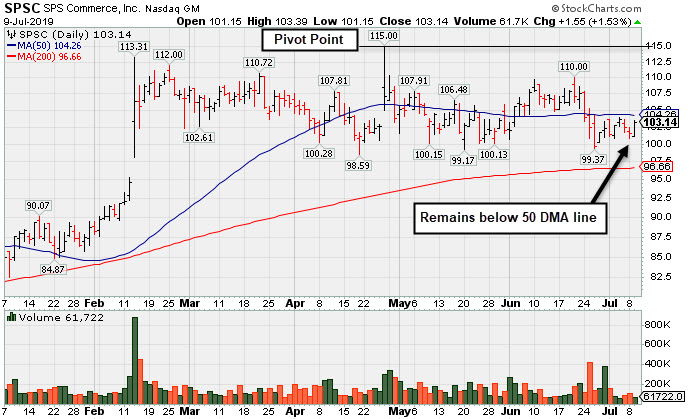
S P S Commerce Inc (SPSC +$1.55 or +1.53% to $103.14) is still sputtering below its 50-day moving average (DMA) line ($104.26). Recent lows in the $98-99 area define important near-term support to watch above its 200 DMA line (the red line). A rebound above the 50 DMA line (blue line) and subsequent volume-driven gains above the pivot point are needed to trigger a new (or add-on) technical buy signal. It faces some resistance due to overhead supply up to the $115 level.
Fundamentals remain strong. It reported earnings +54% on +13% sales revenues for the quarter ended March 31, 2019 versus the year ago period, its 6th quarterly earnings comparison above the +25% minimum guideline (C criteria). A small downturn in FY '16 earnings was previously noted as a flaw in its annual earnings (A criteria) history.
It has formed a big base-on-base pattern. It was last shown in this FSU section on 6/07/19 with an annotated graph under the headline, "Base Building Now Above 50-Day Moving Average Line" The high-ranked Computer Software firm's current Up/Down Volume Ratio of 1.3 is an unbiased indication its shares have been under slight accumulation over the past 50 days.
It completed new Public Offerings on 11/20/13 and 9/06/12. The number of top-rated funds owning its shares rose from 238 in Mar '18 to 438 in Mar '19, a reassuring sign concerning the I criteria. It has a Timeliness Rating of A and Sponsorship Rating of B. The small supply of 17.9 million shares outstanding (S criteria) can contribute to greater price volatility in the even of institutional buying or selling.
Charts courtesy of www.stockcharts.com
|
|
|
Color Codes Explained :
Y - Better candidates highlighted by our
staff of experts.
G - Previously featured
in past reports as yellow but may no longer be buyable under the
guidelines.
***Last / Change / Volume data in this table is the closing quote data***
Symbol/Exchange
Company Name
Industry Group |
PRICE |
CHANGE
(%Change) |
Day High |
Volume
(% DAV)
(% 50 day avg vol) |
52 Wk Hi
% From Hi |
Featured
Date |
Price
Featured |
Pivot Featured |
|
Max Buy |
 SPSC
-
NASDAQ
SPSC
-
NASDAQ
S P S Commerce Inc
COMPUTER SOFTWARE and SERVICES - Application Software
|
$103.14
|
+1.55
1.53% |
$103.39
|
61,722
38.82% of 50 DAV
50 DAV is 159,000
|
$115.00
-10.31%
|
6/7/2019
|
$107.72
|
PP = $115.10
|
|
MB = $120.86
|
 Most Recent Note - 7/9/2019 5:22:39 PM
G - A rebound above its 50 DMA line ($104.26) and subsequent volume-driven gains above the pivot point are needed to trigger a new (or add-on) technical buy signal. Faces some resistance due to overhead supply up to the $115 level. Fundamentals remain strong. See the latest FSU analysis for more details and a new annotated graph.
>>> FEATURED STOCK ARTICLE : Recently Sputtering Below 50-Day Moving Average - 7/9/2019 |
View all notes |
Set NEW NOTE alert |
Company Profile |
SEC
News |
Chart |
Request a new note
C
A
S
I |
EPAM
-
NYSE
Epam Systems Inc
COMPUTER SOFTWARE and SERVICES - Information Technology Service
|
$187.01
|
+2.34
1.27% |
$187.31
|
764,647
154.79% of 50 DAV
50 DAV is 494,000
|
$186.40
0.33%
|
5/9/2019
|
$169.25
|
PP = $180.55
|
|
MB = $189.58
|
Most Recent Note - 7/9/2019 12:29:38 PM
Y - Perched at its 52-week high today, on track for a 9th consecutive gain. The prior session's gain above its pivot point was backed by +62% above average volume triggering a proper new (or add-on) technical buy signal. Recently found support near its 50 DMA line ($173).
>>> FEATURED STOCK ARTICLE : Perched Near Pivot Point After a New Flat Base - 6/13/2019 |
View all notes |
Set NEW NOTE alert |
Company Profile |
SEC
News |
Chart |
Request a new note
C
A
S
I |
ENV
-
NYSE
Envestnet Inc
FINANCIAL SERVICES - Diversified Investments
|
$69.54
|
-0.24
-0.34% |
$69.69
|
161,696
59.89% of 50 DAV
50 DAV is 270,000
|
$72.67
-4.31%
|
3/15/2019
|
$66.05
|
PP = $64.90
|
|
MB = $68.15
|
Most Recent Note - 7/8/2019 4:17:37 PM
G - Consolidating above its 50 DMA line ($68.90) and perched within striking distance of its 52-week high. Prior lows in the $65-66 area define the next important near-term support to watch. Recently reported earnings +5% on +1% sales revenues for the Mar '19 quarter, below the +25% minimum earnings guideline (C criteria).
>>> FEATURED STOCK ARTICLE : Rebounded Above 50-Day Moving Average Line - 7/2/2019 |
View all notes |
Set NEW NOTE alert |
Company Profile |
SEC
News |
Chart |
Request a new note
C
A
S
I |
LHCG
-
NASDAQ
L H C Group Inc
HEALTH SERVICES - Home Health Care
|
$120.73
|
-1.67
-1.36% |
$122.86
|
279,267
124.12% of 50 DAV
50 DAV is 225,000
|
$123.10
-1.93%
|
7/1/2019
|
$110.94
|
PP = $122.20
|
|
MB = $128.31
|
Most Recent Note - 7/9/2019 12:49:41 PM
Y - Pulling back from its all-time high after wedging higher. Subsequent gains above its pivot point backed by at least +40% above average volume may trigger a new (or add-on) technical buy signal. Its 50 DMA line ($116) defines near-term support above recent lows. Fundamentals remain strong.
>>> FEATURED STOCK ARTICLE : Prior Gains Lacked Volume; 50-Day Moving Average Defines Support - 6/17/2019 |
View all notes |
Set NEW NOTE alert |
Company Profile |
SEC
News |
Chart |
Request a new note
C
A
S
I |
ENSG
-
NASDAQ
Ensign Group Inc
HEALTH SERVICES - Long-Term Care Facilities
|
$56.92
|
+0.12
0.21% |
$57.05
|
242,973
79.66% of 50 DAV
50 DAV is 305,000
|
$58.88
-3.33%
|
4/30/2019
|
$51.46
|
PP = $53.30
|
|
MB = $55.97
|
Most Recent Note - 7/8/2019 4:16:03 PM
G - Perched near its all-time high. Its 50 DMA line ($54.85) and recent low ($52.34 on 5/31/19) define near-term support to watch. Recently reported earnings +22% on +12% sales revenues for the Mar '19 quarter, below the +25% minimum earnings guideline (C criteria), raising fundamental concerns.
>>> FEATURED STOCK ARTICLE : Nursing Facility Operator Touched New High - 7/1/2019 |
View all notes |
Set NEW NOTE alert |
Company Profile |
SEC
News |
Chart |
Request a new note
C
A
S
I |
Symbol/Exchange
Company Name
Industry Group |
PRICE |
CHANGE
(%Change) |
Day High |
Volume
(% DAV)
(% 50 day avg vol) |
52 Wk Hi
% From Hi |
Featured
Date |
Price
Featured |
Pivot Featured |
|
Max Buy |
CHDN
-
NASDAQ
Churchill Downs Inc
LEISURE - Gaming Activities
|
$116.93
|
-1.28
-1.08% |
$118.71
|
135,205
43.61% of 50 DAV
50 DAV is 310,000
|
$118.89
-1.65%
|
6/5/2019
|
$108.87
|
PP = $104.96
|
|
MB = $110.21
|
Most Recent Note - 7/9/2019 12:10:30 PM
G - Holding its ground with volume totals cooling while perched at its all-time high, extended from any sound base. Its 50 DMA line ($105.65) and prior highs in the $104 area define important near-term support to watch on pullbacks. Share price was impacted by a 3:1 split when noted on 1/28/19.
>>> FEATURED STOCK ARTICLE : Consolidating Near 50-Day Moving Average - 6/29/2018 |
View all notes |
Set NEW NOTE alert |
Company Profile |
SEC
News |
Chart |
Request a new note
C
A
S
I |
WWD
-
NASDAQ
Woodward Inc
MANUFACTURING - Diversified Machinery
|
$113.80
|
-0.33
-0.29% |
$114.13
|
255,271
45.99% of 50 DAV
50 DAV is 555,000
|
$116.46
-2.28%
|
6/18/2019
|
$112.34
|
PP = $114.65
|
|
MB = $120.38
|
Most Recent Note - 7/5/2019 6:00:53 PM
Y - Posted a gain today and ended the session perched near its all-time high. Subsequent gains above the pivot point backed by at least +40% above average volume may clinch a convincing technical buy signal. Fundamentals remain strong.
>>> FEATURED STOCK ARTICLE : High Ranked Industrial Firm Perched Near All-Time High - 6/18/2019 |
View all notes |
Set NEW NOTE alert |
Company Profile |
SEC
News |
Chart |
Request a new note
C
A
S
I |
LULU
-
NASDAQ
Lululemon Athletica
MANUFACTURING - Textile Manufacturing
|
$186.05
|
-0.75
-0.40% |
$186.50
|
2,239,321
105.03% of 50 DAV
50 DAV is 2,132,000
|
$190.52
-2.35%
|
6/13/2019
|
$174.48
|
PP = $179.60
|
|
MB = $188.58
|
Most Recent Note - 7/8/2019 4:23:09 PM
Y - Found support while recently consolidating above its 50 DMA line ($175.69) which defines important support above the prior low ($160.88 on 5/29/19). Reported Apr '19 quarterly earnings +35% on +20% sales revenues versus the ear ago period.
>>> FEATURED STOCK ARTICLE : Perched Near High Following Another Strong Earnings Report - 6/14/2019 |
View all notes |
Set NEW NOTE alert |
Company Profile |
SEC
News |
Chart |
Request a new note
C
A
S
I |
ULTA
-
NASDAQ
Ulta Beauty Inc
SPECIALTY RETAIL - Specialty Retail, Other
|
$348.48
|
-4.21
-1.19% |
$353.19
|
724,811
94.50% of 50 DAV
50 DAV is 767,000
|
$365.54
-4.67%
|
3/15/2019
|
$341.27
|
PP = $322.59
|
|
MB = $338.72
|
Most Recent Note - 7/5/2019 5:57:30 PM
G - Hovering near its 50 DMA line ($343.47). Recently noted action indicative of distributional pressure after wedging higher with gains backed by lackluster volume as it touched a new all-time high. Reported earnings +17% on +13% sales revenues for the Apr '19 quarter, below the +25% minimum earnings guideline (C criteria), raising fundamental concerns. See the latest FSU analysis for more details and a new annotated graph.
>>> FEATURED STOCK ARTICLE : Stalled After Recently Wedging to New Record High - 7/5/2019 |
View all notes |
Set NEW NOTE alert |
Company Profile |
SEC
News |
Chart |
Request a new note
C
A
S
I |
CHGG
-
NYSE
Chegg Inc
Consumer Svcs-Education
|
$42.87
|
+0.08
0.19% |
$43.08
|
1,945,313
117.54% of 50 DAV
50 DAV is 1,655,000
|
$44.45
-3.55%
|
7/8/2019
|
$44.11
|
PP = $41.79
|
|
MB = $43.88
|
Most Recent Note - 7/8/2019 11:42:04 AM
Y - Color code is changed to yellow with pivot point cited based on its 3/19/19 high plus 10 cents. Hitting a new 52-week high with today's big volume-driven gain adding to a 7-day winning streak. Formed an orderly base since last noted in the 5/01/19 mid-day report - "Violated its 50 DMA line with a big volume-driven loss on the prior session. Quarterly and annual earnings (C annd A criteria) history has been strong."
>>> FEATURED STOCK ARTICLE : Tallied a Big Volume-Driven Breakout Gain for a New High - 7/8/2019 |
View all notes |
Set NEW NOTE alert |
Company Profile |
SEC
News |
Chart |
Request a new note
C
A
S
I |
Symbol/Exchange
Company Name
Industry Group |
PRICE |
CHANGE
(%Change) |
Day High |
Volume
(% DAV)
(% 50 day avg vol) |
52 Wk Hi
% From Hi |
Featured
Date |
Price
Featured |
Pivot Featured |
|
Max Buy |
ESNT
-
NYSE
Essent Group Ltd
Finance-MrtgandRel Svc
|
$48.55
|
+0.01
0.02% |
$48.73
|
429,473
69.05% of 50 DAV
50 DAV is 622,000
|
$50.51
-3.88%
|
3/18/2019
|
$45.84
|
PP = $45.06
|
|
MB = $47.31
|
Most Recent Note - 7/9/2019 11:52:21 AM
G - Consolidating above its 50 DMA line ($47.79) and very little resistance remains due to overhead supply. Recently reported earnings +15% on +20% sales revenues for the Mar '19 quarter, below the +25% minimum earnings guideline (C criteria), raising fundamental concerns.
>>> FEATURED STOCK ARTICLE : Rebounded Above 50 Day Moving Average After Violation - 7/3/2019 |
View all notes |
Set NEW NOTE alert |
Company Profile |
SEC
News |
Chart |
Request a new note
C
A
S
I |
NOW
-
NYSE
Servicenow Inc
Computer Sftwr-Enterprse
|
$298.02
|
+5.02
1.71% |
$299.12
|
1,555,574
93.60% of 50 DAV
50 DAV is 1,662,000
|
$294.62
1.15%
|
4/22/2019
|
$242.64
|
PP = $251.75
|
|
MB = $264.34
|
Most Recent Note - 7/8/2019 4:23:53 PM
G - Still perched near its all-time high, extended from an sound base. Its 50 DMA line ($272.76) defines near-term support to watch. Recently reported earnings +20% on +34% sales revenues for the Mar '19 quarter, below the +25% minimum earnings guideline (C criteria), raising fundamental concerns.
>>> FEATURED STOCK ARTICLE : Pulling Back After Wedging to New Highs - 6/26/2019 |
View all notes |
Set NEW NOTE alert |
Company Profile |
SEC
News |
Chart |
Request a new note
C
A
S
I |
VEEV
-
NYSE
Veeva Systems Inc Cl A
Computer Sftwr-Medical
|
$171.91
|
+4.04
2.41% |
$172.16
|
994,503
65.69% of 50 DAV
50 DAV is 1,514,000
|
$173.65
-1.00%
|
5/30/2019
|
$154.32
|
PP = $145.80
|
|
MB = $153.09
|
Most Recent Note - 7/9/2019 3:17:42 PM
G -Poised for a best-ever close with today's gain backed by light volume. It remains very extended from any sound base. Its prior low and 50 DMA line ($153.35) define near-term support. Reported earnings +52% on +25% sales revenues for the Apr '19 quarter, marking its 5th strong quarter with earnings above the +25% minimum guideline (C criteria).
>>> FEATURED STOCK ARTICLE : Halted Slide After 4 Volume-Driven Losses From High - 6/27/2019 |
View all notes |
Set NEW NOTE alert |
Company Profile |
SEC
News |
Chart |
Request a new note
C
A
S
I |
PAYC
-
NYSE
Paycom Software Inc
COMPUTER SOFTWARE and SERVICES - Application Software
|
$239.92
|
+0.86
0.36% |
$242.09
|
742,574
95.32% of 50 DAV
50 DAV is 779,000
|
$241.15
-0.51%
|
2/6/2019
|
$171.66
|
PP = $164.18
|
|
MB = $172.39
|
Most Recent Note - 7/9/2019 11:48:03 AM
G - Extended from any sound base and wedging into new high territory with recent gains lacking great volume conviction. Its 50 DMA line ($215) defines near-term support to watch Reported earnings +25% on +30% sales revenues for the Mar '19 quarter.
>>> FEATURED STOCK ARTICLE : Perched Near High Extended From Any Sound Base - 6/28/2019 |
View all notes |
Set NEW NOTE alert |
Company Profile |
SEC
News |
Chart |
Request a new note
C
A
S
I |
PYPL
-
NASDAQ
Paypal Holdings Inc
Finance-CrdtCard/PmtPr
|
$118.37
|
+1.42
1.21% |
$118.62
|
4,634,421
85.41% of 50 DAV
50 DAV is 5,426,000
|
$119.95
-1.32%
|
1/24/2019
|
$92.56
|
PP = $93.80
|
|
MB = $98.49
|
Most Recent Note - 7/8/2019 4:26:23 PM
G - It remains quietly perched near its all-time high. Did not form a sound base, yet promptly rebounded after violating its 50 DMA line and prior low ($106.52) on 6/03/19. Recently reported earnings +37% on +12% sales revenues for the Mar '19 quarter, continuing its strong earnings track record.
>>> FEATURED STOCK ARTICLE : Popular Payments Firm Extended From Any Sound Base - 6/19/2019 |
View all notes |
Set NEW NOTE alert |
Company Profile |
SEC
News |
Chart |
Request a new note
C
A
S
I |
Symbol/Exchange
Company Name
Industry Group |
PRICE |
CHANGE
(%Change) |
Day High |
Volume
(% DAV)
(% 50 day avg vol) |
52 Wk Hi
% From Hi |
Featured
Date |
Price
Featured |
Pivot Featured |
|
Max Buy |
PLNT
-
NYSE
Planet Fitness Inc Cl A
Leisure-Services
|
$76.30
|
-0.05
-0.07% |
$76.83
|
1,058,792
61.92% of 50 DAV
50 DAV is 1,710,000
|
$81.90
-6.84%
|
11/7/2018
|
$57.10
|
PP = $55.45
|
|
MB = $58.22
|
Most Recent Note - 7/8/2019 4:25:07 PM
G - Its 50 DMA line has acted as resistance, but a rebound above the 50 DMA line ($76.58) is needed for its outlook to improve. Fundamentals remain strong.
>>> FEATURED STOCK ARTICLE : Undercut 50-Day Moving Average With Volume Behind Losses - 6/21/2019 |
View all notes |
Set NEW NOTE alert |
Company Profile |
SEC
News |
Chart |
Request a new note
C
A
S
I |
BLD
-
NYSE
Topbuild Corp
Bldg-Constr Prds/Misc
|
$81.75
|
-0.17
-0.21% |
$82.62
|
117,123
34.86% of 50 DAV
50 DAV is 336,000
|
$86.96
-5.99%
|
5/17/2019
|
$82.19
|
PP = $87.31
|
|
MB = $91.68
|
Most Recent Note - 7/5/2019 5:59:28 PM
Y - Consolidating above support defined by its 50 DMA line ($79.27) and recent lows. Still quietly perched within striking distance of its 52-week high. Subsequent gains above the pivot point backed by at least +40% above average volume may trigger a technical buy signal. Fundamentals remain strong.
>>> FEATURED STOCK ARTICLE : Found Support at 50-Day Moving Averge Line - 6/20/2019 |
View all notes |
Set NEW NOTE alert |
Company Profile |
SEC
News |
Chart |
Request a new note
C
A
S
I |
TEAM
-
NASDAQ
Atlassian Corp Plc Cl A
Comp Sftwr-Spec Enterprs
|
$140.60
|
+2.67
1.94% |
$140.99
|
1,095,594
74.23% of 50 DAV
50 DAV is 1,476,000
|
$138.48
1.53%
|
5/24/2019
|
$129.52
|
PP = $132.09
|
|
MB = $138.69
|
Most Recent Note - 7/9/2019 3:15:40 PM
G - Color code is changed to green after quietly rising above its "max buy" level to a new all-time high. The 50 DMA line ($126) and prior low ($123.43 on 6/25/19) define important near-term support to watch. Reported earnings +133% on +38% sales revenues for the Mar '19 quarter, continuing its strong earnings track record.
>>> FEATURED STOCK ARTICLE : Perched at High After Wedging into New High Territory - 6/24/2019 |
View all notes |
Set NEW NOTE alert |
Company Profile |
SEC
News |
Chart |
Request a new note
C
A
S
I |
UPLD
-
NASDAQ
Upland Software Inc
Computer Sftwr-Enterprse
|
$47.74
|
+0.64
1.36% |
$47.80
|
232,983
39.56% of 50 DAV
50 DAV is 589,000
|
$54.87
-12.99%
|
6/10/2019
|
$53.30
|
PP = $50.74
|
|
MB = $53.28
|
Most Recent Note - 7/8/2019 4:30:16 PM
G - Its 50 DMA line ($47.19) has been acting as resistance, meanwhile, a rebound above it is needed for its outlook to improve.Completed a new Public Offering on 5/08/19. Quarterly comparisons through Mar '19 have shown impressive sales revenues growth and greatly improved earnings increases above the +25% minimum guideline (C criteria).
>>> FEATURED STOCK ARTICLE : Rose From an Advanced Ascending Base - 6/10/2019 |
View all notes |
Set NEW NOTE alert |
Company Profile |
SEC
News |
Chart |
Request a new note
C
A
S
I |
GLOB
-
NYSE
Globant SA
Computer-Tech Services
|
$105.50
|
+0.93
0.89% |
$105.67
|
257,345
60.55% of 50 DAV
50 DAV is 425,000
|
$106.15
-0.61%
|
2/15/2019
|
$69.35
|
PP = $70.00
|
|
MB = $73.50
|
Most Recent Note - 7/8/2019 4:19:22 PM
G - Perched at its all-time high following 7 consecutive gains marked by below average volume. Very extended from any sound base. Its 50 DMA line ($92.21) defines important support to watch on pullbacks. Fundamentals remain strong.
>>> FEATURED STOCK ARTICLE : Posted Big Gain for Another New High Close - 6/12/2019 |
View all notes |
Set NEW NOTE alert |
Company Profile |
SEC
News |
Chart |
Request a new note
C
A
S
I |
Symbol/Exchange
Company Name
Industry Group |
PRICE |
CHANGE
(%Change) |
Day High |
Volume
(% DAV)
(% 50 day avg vol) |
52 Wk Hi
% From Hi |
Featured
Date |
Price
Featured |
Pivot Featured |
|
Max Buy |
PAGS
-
NYSE
Pagseguro Digital Cl A
Finance-CrdtCard/PmtPr
|
$41.23
|
+0.54
1.33% |
$41.58
|
2,300,952
111.64% of 50 DAV
50 DAV is 2,061,000
|
$40.91
0.78%
|
6/25/2019
|
$37.69
|
PP = $40.07
|
|
MB = $42.07
|
Most Recent Note - 7/9/2019 11:50:49 AM
Y - Wedging into new high territory with recent gains lacking great volume conviction. It was highlighted in yellow with pivot point cited based on its 3/29/18 high plus 10 cents in the 6/25/19 mid-day report. Faces no resistance due to overhead. Gains above a stock's pivot point must have at least +40% above average volume to trigger a proper technical buy signal under the fact-based investment system.
>>> FEATURED STOCK ARTICLE : Brazilian Payment Tech Firm Perched Near High - 6/25/2019 |
View all notes |
Set NEW NOTE alert |
Company Profile |
SEC
News |
Chart |
Request a new note
C
A
S
I |
|
|
|
THESE ARE NOT BUY RECOMMENDATIONS!
Comments contained in the body of this report are technical
opinions only. The material herein has been obtained
from sources believed to be reliable and accurate, however,
its accuracy and completeness cannot be guaranteed.
This site is not an investment advisor, hence it does
not endorse or recommend any securities or other investments.
Any recommendation contained in this report may not
be suitable for all investors and it is not to be deemed
an offer or solicitation on our part with respect to
the purchase or sale of any securities. All trademarks,
service marks and trade names appearing in this report
are the property of their respective owners, and are
likewise used for identification purposes only.
This report is a service available
only to active Paid Premium Members.
You may opt-out of receiving report notifications
at any time. Questions or comments may be submitted
by writing to Premium Membership Services 665 S.E. 10 Street, Suite 201 Deerfield Beach, FL 33441-5634 or by calling 1-800-965-8307
or 954-785-1121.
|
|
|

