***Last / Change / Volume data in this table is the closing quote data***
Symbol/Exchange
Company Name
Industry Group |
PRICE |
CHANGE
(%Change) |
Day High |
Volume
(% DAV)
(% 50 day avg vol) |
52 Wk Hi
% From Hi |
Featured
Date |
Price
Featured |
Pivot Featured |
|
Max Buy |
 SPSC
-
NASDAQ
SPSC
-
NASDAQ
S P S Commerce Inc
COMPUTER SOFTWARE and SERVICES - Application Software
|
$101.59
|
-0.78
-0.76% |
$102.37
|
106,907
67.24% of 50 DAV
50 DAV is 159,000
|
$115.00
-11.66%
|
6/7/2019
|
$107.72
|
PP = $115.10
|
|
MB = $120.86
|
 Most Recent Note - 7/8/2019 4:26:56 PM
G - Recent lows in the $98-99 area define important near-term support to watch. Still sputtering below its 50 DMA line ($104.34). A rebound and subsequent volume-driven gains above the pivot point are needed to trigger a new (or add-on) technical buy signal. Faces some resistance due to overhead supply up to the $115 level. Fundamentals remain strong.
>>> FEATURED STOCK ARTICLE : Base Building Now Above 50-Day Moving Average Line - 6/7/2019 |
View all notes |
Set NEW NOTE alert |
Company Profile |
SEC
News |
Chart |
Request a new note
C
A
S
I |
EPAM
-
NYSE
Epam Systems Inc
COMPUTER SOFTWARE and SERVICES - Information Technology Service
|
$184.67
|
+4.56
2.53% |
$186.40
|
803,229
166.65% of 50 DAV
50 DAV is 482,000
|
$180.55
2.28%
|
5/9/2019
|
$169.25
|
PP = $180.55
|
|
MB = $189.58
|
Most Recent Note - 7/8/2019 11:53:27 AM
Y - Hitting a new 52-week high with today's 8th consecutive gain in a streak of gains lacking great volume conviction. Recently found support near its 50 DMA line ($172.94). The fact-based investment system requires gains above a stock's pivot point to be backed by at least +40% above average volume to trigger a proper new (or add-on) technical buy signal.
>>> FEATURED STOCK ARTICLE : Perched Near Pivot Point After a New Flat Base - 6/13/2019 |
View all notes |
Set NEW NOTE alert |
Company Profile |
SEC
News |
Chart |
Request a new note
C
A
S
I |
ENV
-
NYSE
Envestnet Inc
FINANCIAL SERVICES - Diversified Investments
|
$69.78
|
-0.36
-0.51% |
$69.92
|
123,911
44.57% of 50 DAV
50 DAV is 278,000
|
$72.67
-3.98%
|
3/15/2019
|
$66.05
|
PP = $64.90
|
|
MB = $68.15
|
Most Recent Note - 7/8/2019 4:17:37 PM
G - Consolidating above its 50 DMA line ($68.90) and perched within striking distance of its 52-week high. Prior lows in the $65-66 area define the next important near-term support to watch. Recently reported earnings +5% on +1% sales revenues for the Mar '19 quarter, below the +25% minimum earnings guideline (C criteria).
>>> FEATURED STOCK ARTICLE : Rebounded Above 50-Day Moving Average Line - 7/2/2019 |
View all notes |
Set NEW NOTE alert |
Company Profile |
SEC
News |
Chart |
Request a new note
C
A
S
I |
LHCG
-
NASDAQ
L H C Group Inc
HEALTH SERVICES - Home Health Care
|
$122.40
|
-0.43
-0.35% |
$122.90
|
323,761
147.16% of 50 DAV
50 DAV is 220,000
|
$123.10
-0.57%
|
7/1/2019
|
$110.94
|
PP = $122.20
|
|
MB = $128.31
|
Most Recent Note - 7/8/2019 4:20:47 PM
Y - Perched at its all-time high. Another new pivot point was cited based on its 5/20/19 high plus 10 cents. Subsequent gains above its pivot point backed by at least +40% above average volume may trigger a new (or add-on) technical buy signal. Its 50 DMA line ($115.86) defines near-term support above recent lows. Fundamentals remain strong.
>>> FEATURED STOCK ARTICLE : Prior Gains Lacked Volume; 50-Day Moving Average Defines Support - 6/17/2019 |
View all notes |
Set NEW NOTE alert |
Company Profile |
SEC
News |
Chart |
Request a new note
C
A
S
I |
ENSG
-
NASDAQ
Ensign Group Inc
HEALTH SERVICES - Long-Term Care Facilities
|
$56.80
|
-1.00
-1.73% |
$57.61
|
222,931
73.09% of 50 DAV
50 DAV is 305,000
|
$58.88
-3.53%
|
4/30/2019
|
$51.46
|
PP = $53.30
|
|
MB = $55.97
|
Most Recent Note - 7/8/2019 4:16:03 PM
G - Perched near its all-time high. Its 50 DMA line ($54.85) and recent low ($52.34 on 5/31/19) define near-term support to watch. Recently reported earnings +22% on +12% sales revenues for the Mar '19 quarter, below the +25% minimum earnings guideline (C criteria), raising fundamental concerns.
>>> FEATURED STOCK ARTICLE : Nursing Facility Operator Touched New High - 7/1/2019 |
View all notes |
Set NEW NOTE alert |
Company Profile |
SEC
News |
Chart |
Request a new note
C
A
S
I |
Symbol/Exchange
Company Name
Industry Group |
PRICE |
CHANGE
(%Change) |
Day High |
Volume
(% DAV)
(% 50 day avg vol) |
52 Wk Hi
% From Hi |
Featured
Date |
Price
Featured |
Pivot Featured |
|
Max Buy |
CHDN
-
NASDAQ
Churchill Downs Inc
LEISURE - Gaming Activities
|
$118.21
|
-0.17
-0.14% |
$118.89
|
179,645
56.14% of 50 DAV
50 DAV is 320,000
|
$118.80
-0.50%
|
6/5/2019
|
$108.87
|
PP = $104.96
|
|
MB = $110.21
|
Most Recent Note - 7/8/2019 4:14:41 PM
G - Holding its ground with volume totals cooling while perched at its all-time high. Its 50 DMA line ($105.28) and prior highs in the $104 area define important near-term support to watch on pullbacks. Share price was impacted by a 3:1 split when noted on 1/28/19.
>>> FEATURED STOCK ARTICLE : Consolidating Near 50-Day Moving Average - 6/29/2018 |
View all notes |
Set NEW NOTE alert |
Company Profile |
SEC
News |
Chart |
Request a new note
C
A
S
I |
WWD
-
NASDAQ
Woodward Inc
MANUFACTURING - Diversified Machinery
|
$114.13
|
-1.04
-0.90% |
$115.97
|
492,390
88.56% of 50 DAV
50 DAV is 556,000
|
$116.46
-2.00%
|
6/18/2019
|
$112.34
|
PP = $114.65
|
|
MB = $120.38
|
Most Recent Note - 7/5/2019 6:00:53 PM
Y - Posted a gain today and ended the session perched near its all-time high. Subsequent gains above the pivot point backed by at least +40% above average volume may clinch a convincing technical buy signal. Fundamentals remain strong.
>>> FEATURED STOCK ARTICLE : High Ranked Industrial Firm Perched Near All-Time High - 6/18/2019 |
View all notes |
Set NEW NOTE alert |
Company Profile |
SEC
News |
Chart |
Request a new note
C
A
S
I |
LULU
-
NASDAQ
Lululemon Athletica
MANUFACTURING - Textile Manufacturing
|
$186.80
|
+3.59
1.96% |
$186.95
|
1,882,680
88.47% of 50 DAV
50 DAV is 2,128,000
|
$190.52
-1.95%
|
6/13/2019
|
$174.48
|
PP = $179.60
|
|
MB = $188.58
|
Most Recent Note - 7/8/2019 4:23:09 PM
Y - Found support while recently consolidating above its 50 DMA line ($175.69) which defines important support above the prior low ($160.88 on 5/29/19). Reported Apr '19 quarterly earnings +35% on +20% sales revenues versus the ear ago period.
>>> FEATURED STOCK ARTICLE : Perched Near High Following Another Strong Earnings Report - 6/14/2019 |
View all notes |
Set NEW NOTE alert |
Company Profile |
SEC
News |
Chart |
Request a new note
C
A
S
I |
ULTA
-
NASDAQ
Ulta Beauty Inc
SPECIALTY RETAIL - Specialty Retail, Other
|
$352.69
|
+7.74
2.24% |
$353.08
|
615,882
80.72% of 50 DAV
50 DAV is 763,000
|
$365.54
-3.52%
|
3/15/2019
|
$341.27
|
PP = $322.59
|
|
MB = $338.72
|
Most Recent Note - 7/5/2019 5:57:30 PM
G - Hovering near its 50 DMA line ($343.47). Recently noted action indicative of distributional pressure after wedging higher with gains backed by lackluster volume as it touched a new all-time high. Reported earnings +17% on +13% sales revenues for the Apr '19 quarter, below the +25% minimum earnings guideline (C criteria), raising fundamental concerns. See the latest FSU analysis for more details and a new annotated graph.
>>> FEATURED STOCK ARTICLE : Stalled After Recently Wedging to New Record High - 7/5/2019 |
View all notes |
Set NEW NOTE alert |
Company Profile |
SEC
News |
Chart |
Request a new note
C
A
S
I |
CHGG
-
NYSE
Chegg Inc
Consumer Svcs-Education
|
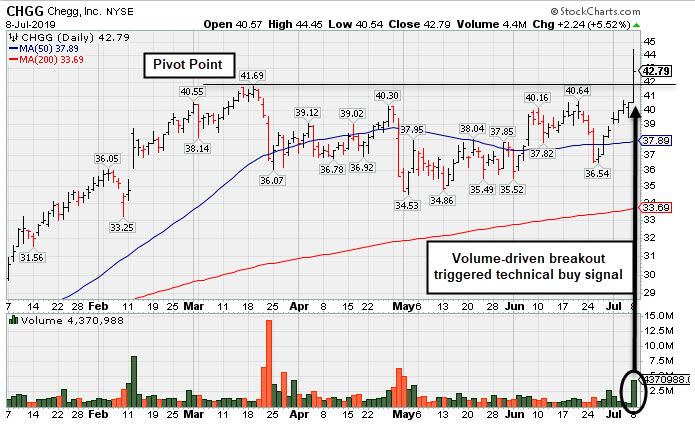
$42.79
|
+2.24
5.52% |
$44.45
|
4,378,702
274.01% of 50 DAV
50 DAV is 1,598,000
|
$41.69
2.64%
|
7/8/2019
|
$44.11
|
PP = $41.79
|
|
MB = $43.88
|
Most Recent Note - 7/8/2019 11:42:04 AM
Y - Color code is changed to yellow with pivot point cited based on its 3/19/19 high plus 10 cents. Hitting a new 52-week high with today's big volume-driven gain adding to a 7-day winning streak. Formed an orderly base since last noted in the 5/01/19 mid-day report - "Violated its 50 DMA line with a big volume-driven loss on the prior session. Quarterly and annual earnings (C annd A criteria) history has been strong."
>>> FEATURED STOCK ARTICLE : Tallied a Big Volume-Driven Breakout Gain for a New High - 7/8/2019 |
View all notes |
Set NEW NOTE alert |
Company Profile |
SEC
News |
Chart |
Request a new note
C
A
S
I |
Symbol/Exchange
Company Name
Industry Group |
PRICE |
CHANGE
(%Change) |
Day High |
Volume
(% DAV)
(% 50 day avg vol) |
52 Wk Hi
% From Hi |
Featured
Date |
Price
Featured |
Pivot Featured |
|
Max Buy |
ESNT
-
NYSE
Essent Group Ltd
Finance-MrtgandRel Svc
|
$48.54
|
-0.59
-1.20% |
$49.37
|
429,061
69.09% of 50 DAV
50 DAV is 621,000
|
$50.51
-3.90%
|
3/18/2019
|
$45.84
|
PP = $45.06
|
|
MB = $47.31
|
Most Recent Note - 7/3/2019 2:59:27 PM
G - Rebounded further above its 50 DMA line ($47.66 ) and little resistance remains due to overhead supply. Recently reported earnings +15% on +20% sales revenues for the Mar '19 quarter, below the +25% minimum earnings guideline (C criteria), raising fundamental concerns.
>>> FEATURED STOCK ARTICLE : Rebounded Above 50 Day Moving Average After Violation - 7/3/2019 |
View all notes |
Set NEW NOTE alert |
Company Profile |
SEC
News |
Chart |
Request a new note
C
A
S
I |
NOW
-
NYSE
Servicenow Inc
Computer Sftwr-Enterprse
|
$293.00
|
-1.53
-0.52% |
$293.78
|
1,268,659
73.21% of 50 DAV
50 DAV is 1,733,000
|
$294.62
-0.55%
|
4/22/2019
|
$242.64
|
PP = $251.75
|
|
MB = $264.34
|
Most Recent Note - 7/8/2019 4:23:53 PM
G - Still perched near its all-time high, extended from an sound base. Its 50 DMA line ($272.76) defines near-term support to watch. Recently reported earnings +20% on +34% sales revenues for the Mar '19 quarter, below the +25% minimum earnings guideline (C criteria), raising fundamental concerns.
>>> FEATURED STOCK ARTICLE : Pulling Back After Wedging to New Highs - 6/26/2019 |
View all notes |
Set NEW NOTE alert |
Company Profile |
SEC
News |
Chart |
Request a new note
C
A
S
I |
VEEV
-
NYSE
Veeva Systems Inc Cl A
Computer Sftwr-Medical
|
$167.87
|
-2.18
-1.28% |
$169.50
|
730,135
48.23% of 50 DAV
50 DAV is 1,514,000
|
$173.65
-3.33%
|
5/30/2019
|
$154.32
|
PP = $145.80
|
|
MB = $153.09
|
Most Recent Note - 7/8/2019 4:31:42 PM
G -Small loss today with light volume broke a streak of 6 consecutive gains. It remains very extended from any sound base. Its 50 DMA line ($152.71) defines near-term support. Reported earnings +52% on +25% sales revenues for the Apr '19 quarter, marking its 5th strong quarter with earnings above the +25% minimum guideline (C criteria).
>>> FEATURED STOCK ARTICLE : Halted Slide After 4 Volume-Driven Losses From High - 6/27/2019 |
View all notes |
Set NEW NOTE alert |
Company Profile |
SEC
News |
Chart |
Request a new note
C
A
S
I |
PAYC
-
NYSE
Paycom Software Inc
COMPUTER SOFTWARE and SERVICES - Application Software
|
$239.06
|
-0.24
-0.10% |
$241.15
|
500,803
64.29% of 50 DAV
50 DAV is 779,000
|
$239.33
-0.11%
|
2/6/2019
|
$171.66
|
PP = $164.18
|
|
MB = $172.39
|
Most Recent Note - 7/2/2019 5:42:28 PM
G - Posted a 4th consecutive gain today and ended near its all-time high. Its 50 DMA line ($211) defines near-term support to watch above the recent low ($194.84 on 6/03/19). Reported earnings +25% on +30% sales revenues for the Mar '19 quarter.
>>> FEATURED STOCK ARTICLE : Perched Near High Extended From Any Sound Base - 6/28/2019 |
View all notes |
Set NEW NOTE alert |
Company Profile |
SEC
News |
Chart |
Request a new note
C
A
S
I |
PYPL
-
NASDAQ
Paypal Holdings Inc
Finance-CrdtCard/PmtPr
|
$116.95
|
-0.21
-0.18% |
$117.23
|
4,325,572
77.99% of 50 DAV
50 DAV is 5,546,000
|
$119.95
-2.50%
|
1/24/2019
|
$92.56
|
PP = $93.80
|
|
MB = $98.49
|
Most Recent Note - 7/8/2019 4:26:23 PM
G - It remains quietly perched near its all-time high. Did not form a sound base, yet promptly rebounded after violating its 50 DMA line and prior low ($106.52) on 6/03/19. Recently reported earnings +37% on +12% sales revenues for the Mar '19 quarter, continuing its strong earnings track record.
>>> FEATURED STOCK ARTICLE : Popular Payments Firm Extended From Any Sound Base - 6/19/2019 |
View all notes |
Set NEW NOTE alert |
Company Profile |
SEC
News |
Chart |
Request a new note
C
A
S
I |
Symbol/Exchange
Company Name
Industry Group |
PRICE |
CHANGE
(%Change) |
Day High |
Volume
(% DAV)
(% 50 day avg vol) |
52 Wk Hi
% From Hi |
Featured
Date |
Price
Featured |
Pivot Featured |
|
Max Buy |
PLNT
-
NYSE
Planet Fitness Inc Cl A
Leisure-Services
|
$76.35
|
+0.11
0.14% |
$76.45
|
1,259,667
73.58% of 50 DAV
50 DAV is 1,712,000
|
$81.90
-6.78%
|
11/7/2018
|
$57.10
|
PP = $55.45
|
|
MB = $58.22
|
Most Recent Note - 7/8/2019 4:25:07 PM
G - Its 50 DMA line has acted as resistance, but a rebound above the 50 DMA line ($76.58) is needed for its outlook to improve. Fundamentals remain strong.
>>> FEATURED STOCK ARTICLE : Undercut 50-Day Moving Average With Volume Behind Losses - 6/21/2019 |
View all notes |
Set NEW NOTE alert |
Company Profile |
SEC
News |
Chart |
Request a new note
C
A
S
I |
BLD
-
NYSE
Topbuild Corp
Bldg-Constr Prds/Misc
|
$81.92
|
+0.42
0.52% |
$82.29
|
371,137
110.79% of 50 DAV
50 DAV is 335,000
|
$86.96
-5.80%
|
5/17/2019
|
$82.19
|
PP = $87.31
|
|
MB = $91.68
|
Most Recent Note - 7/5/2019 5:59:28 PM
Y - Consolidating above support defined by its 50 DMA line ($79.27) and recent lows. Still quietly perched within striking distance of its 52-week high. Subsequent gains above the pivot point backed by at least +40% above average volume may trigger a technical buy signal. Fundamentals remain strong.
>>> FEATURED STOCK ARTICLE : Found Support at 50-Day Moving Averge Line - 6/20/2019 |
View all notes |
Set NEW NOTE alert |
Company Profile |
SEC
News |
Chart |
Request a new note
C
A
S
I |
TEAM
-
NASDAQ
Atlassian Corp Plc Cl A
Comp Sftwr-Spec Enterprs
|
$137.93
|
+2.82
2.09% |
$138.48
|
1,249,931
84.45% of 50 DAV
50 DAV is 1,480,000
|
$137.78
0.11%
|
5/24/2019
|
$129.52
|
PP = $132.09
|
|
MB = $138.69
|
Most Recent Note - 7/8/2019 4:28:23 PM
Y - Posted a gain again today with below average volume and hit a new all-time high. The 50 DMA line ($125.44) and prior low ($115.87 on 6/03/19) define important near-term support to watch. Reported earnings +133% on +38% sales revenues for the Mar '19 quarter, continuing its strong earnings track record.
>>> FEATURED STOCK ARTICLE : Perched at High After Wedging into New High Territory - 6/24/2019 |
View all notes |
Set NEW NOTE alert |
Company Profile |
SEC
News |
Chart |
Request a new note
C
A
S
I |
UPLD
-
NASDAQ
Upland Software Inc
Computer Sftwr-Enterprse
|
$47.10
|
+0.78
1.68% |
$47.49
|
300,120
50.87% of 50 DAV
50 DAV is 590,000
|
$54.87
-14.16%
|
6/10/2019
|
$53.30
|
PP = $50.74
|
|
MB = $53.28
|
Most Recent Note - 7/8/2019 4:30:16 PM
G - Its 50 DMA line ($47.19) has been acting as resistance, meanwhile, a rebound above it is needed for its outlook to improve.Completed a new Public Offering on 5/08/19. Quarterly comparisons through Mar '19 have shown impressive sales revenues growth and greatly improved earnings increases above the +25% minimum guideline (C criteria).
>>> FEATURED STOCK ARTICLE : Rose From an Advanced Ascending Base - 6/10/2019 |
View all notes |
Set NEW NOTE alert |
Company Profile |
SEC
News |
Chart |
Request a new note
C
A
S
I |
GLOB
-
NYSE
Globant SA
Computer-Tech Services
|
$104.57
|
-0.02
-0.02% |
$106.15
|
281,914
66.65% of 50 DAV
50 DAV is 423,000
|
$105.39
-0.78%
|
2/15/2019
|
$69.35
|
PP = $70.00
|
|
MB = $73.50
|
Most Recent Note - 7/8/2019 4:19:22 PM
G - Perched at its all-time high following 7 consecutive gains marked by below average volume. Very extended from any sound base. Its 50 DMA line ($92.21) defines important support to watch on pullbacks. Fundamentals remain strong.
>>> FEATURED STOCK ARTICLE : Posted Big Gain for Another New High Close - 6/12/2019 |
View all notes |
Set NEW NOTE alert |
Company Profile |
SEC
News |
Chart |
Request a new note
C
A
S
I |
Symbol/Exchange
Company Name
Industry Group |
PRICE |
CHANGE
(%Change) |
Day High |
Volume
(% DAV)
(% 50 day avg vol) |
52 Wk Hi
% From Hi |
Featured
Date |
Price
Featured |
Pivot Featured |
|
Max Buy |
PAGS
-
NYSE
Pagseguro Digital Cl A
Finance-CrdtCard/PmtPr
|
$40.69
|
+0.18
0.44% |
$40.91
|
1,589,424
77.08% of 50 DAV
50 DAV is 2,062,000
|
$40.82
-0.32%
|
6/25/2019
|
$37.69
|
PP = $40.07
|
|
MB = $42.07
|
Most Recent Note - 7/2/2019 5:40:55 PM
Y - Posted a gain today with below average volume and ended near the session high for a best-ever close. It was highlighted in yellow with pivot point cited based on its 3/29/18 high plus 10 cents in the 6/25/19 mid-day report. Faces no resistance due to overhead. Subsequent volume-driven gains for new highs may trigger a technical buy signal. Quarterly comparisons through Mar '19 showed earnings increases above the +25% minimum guideline (C criteria), however, sequential comparisons have shown deceleration in its sales revenues and earnings growth rate. Limited history for this Brazil-based firm is also a concern. Completed its $21.50 IPO on 1/24/18.
>>> FEATURED STOCK ARTICLE : Brazilian Payment Tech Firm Perched Near High - 6/25/2019 |
View all notes |
Set NEW NOTE alert |
Company Profile |
SEC
News |
Chart |
Request a new note
C
A
S
I |