You are not logged in.
This means you
CAN ONLY VIEW reports that were published prior to Tuesday, April 8, 2025.
You
MUST UPGRADE YOUR MEMBERSHIP if you want to see any current reports.
AFTER MARKET UPDATE - TUESDAY, DECEMBER 26TH, 2023
Previous After Market Report Next After Market Report >>>
|
|
|
|
DOW |
+159.36 |
37,545.33 |
+0.43% |
|
Volume |
591,368,338 |
-18% |
|
Volume |
6,421,881,500 |
+33% |
|
NASDAQ |
+81.60 |
15,074.57 |
+0.54% |
|
Advancers |
2,065 |
74% |
|
Advancers |
2,936 |
68% |
|
S&P 500 |
+20.12 |
4,774.75 |
+0.42% |
|
Decliners |
736 |
26% |
|
Decliners |
1,400 |
32% |
|
Russell 2000 |
+25.23 |
2,059.19 |
+1.24% |
|
52 Wk Highs |
223 |
|
|
52 Wk Highs |
370 |
|
|
S&P 600 |
+14.99 |
1,334.68 |
+1.14% |
|
52 Wk Lows |
3 |
|
|
52 Wk Lows |
66 |
|
|
 |
Breadth Positive as Major Indices Rose With More Leadership
Kenneth J. Gruneisen - Passed the CAN SLIM® Master's Exam
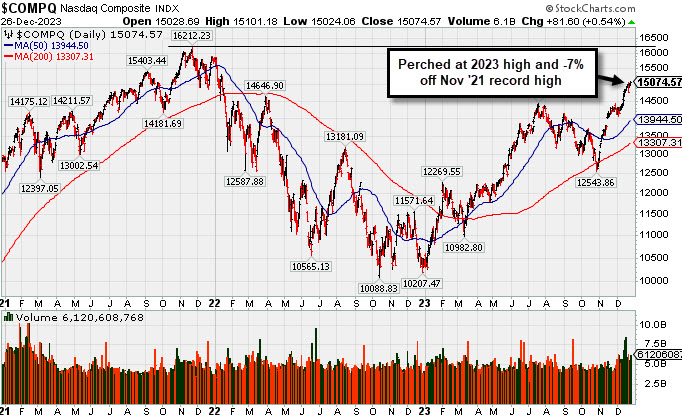
The three major indices closed with gains ranging from 0.4% to 0.5%. Volume was reported mixed, lighter than the prior session total on the NYSE and higher on the Nasdaq exchange. Breadth was positive as advancers led decliners by almost a 3-1 margin on the NYSE and by 2-1 on the Nasdaq exchange. There were 110 high-ranked companies from the Leaders List that hit new 52-week highs and were listed on the BreakOuts Page, versus the total of 94 on the prior session. New 52-week highs totals expanded and solidly outnumbered shrinking new 52-week lows totals on the NYSE and on the Nasdaq exchange. The major indices are in a confirmed uptrend (M criteria). New buying efforts should be only made in stocks fitting all key criteria of the fact-based investment system.
PICTURED: The Nasdaq Composite Index is perched at its 2023 high and yet still -7% off its Nov '21 record high. All 11 S&P 500 sectors settled with gains. The energy sector (+0.9%) rose alongside oil prices ($75.66/bbl, +2.04, +2.8%). The move in oil was related to geopolitical angst tied to a weekend report that an oil tanker near India was struck by an Iranian drone. Meanwhile, the health care sector (+0.2%) saw the slimmest gain.
The Russell 2000 was a relative outperformer among major indices, climbing 1.2%. The S&P 500 traded within 15 points of its all-time high close (4,796) at its high of the day.
The market had a positive bias that was supported by M&A activity in the biotech industry. Bristol-Myers (BMY -1.61%) is acquiring RayzeBio (RYZB +100.85%) for $62.50 per share in cash. AstraZeneca (AZN +0.32%) is acquiring Gracell Biotechnologies (GRCL +60.26%) for an upfront cash portion of $10.00 per ADS, which is a 62% premium over Friday's closing price.
A new $57 billion 2-yr note sale was met with solid demand. The 2-yr note yield settled two basis higher at 4.35%. The 10-yr note yield declined two basis points to 3.89%.
|
 Kenneth J. Gruneisen started out as a licensed stockbroker in August 1987, a couple of months prior to the historic stock market crash that took the Dow Jones Industrial Average down -22.6% in a single day. He has published daily fact-based fundamental and technical analysis on high-ranked stocks online for two decades. Through FACTBASEDINVESTING.COM, Kenneth provides educational articles, news, market commentary, and other information regarding proven investment systems that work in good times and bad.
Comments contained in the body of this report are technical opinions only and are not necessarily those of Gruneisen Growth Corp. The material herein has been obtained from sources believed to be reliable and accurate, however, its accuracy and completeness cannot be guaranteed. Our firm, employees, and customers may effect transactions, including transactions contrary to any recommendation herein, or have positions in the securities mentioned herein or options with respect thereto. Any recommendation contained in this report may not be suitable for all investors and it is not to be deemed an offer or solicitation on our part with respect to the purchase or sale of any securities. |
|
 |
Financial, Tech, and Energy-Linked Groups Led Gainers
Kenneth J. Gruneisen - Passed the CAN SLIM® Master's Exam
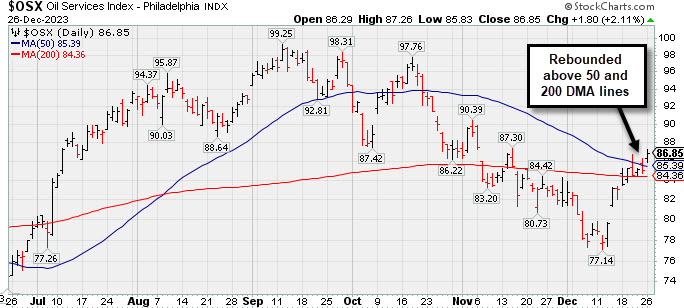
The Broker/Dealer Index ($XBD +0.66%) and Bank Index ($BKX +1.01%) each posted gains while the Retail Index ($RLX +0.02%) finished flat. The tech sector had a positive bias as Semiconductor Index ($SOX +1.81%) outpaced the Networking Index ($NWX +1.06%) while the Biotech Index ($BTK +0.35%) inched higher. Energy-linked groups rose as the Integrated Oil Index ($XOI +1.29%) and the Oil Services Index ($OSX +2.11%) both posted solid gains while the Gold & Silver Index ($XAU +0.29%) posted a smaller gain.
PICTURED: The Oil Services Index ($OSX +2.11%) has rebounded above its 200-day and 50-day moving average (DMA) lines.
| Oil Services |
$OSX |
86.85 |
+1.80 |
+2.11% |
+3.56% |
| Integrated Oil |
$XOI |
1,908.03 |
+24.21 |
+1.29% |
+6.76% |
| Semiconductor |
$SOX |
4,207.45 |
+74.60 |
+1.81% |
+66.16% |
| Networking |
$NWX |
835.96 |
+8.78 |
+1.06% |
+6.72% |
| Broker/Dealer |
$XBD |
555.36 |
+3.64 |
+0.66% |
+23.65% |
| Retail |
$RLX |
3,910.51 |
+0.91 |
+0.02% |
+41.99% |
| Gold & Silver |
$XAU |
128.30 |
+0.37 |
+0.29% |
+6.16% |
| Bank |
$BKX |
96.28 |
+0.96 |
+1.01% |
-4.53% |
| Biotech |
$BTK |
5,387.87 |
+19.01 |
+0.35% |
+2.02% |
|
|
|
 |
Extended From Base and Hovering at All-Time High
Kenneth J. Gruneisen - Passed the CAN SLIM® Master's Exam
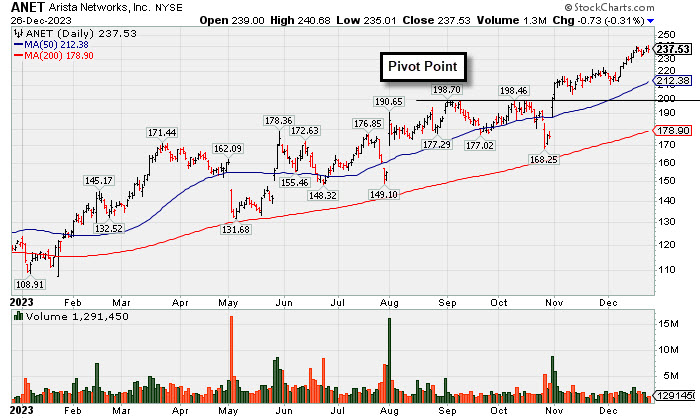
Arista Networks Inc (ANET -$0.73 or -0.31% to $237.53) has seen volume totals cooling while hovering near its all-time high, extended from any sound base. Its 50-day moving average (DMA) line ($212.38) defines near-term support along with recent lows in the $210 area. Fundamentals remain strong.
ANET finished strong after it was highlighted in yellow and new pivot point cited is based on its prior high plus 10 cents in the 10/31/23 mid-day report (read here). It was last covered in detail in this FSU section on 12/06/23 with an annotated graph under the headline, "Made Gradual Progress Since Latest Breakout".
ANET currently has a 98 Earnings Per Share Rating. It has shown 8 consecutive quarterly comparisons with strong and steady above the +25% minimum earnings guideline (C criteria). Annual earnings (A criteria) had a downturn in FY '20 like many companies during the pandemic.
The number of top-rated funds owning its shares rose from 1,758 in Dec '21 to 2,347 in Sep '23, a reassuring sign concerning the I criteria. Its current Up/Down Volume Ratio of 1.5 is an unbiased indication its shares have been under accumulation over the past 50 days. The high-ranked Computer - Networking firm has a Timeliness Rating of A and a Sponsorship Rating of C. Its small supply of 252 million shares (S criteria) in the public float may contribute to greater volatility in the event of institutional buying or selling.
|
|
|
Color Codes Explained :
Y - Better candidates highlighted by our
staff of experts.
G - Previously featured
in past reports as yellow but may no longer be buyable under the
guidelines.
***Last / Change / Volume data in this table is the closing quote data***
Symbol/Exchange
Company Name
Industry Group |
PRICE |
CHANGE
(%Change) |
Day High |
Volume
(% DAV)
(% 50 day avg vol) |
52 Wk Hi
% From Hi |
Featured
Date |
Price
Featured |
Pivot Featured |
|
Max Buy |
 ANET
-
NYSE
ANET
-
NYSE
Arista Networks
Computer-Networking
|
$237.53
|
-0.73
-0.31% |
$240.68
|
1,291,537
59.16% of 50 DAV
50 DAV is 2,183,000
|
$240.01
-1.03%
|
10/31/2023
|
$188.84
|
PP = $198.80
|
|
MB = $208.74
|
 Most Recent Note - 12/26/2023 8:38:00 PM
G - Hovering near its all-time high, extended from any sound base. Its 50 DMA line ($212) defines near-term support above the prior low in the $210 area. Fundamentals remain strong. See the latest FSU analysis for more details and a new annotated graph.
>>> FEATURED STOCK ARTICLE : Extended From Base and Hovering at All-Time High - 12/26/2023 |
View all notes |
Set NEW NOTE alert |
Company Profile |
SEC
News |
Chart |
Request a new note
C
A
S
I |
NVO
-
NYSE
Novo Nordisk ADR
Medical-Ethical Drugs
|
$102.68
|
-0.03
-0.03% |
$103.13
|
1,851,332
41.30% of 50 DAV
50 DAV is 4,483,000
|
$105.69
-2.85%
|
11/2/2023
|
$100.97
|
PP = $104.10
|
|
MB = $109.31
|
Most Recent Note - 12/21/2023 4:58:05 PM
Y - Posted a 4th consecutive gain today, wedging further above its 50 DMA line ($99.59) toward its high. Its 50 DMA line defines initial support above the recent low ($94.73 on 12/11/23) on pullbacks.
>>> FEATURED STOCK ARTICLE : Managed a "Positive Reversal" but Still Below 50-Day Moving Average - 12/11/2023 |
View all notes |
Set NEW NOTE alert |
Company Profile |
SEC
News |
Chart |
Request a new note
C
A
S
I |
QLYS
-
NASDAQ
Qualys
Computer Sftwr-Security
|
$203.08
|
-1.33
-0.65% |
$205.00
|
151,789
40.26% of 50 DAV
50 DAV is 377,000
|
$206.35
-1.58%
|
11/3/2023
|
$167.50
|
PP = $165.03
|
|
MB = $173.28
|
Most Recent Note - 12/20/2023 5:10:26 PM
G - Pulled back today breaking a streak of 10 consecutive gains for new all-time highs. It is very extended from any sound base. Its 50 DMA line ($174) defines initial support to watch on pullbacks above the prior high ($165).
>>> FEATURED STOCK ARTICLE : Extended From Base Following Big Breakout - 12/12/2023 |
View all notes |
Set NEW NOTE alert |
Company Profile |
SEC
News |
Chart |
Request a new note
C
A
S
I |
AXON
-
NASDAQ
Axon Enterprise
Security/Sfty
|
$258.11
|
-0.92
-0.36% |
$259.23
|
180,056
40.19% of 50 DAV
50 DAV is 448,000
|
$260.69
-0.99%
|
11/8/2023
|
$127.84
|
PP = $223.30
|
|
MB = $234.47
|
Most Recent Note - 12/21/2023 5:01:37 PM
G - Posted a gain today with lighter volume for a best-ever close. On pullbacks, the prior highs in the $229-231 area define near-term support to watch above its 50-day moving average (DMA) line ($225.62).
>>> FEATURED STOCK ARTICLE : Axon Enterprise Hits New High With 6th Straight Gain - 12/13/2023 |
View all notes |
Set NEW NOTE alert |
Company Profile |
SEC
News |
Chart |
Request a new note
C
A
S
I |
TDG
-
NYSE
TransDigm Group
Aerospace/Defense
|
$1,008.97
|
+8.55
0.85% |
$1,012.65
|
119,250
51.85% of 50 DAV
50 DAV is 230,000
|
$1,015.72
-0.66%
|
12/12/2023
|
$1,000.39
|
PP = $1,013.18
|
|
MB = $1,063.84
|
Most Recent Note - 12/26/2023 8:41:22 PM
Y - Posted a 3rd consecutive gain backed by light volume for its second-best ever close. The new pivot point cited was based on its 11/14/23 high plus 10 cents, however, gains above the pivot point were not backed by the +40% above-average volume necessary to trigger a proper new technical buy signal. Fundamentals remain strong. Recent lows in the $950 area define near-term support to watch on pullbacks.
>>> FEATURED STOCK ARTICLE : Volume-Driven Loss Breaks Streak of 6 Straight Gains - 12/14/2023 |
View all notes |
Set NEW NOTE alert |
Company Profile |
SEC
News |
Chart |
Request a new note
C
A
S
I |
Symbol/Exchange
Company Name
Industry Group |
PRICE |
CHANGE
(%Change) |
Day High |
Volume
(% DAV)
(% 50 day avg vol) |
52 Wk Hi
% From Hi |
Featured
Date |
Price
Featured |
Pivot Featured |
|
Max Buy |
PANW
-
NASDAQ
Palo Alto Networks
Computer Sftwr-Security
|
$300.82
|
+2.61
0.88% |
$301.99
|
1,558,025
35.19% of 50 DAV
50 DAV is 4,428,000
|
$318.00
-5.40%
|
11/13/2023
|
$255.90
|
PP = $266.00
|
|
MB = $279.30
|
Most Recent Note - 12/20/2023 5:09:00 PM
G - Volume totals have been cooling while consolidating near its all-time high. Prior highs in the $265 area define important support to watch along with its 50 DMA line ($267). Fundamentals remain strong.
>>> FEATURED STOCK ARTICLE : Consolidating After Volume-Driven Gains for All-Time Highs - 12/15/2023 |
View all notes |
Set NEW NOTE alert |
Company Profile |
SEC
News |
Chart |
Request a new note
C
A
S
I |
URI
-
NYSE
United Rentals
Comml Svcs-Leasing
|
$580.47
|
+9.96
1.75% |
$585.50
|
607,201
74.96% of 50 DAV
50 DAV is 810,000
|
$582.63
-0.37%
|
12/1/2023
|
$499.51
|
PP = $488.73
|
|
MB = $513.17
|
Most Recent Note - 12/21/2023 4:59:10 PM
G - Posted a gain today with below-average volume, hovering near its all-time high. On pullbacks, the prior highs define near-term support to watch above its 50 DMA line ($467).
>>> FEATURED STOCK ARTICLE : Perched Near All-Time High Following Volume-Driven Gains - 12/19/2023 |
View all notes |
Set NEW NOTE alert |
Company Profile |
SEC
News |
Chart |
Request a new note
C
A
S
I |
AMPH
-
NASDAQ
Amphastar Pharm
Medical-Biomed/Biotech
|
$62.51
|
+1.59
2.61% |
$63.50
|
647,744
153.86% of 50 DAV
50 DAV is 421,000
|
$67.66
-7.61%
|
12/4/2023
|
$60.84
|
PP = $58.35
|
|
MB = $61.27
|
Most Recent Note - 12/21/2023 4:55:41 PM
Y - Posted a gain with light volume today. It is above the pivot point cited based on its 11/21/23 high after a cup-with-handle base. Volume totals have been cooling while consolidating. Little resistance remains due to overhead supply. Fundamentals remain strong. See the latest FSU analysis for more details and a new annotated graph.
>>> FEATURED STOCK ARTICLE : Consolidating Above Pivot Point With Volume Cooling - 12/21/2023 |
View all notes |
Set NEW NOTE alert |
Company Profile |
SEC
News |
Chart |
Request a new note
C
A
S
I |
TBBK
-
NASDAQ
The Bancorp
Banks-Northeast
|
$40.35
|
+0.16
0.40% |
$40.61
|
277,714
63.84% of 50 DAV
50 DAV is 435,000
|
$42.46
-4.97%
|
12/4/2023
|
$39.88
|
PP = $41.62
|
|
MB = $43.70
|
Most Recent Note - 12/22/2023 11:14:13 PM
Y - Posted a small gain on lighter volume today after 2 "negative reversals" at its all-time high sputtering back below its pivot point. Subsequent gains and a strong close above the pivot point backed by at least +40% above average volume may trigger a proper technical buy signal. See the latest FSU analysis for more details and a new annotated graph.
>>> FEATURED STOCK ARTICLE : Negative Reversals are Signs of Distributional Pressure - 12/22/2023 |
View all notes |
Set NEW NOTE alert |
Company Profile |
SEC
News |
Chart |
Request a new note
C
A
S
I |
LULU
-
NASDAQ
lululemon athletica
Retail-Apparel/Shoes/Acc
|
$506.13
|
-3.88
-0.76% |
$513.50
|
887,416
36.78% of 50 DAV
50 DAV is 2,413,000
|
$511.60
-1.07%
|
12/8/2023
|
$490.61
|
PP = $485.93
|
|
MB = $510.23
|
Most Recent Note - 12/26/2023 8:40:05 PM
Y - There was a "negative reversal" today after hitting a new all-time high and it closed near the session low with a small loss on light volume. Its 2021 high of $485 defines initial support to watch after its recent breakout from a 2+ year base.
>>> FEATURED STOCK ARTICLE : Lululemon Breaks Out to New All-Time High - 12/8/2023 |
View all notes |
Set NEW NOTE alert |
Company Profile |
SEC
News |
Chart |
Request a new note
C
A
S
I |
Symbol/Exchange
Company Name
Industry Group |
PRICE |
CHANGE
(%Change) |
Day High |
Volume
(% DAV)
(% 50 day avg vol) |
52 Wk Hi
% From Hi |
Featured
Date |
Price
Featured |
Pivot Featured |
|
Max Buy |
|
|
|
THESE ARE NOT BUY RECOMMENDATIONS!
Comments contained in the body of this report are technical
opinions only. The material herein has been obtained
from sources believed to be reliable and accurate, however,
its accuracy and completeness cannot be guaranteed.
This site is not an investment advisor, hence it does
not endorse or recommend any securities or other investments.
Any recommendation contained in this report may not
be suitable for all investors and it is not to be deemed
an offer or solicitation on our part with respect to
the purchase or sale of any securities. All trademarks,
service marks and trade names appearing in this report
are the property of their respective owners, and are
likewise used for identification purposes only.
This report is a service available
only to active Paid Premium Members.
You may opt-out of receiving report notifications
at any time. Questions or comments may be submitted
by writing to Premium Membership Services 665 S.E. 10 Street, Suite 201 Deerfield Beach, FL 33441-5634 or by calling 1-800-965-8307
or 954-785-1121.
|
|
|