You are not logged in.
This means you
CAN ONLY VIEW reports that were published prior to Tuesday, April 8, 2025.
You
MUST UPGRADE YOUR MEMBERSHIP if you want to see any current reports.
AFTER MARKET UPDATE - TUESDAY, NOVEMBER 15TH, 2022
Previous After Market Report Next After Market Report >>>
|
|
|
|
DOW |
+56.22 |
33,592.92 |
+0.17% |
|
Volume |
1,028,798,627 |
+8% |
|
Volume |
5,596,133,500 |
+11% |
|
NASDAQ |
+162.19 |
11,358.41 |
+1.45% |
|
Advancers |
2,297 |
76% |
|
Advancers |
3,019 |
65% |
|
S&P 500 |
+34.48 |
3,991.73 |
+0.87% |
|
Decliners |
738 |
24% |
|
Decliners |
1,598 |
35% |
|
Russell 2000 |
+27.95 |
1,889.20 |
+1.50% |
|
52 Wk Highs |
65 |
|
|
52 Wk Highs |
111 |
|
|
S&P 600 |
+16.56 |
1,235.03 |
+1.36% |
|
52 Wk Lows |
27 |
|
|
52 Wk Lows |
124 |
|
|
 |
Major Indices Rose With Positive Breadth and Higher Volume Totals
Kenneth J. Gruneisen - Passed the CAN SLIM® Master's Exam
The Dow added 56 points while the Nasdaq Composite gained 1.5%, and the S&P 500 increased 0.9%. The volume totals reported were higher than the prior session totals on the NYSE and on the Nasdaq exchange. Breadth was positive as advancers led decliners by more than a 3-1 margin on the NYSE and almost 2-1 on the Nasdaq exchange. There were 52 high-ranked companies from the Leaders List that hit new 52-week highs and were listed on the BreakOuts Page, versus the total of 35 on the prior session. New 52-week highs outnumbered new 52-week lows on the NYSE but new lows still outnumbered new highs on the Nasdaq exchange. The market is in a confirmed uptrend (M criteria). Healthy leadership (new 52-week highs totals) has continued to help the rally be productive. Only stocks meeting all key-criteria of the fact-based investment system should be considered as buy candidates.
Chart courtesy of www.stockcharts.com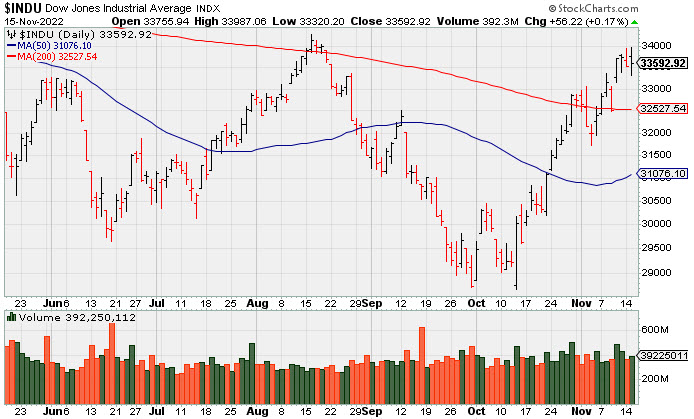 PICTURED: The Dow Jones Industrial Average posted a gain with higher volume while rallying near its August high.
U.S. equites rose Tuesday after the Producer Price Index (PPI) data came in lighter than expected for the second month in a row, hinting inflation may be easing. The PPI, which is a measure of wholesale inflation, rose 0.2% in October versus an expected 0.4% monthly gain. Meanwhile, core PPI (which excludes the more volatile food and energy prices), remained unchanged. Headline PPI eased more than forecasted to notch an 8% annual gain. Headline core PPI rose 6.7% year-over-year, coming in lower than the anticipated 7.2% annual increase. Nine of the 11 sectors in the S&P 500 finished in positive territory, with Communication Services pacing gains.
Treasury yields slipped after wholesale prices came in lower than expected. The benchmark 10-year note dropped 11 basis points (0.11%) to 3.76%, while the 30-year bond yield declined 9 basis points (0.09%) to 3.95%. The two-year note yield, which is more sensitive to changes in policy, lost 7 basis points (0.07%) to 4.34%. The U.S. Dollar Index lost 0.2% against a basket of major currencies after economic data showed inflation may be starting to slow. In commodities, West Texas Intermediate (WTI) crude increased 1% to $86.75/barrel amid record high COVID-19 cases in major Chinese cities. Meanwhile, the European embargo on Russian oil is set to start on December 5, leaving Russia to redirect over 1 million barrels per day. U.S. crude oil inventory is expected to drop by approximately 300,000 barrels in the week ended November 11. |
 Kenneth J. Gruneisen started out as a licensed stockbroker in August 1987, a couple of months prior to the historic stock market crash that took the Dow Jones Industrial Average down -22.6% in a single day. He has published daily fact-based fundamental and technical analysis on high-ranked stocks online for two decades. Through FACTBASEDINVESTING.COM, Kenneth provides educational articles, news, market commentary, and other information regarding proven investment systems that work in good times and bad.
Comments contained in the body of this report are technical opinions only and are not necessarily those of Gruneisen Growth Corp. The material herein has been obtained from sources believed to be reliable and accurate, however, its accuracy and completeness cannot be guaranteed. Our firm, employees, and customers may effect transactions, including transactions contrary to any recommendation herein, or have positions in the securities mentioned herein or options with respect thereto. Any recommendation contained in this report may not be suitable for all investors and it is not to be deemed an offer or solicitation on our part with respect to the purchase or sale of any securities. |
|
 |
Retail, Financial, Tech, and Energy Indexes Rose
Kenneth J. Gruneisen - Passed the CAN SLIM® Master's Exam
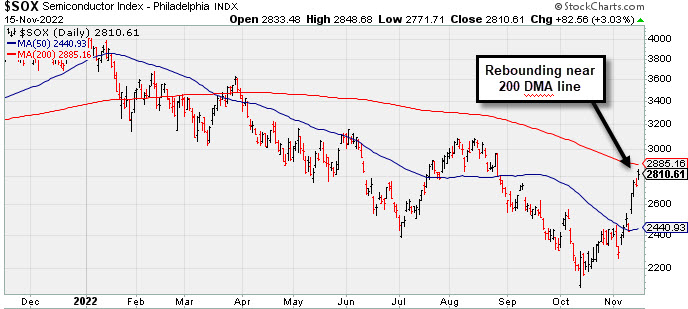
The Retail Index ($RLX +1.28%) and Broker/Dealer Index ($XBD +1.32%) both posted influential gains and the Bank Index ($BKX +0.45%) edged higher. The Semiconductor Index ($SOX +3.03%) led the tech sector higher while the Networking Index ($NWX +1.23%) posted a solid gain and the Biotech Index ($BTK +0.34%) also inched higher. Commodity-linked groups were mixed as the Oil Services Index ($OSX +1.75%) and Integrated Oil Index ($XOI +1.43%) both posted gains but the Gold & Silver Index ($XAU -1.07%) slumped. PICTURED: The Semiconductor Index ($SOX +3.03%) is rebounding near its 200-day moving average (DMA) line and August high.
| Oil Services |
$OSX |
87.93 |
+1.51 |
+1.75% |
+66.79% |
| Integrated Oil |
$XOI |
1,938.98 |
+27.32 |
+1.43% |
+64.57% |
| Semiconductor |
$SOX |
2,810.61 |
+82.56 |
+3.03% |
-28.78% |
| Networking |
$NWX |
807.35 |
+9.81 |
+1.23% |
-16.86% |
| Broker/Dealer |
$XBD |
480.22 |
+6.25 |
+1.32% |
-1.36% |
| Retail |
$RLX |
2,985.72 |
+37.71 |
+1.28% |
-29.36% |
| Gold & Silver |
$XAU |
115.95 |
-1.25 |
-1.07% |
-12.46% |
| Bank |
$BKX |
107.88 |
+0.48 |
+0.45% |
-18.41% |
| Biotech |
$BTK |
5,215.85 |
+17.87 |
+0.34% |
-5.48% |
|
|
|
 |
Featured Stocks
Kenneth J. Gruneisen - Passed the CAN SLIM® Master's Exam
|
|
|
Color Codes Explained :
Y - Better candidates highlighted by our
staff of experts.
G - Previously featured
in past reports as yellow but may no longer be buyable under the
guidelines.
***Last / Change / Volume data in this table is the closing quote data***
Symbol/Exchange
Company Name
Industry Group |
PRICE |
CHANGE
(%Change) |
Day High |
Volume
(% DAV)
(% 50 day avg vol) |
52 Wk Hi
% From Hi |
Featured
Date |
Price
Featured |
Pivot Featured |
|
Max Buy |
 CI
-
NYSE
CI
-
NYSE
Cigna Corp
Medical-Managed Care
|
$305.17
|
-1.68
-0.55% |
$308.66
|
2,121,148
102.13% of 50 DAV
50 DAV is 2,077,000
|
$325.16
-6.15%
|
7/7/2022
|
$276.55
|
PP = $273.68
|
|
MB = $287.36
|
Most Recent Note - 11/11/2022 12:12:04 PM
G - Violating its 50 DMA line ($297.53) with today's big volume-driven loss triggering a technical sell signal. Reported Sep '22 quarterly earnings +5% on +2% sales revenues versus the year ago period.
>>> FEATURED STOCK ARTICLE : Cigna Reported Earnings Perched at High - 11/3/2022 |
View all notes |
Set NEW NOTE alert |
Company Profile |
SEC
News |
Chart |
Request a new note
C
A
S
I |
ESQ
-
NASDAQ
Esquire Financial Hldgs
Finance-Commercial Loans
|
$45.00
|
+1.17
2.67% |
$45.66
|
23,658
81.58% of 50 DAV
50 DAV is 29,000
|
$45.20
-0.44%
|
10/18/2022
|
$40.02
|
PP = $39.95
|
|
MB = $41.95
|
 Most Recent Note - 11/15/2022 2:36:52 PM
G - Posting a gain today with below average volume. Prior highs in the $41 area define initial support to watch above its 50 DMA line ($40.31).
>>> FEATURED STOCK ARTICLE : New High With 6th Consecutive Volume-Driven Gain - 10/31/2022 |
View all notes |
Set NEW NOTE alert |
Company Profile |
SEC
News |
Chart |
Request a new note
C
A
S
I |
CCRN
-
NASDAQ
Cross Country Healthcare
DIVERSIFIED SERVICES - Staffing and Outsourcing Service
|
$33.19
|
+2.09
6.72% |
$33.35
|
781,146
83.72% of 50 DAV
50 DAV is 933,000
|
$38.68
-14.19%
|
9/9/2022
|
$27.32
|
PP = $30.61
|
|
MB = $32.14
|
Most Recent Note - 11/15/2022 2:33:26 PM
Y - A prompt rebound above the 50 DMA line ($31.81) today is helping its outlook improve and the color code is changed to yellow. Prior highs in the $30.50 area define important near-term support to watch where more damaging losses would trigger a technical sell signal. Reported Sep '22 quarterly earnings +75% on +70% sales revenues versus the year ago period.
>>> FEATURED STOCK ARTICLE : Consolidating Above Prior Highs and Above 50-Day Moving Average - 11/8/2022 |
View all notes |
Set NEW NOTE alert |
Company Profile |
SEC
News |
Chart |
Request a new note
C
A
S
I |
CMC
-
NYSE
Commercial Metals Co
METALS and MINING - Steel and Iron
|
$47.16
|
+0.17
0.36% |
$47.93
|
1,310,047
122.43% of 50 DAV
50 DAV is 1,070,000
|
$47.55
-0.82%
|
10/14/2022
|
$41.61
|
PP = $44.45
|
|
MB = $46.67
|
Most Recent Note - 11/14/2022 6:12:30 PM
G - Posted a gain today and its color code is changed to green after rising back above its "max buy" level. Fundamentals remain strong. Prior high in the $44 area defines initial support to watch on pullbacks.
>>> FEATURED STOCK ARTICLE : Steel/Metal Products Firm Quietly Perched Near All Time High - 11/7/2022 |
View all notes |
Set NEW NOTE alert |
Company Profile |
SEC
News |
Chart |
Request a new note
C
A
S
I |
VRTX
-
NASDAQ
Vertex Pharmaceuticals
Medical-Biomed/Biotech
|
$305.28
|
-0.75
-0.25% |
$309.98
|
1,309,084
88.81% of 50 DAV
50 DAV is 1,474,000
|
$316.48
-3.54%
|
10/24/2022
|
$308.47
|
PP = $306.05
|
|
MB = $321.35
|
Most Recent Note - 11/15/2022 2:40:45 PM
Y - Showed resilience after briefly undercutting its 50 DMA line ($296.69) which defines near-term support above recent lows in the $298 area. Recently reported Sep '22 quarterly earnings +14% on +18% sales revenues versus the year ago period, below the +25% minimum earnings guideline raising fundamental concerns (C criteria). Annual earnings (A criteria) history has been strong.
>>> FEATURED STOCK ARTICLE : Volume-Driven Gain Triggered Technical Buy Signal - 10/24/2022 |
View all notes |
Set NEW NOTE alert |
Company Profile |
SEC
News |
Chart |
Request a new note
C
A
S
I |
Symbol/Exchange
Company Name
Industry Group |
PRICE |
CHANGE
(%Change) |
Day High |
Volume
(% DAV)
(% 50 day avg vol) |
52 Wk Hi
% From Hi |
Featured
Date |
Price
Featured |
Pivot Featured |
|
Max Buy |
GPK
-
NYSE
Graphic Packaging Hldg
CONSUMER NON-DURABLES - Packaging and Containers
|
$22.26
|
+0.26
1.18% |
$22.51
|
2,510,404
83.13% of 50 DAV
50 DAV is 3,020,000
|
$24.07
-7.52%
|
10/25/2022
|
$22.75
|
PP = $24.17
|
|
MB = $25.38
|
Most Recent Note - 11/11/2022 3:45:58 PM
Y - Pulling back today for a 2nd consecutive loss with above average volume testing its 50 DMA line ($21.64). More damaging losses would raise concerns and trigger a technical sell signal. Subsequent gains above the pivot point backed by at least +40% above average volume may trigger a technical buy signal. Reported Sep '22 quarterly earnings +79% on +38% sales revenues versus the year ago period.
>>> FEATURED STOCK ARTICLE : Rebound Above 50-Day Moving Average Helped Outlook Improve - 10/25/2022 |
View all notes |
Set NEW NOTE alert |
Company Profile |
SEC
News |
Chart |
Request a new note
C
A
S
I |
CBZ
-
NYSE
C B I Z Inc
Comml Svcs-Consulting
|
$47.87
|
+0.18
0.38% |
$48.53
|
192,023
70.08% of 50 DAV
50 DAV is 274,000
|
$50.57
-5.34%
|
10/26/2022
|
$47.83
|
PP = $48.57
|
|
MB = $51.00
|
Most Recent Note - 11/11/2022 3:48:07 PM
Y - Pulling back today with lighter volume but slumping back below its pivot point. Its 50 DMA line ($45.41) and recent low define important near-term support. Recently reported Sep '22 quarterly earnings +24% on +28% sales revenues versus the year ago period.
>>> FEATURED STOCK ARTICLE : Earnings Report Due for Commercial Services and Consulting Firm - 10/26/2022 |
View all notes |
Set NEW NOTE alert |
Company Profile |
SEC
News |
Chart |
Request a new note
C
A
S
I |
ENPH
-
NASDAQ
Enphase Energy Inc
Energy-Solar
|
$300.73
|
+2.79
0.94% |
$313.39
|
3,086,796
74.61% of 50 DAV
50 DAV is 4,137,000
|
$324.84
-7.42%
|
10/26/2022
|
$301.55
|
PP = $324.94
|
|
MB = $341.19
|
Most Recent Note - 11/14/2022 12:41:11 PM
Y - Rebounding near recent highs with today's solid gain. Recently challenged its 52-week high and pivot point. Faces little near-term resistance due to overhead supply up to the $324 level. Its 50 DMA line ($283) defines near-term support above the recent low ($262.60 on 11/07/22). Fundamentals remain strong.
>>> FEATURED STOCK ARTICLE : Enphase Energy Rebound Above 50-Day Moving Average Helped Outlook - 10/28/2022 |
View all notes |
Set NEW NOTE alert |
Company Profile |
SEC
News |
Chart |
Request a new note
C
A
S
I |
HRMY
-
NASDAQ
Harmony Biosciences Holdings
Medical-Biomed/Biotech
|
$56.10
|
-2.47
-4.22% |
$61.55
|
1,005,588
190.16% of 50 DAV
50 DAV is 528,800
|
$60.66
-7.52%
|
11/1/2022
|
$55.31
|
PP = $57.23
|
|
MB = $60.09
|
Most Recent Note - 11/15/2022 12:27:43 PM
Y - Gapped up today and hit a new all-time high but reversed into the red, action indicative of distributional pressure. Posted a solid gain on the prior session with +26% above average volume as it closed back above the pivot point. Recently consolidating above prior highs in the $57 area that define initial support to watch.
>>> FEATURED STOCK ARTICLE : Volume Heavy Behind Technical Breakout After Earnings - 11/1/2022 |
View all notes |
Set NEW NOTE alert |
Company Profile |
SEC
News |
Chart |
Request a new note
C
A
S
I |
CLH
-
NYSE
Clean Harbors Inc
Pollution Control
|
$111.86
|
+0.68
0.61% |
$113.47
|
409,987
90.71% of 50 DAV
50 DAV is 452,000
|
$124.49
-10.15%
|
11/2/2022
|
$121.59
|
PP = $124.59
|
|
MB = $130.82
|
Most Recent Note - 11/14/2022 6:03:33 PM
G - Color code is changed to green after slumping below its 50 DMA line ($116.20) hurting its outlook. A rebound is needed for its outlook to improve. Fundamentals remain strong after reporting Sep '22 quarterly earnings +113% on +43% sales revenues versus the year ago period.
>>> FEATURED STOCK ARTICLE : Testing 50 Day Moving Average Line After Forming New Base - 11/2/2022 |
View all notes |
Set NEW NOTE alert |
Company Profile |
SEC
News |
Chart |
Request a new note
C
A
S
I |
Symbol/Exchange
Company Name
Industry Group |
PRICE |
CHANGE
(%Change) |
Day High |
Volume
(% DAV)
(% 50 day avg vol) |
52 Wk Hi
% From Hi |
Featured
Date |
Price
Featured |
Pivot Featured |
|
Max Buy |
NPO
-
NYSE
Enpro Industries Inc
Machinery-Gen Industrial
|
$123.33
|
+1.60
1.31% |
$127.67
|
151,462
156.15% of 50 DAV
50 DAV is 97,000
|
$123.20
0.11%
|
11/4/2022
|
$119.06
|
PP = $117.73
|
|
MB = $123.62
|
Most Recent Note - 11/15/2022 2:38:33 PM
G - Color code is changed to green while posting a big gain today with below average volume, hitting a new 52-week high and rising above its "max buy" level. Reported Sep '22 quarterly earnings +65% on +34% sales revenues versus the year ago period, its 3rd strong quarterly comparison above the +25% minimum earnings guideline (C criteria), helping it better match the winning models of the fact-based investment system. Annual earnings growth has been steady even through the pandemic.
>>> FEATURED STOCK ARTICLE : Finished Strong After Highlighted in Friday Mid-Day Report - 11/4/2022 |
View all notes |
Set NEW NOTE alert |
Company Profile |
SEC
News |
Chart |
Request a new note
C
A
S
I |
DGII
-
NASDAQ
Digi International Inc
COMPUTER HARDWARE - Networking and Communication Dev
|
$41.37
|
+0.21
0.51% |
$41.73
|
409,821
98.51% of 50 DAV
50 DAV is 416,000
|
$41.88
-1.22%
|
11/10/2022
|
$41.82
|
PP = $40.96
|
|
MB = $43.01
|
Most Recent Note - 11/14/2022 6:08:15 PM
Y - Posted a 3rd consecutive gain today with lighter (average) for a best-ever close, wedging above the pivot point cited based on its 10/31/22 high plus 10 cents. Rising from an advanced "ascending base" pattern. Subsequent gains above the pivot point backed by at least +40% above average volume are needed to confirm a proper technical buy signal. Reported Sep '22 quarterly earnings +80% versus the year ago period, its 3rd strong quarterly comparison well above the +25% minimum earnings guideline (C criteria), helping it better match the fact-based investment system's winning models. Annual earnings (A criteria) history has been strong after a downturn in FY '17-18.
>>> FEATURED STOCK ARTICLE : Finish Below Pivot Point Leaves Disciplined Investors Waiting - 11/10/2022 |
View all notes |
Set NEW NOTE alert |
Company Profile |
SEC
News |
Chart |
Request a new note
C
A
S
I |
GFF
-
NYSE
Griffon Corporation
MATERIALS and CONSTRUCTION - General Building Materials
|
$34.31
|
+1.22
3.69% |
$34.90
|
373,586
105.24% of 50 DAV
50 DAV is 355,000
|
$34.92
-1.75%
|
11/10/2022
|
$34.13
|
PP = $35.02
|
|
MB = $36.77
|
Most Recent Note - 11/15/2022 2:36:04 PM
Y - Due to report Sep '22 quarterly results on 11/16/22. Volume and volatility often increase near earnings news. Today's gain has it challenging its 52-week high and pivot point. Highlighted in yellow in the 11/10/22 mid-day report with new pivot point cited based on its 9/09/22 high plus 10 cents. Subsequent gains above the pivot point backed by at least +40% above average volume may trigger a technical buy signal.
>>> FEATURED STOCK ARTICLE : Griffon Perched Near 52-Week High After 9-Week Base - 11/11/2022 |
View all notes |
Set NEW NOTE alert |
Company Profile |
SEC
News |
Chart |
Request a new note
C
A
S
I |
ANET
-
NYSE
Arista Networks Inc
Computer-Networking
|
$132.65
|
+1.45
1.11% |
$134.21
|
2,421,573
98.40% of 50 DAV
50 DAV is 2,461,000
|
$148.57
-10.72%
|
11/14/2022
|
$132.05
|
PP = $133.70
|
|
MB = $140.39
|
Most Recent Note - 11/14/2022 5:57:26 PM
Y - Finished in the middle of its intra-day range after highlighted in yellow in the earlier mid-day report with pivot point cited based on its 11/04/22 high after a cup-with-handle base. Subsequent gains and a close above the pivot point backed by at least +40% above average volume may trigger a technical buy signal. Perched near its August high with today's volume-driven gain, but it still faces some resistance due to overhead supply up to the $148 level. Reported Sep '22 quarterly earnings +69% on +57% sales revenues versus the year ago period, its 4th quarterly comparison strong and steady above the +25% minimum earnings guideline (C criteria). Annual earnings had a downturn in FY 20 like many during the pandemic. See the latest FSU analysis for more details and a new annotated graph.
>>> FEATURED STOCK ARTICLE : Finished in Middle of Intra-Day Range After Challenging Pivot Point - 11/14/2022 |
View all notes |
Set NEW NOTE alert |
Company Profile |
SEC
News |
Chart |
Request a new note
C
A
S
I |
|
|
|
THESE ARE NOT BUY RECOMMENDATIONS!
Comments contained in the body of this report are technical
opinions only. The material herein has been obtained
from sources believed to be reliable and accurate, however,
its accuracy and completeness cannot be guaranteed.
This site is not an investment advisor, hence it does
not endorse or recommend any securities or other investments.
Any recommendation contained in this report may not
be suitable for all investors and it is not to be deemed
an offer or solicitation on our part with respect to
the purchase or sale of any securities. All trademarks,
service marks and trade names appearing in this report
are the property of their respective owners, and are
likewise used for identification purposes only.
This report is a service available
only to active Paid Premium Members.
You may opt-out of receiving report notifications
at any time. Questions or comments may be submitted
by writing to Premium Membership Services 665 S.E. 10 Street, Suite 201 Deerfield Beach, FL 33441-5634 or by calling 1-800-965-8307
or 954-785-1121.
|
|
|