You are not logged in.
This means you
CAN ONLY VIEW reports that were published prior to Tuesday, April 22, 2025.
You
MUST UPGRADE YOUR MEMBERSHIP if you want to see any current reports.
AFTER MARKET UPDATE - MONDAY, SEPTEMBER 25TH, 2023
Previous After Market Report Next After Market Report >>>
|
|
|
|
DOW |
-106.58 |
33,963.84 |
-0.31% |
|
Volume |
876,676,402 |
+3% |
|
Volume |
4,324,361,000 |
-14% |
|
NASDAQ |
-12.18 |
13,211.81 |
-0.09% |
|
Advancers |
1,318 |
47% |
|
Advancers |
1,845 |
43% |
|
S&P 500 |
-9.94 |
4,320.06 |
-0.23% |
|
Decliners |
1,489 |
53% |
|
Decliners |
2,462 |
57% |
|
Russell 2000 |
-5.32 |
1,776.50 |
-0.30% |
|
52 Wk Highs |
22 |
|
|
52 Wk Highs |
35 |
|
|
S&P 600 |
-3.51 |
1,146.45 |
-0.31% |
|
52 Wk Lows |
172 |
|
|
52 Wk Lows |
365 |
|
|
Damaging losses have signaled a more serious market correction (M criteria). During market corrections, disciplined investors know to reduce exposure and raise cash by selling any weakening stocks on a case-by-case basis.
|
 |
Major Indices Posted Small Gains With Lighter Volume Totals
Kenneth J. Gruneisen - Passed the CAN SLIM® Master's Exam
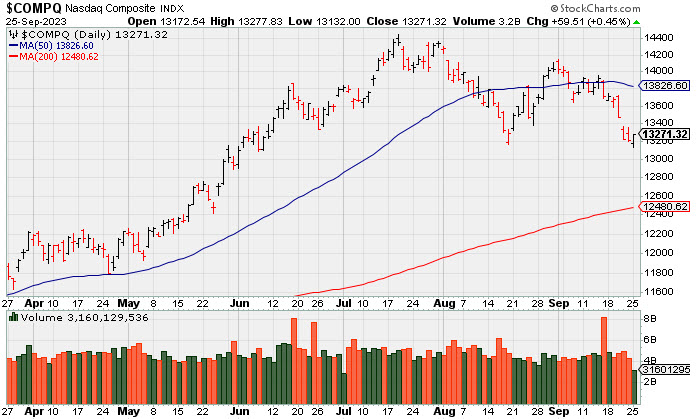
The market-cap weighted S&P 500 rose 0.4%. With Monday's gains, however, the S&P 500, Nasdaq, and Russell 2000 are still down 3.8%, 5.4%, and 6.1%, respectively, for the month. As a number of participants were out in observance of Yom Kippur, volume totals were lighter than the prior session on the NYSE and on the Nasdaq exchange. Decliners led advancers by a narrow margin on the NYSE and by a 4-3 margin on the Nasdaq exchange. There were 5 high-ranked companies from the Leaders List that hit a new 52-week high and were listed on the BreakOuts Page versus the total of 5 on the prior session. New 52-week lows totals solidly outnumbered new 52-week highs totals on the NYSE and on the Nasdaq exchange. The major indices are in a correction (M criteria). New buying efforts should be avoided until a new rally is confirmed by a solid follow-through day.
PICTURED: The Nasdaq Composite Index posted a small gain with lighter volume after a streak of 4 consecutive losses, halting its slide after undercutting its August low.
Eight of the 11 S&P 500 sectors closed in the green. The energy sector (+1.3%) saw the largest gain by a decent margin while the consumer staples sector (-0.4%) was the worst laggard.
Chicago Fed President Goolsbee was the latest Fed official to say he believes that the Fed has more to do to bring inflation back down to the target level. The 10-yr note yield jumped ten basis points to 4.54%, which is its highest level in nearly 16 years. The 2-yr note yield was unchanged at 5.12%.
|
 Kenneth J. Gruneisen started out as a licensed stockbroker in August 1987, a couple of months prior to the historic stock market crash that took the Dow Jones Industrial Average down -22.6% in a single day. He has published daily fact-based fundamental and technical analysis on high-ranked stocks online for two decades. Through FACTBASEDINVESTING.COM, Kenneth provides educational articles, news, market commentary, and other information regarding proven investment systems that work in good times and bad.
Comments contained in the body of this report are technical opinions only and are not necessarily those of Gruneisen Growth Corp. The material herein has been obtained from sources believed to be reliable and accurate, however, its accuracy and completeness cannot be guaranteed. Our firm, employees, and customers may effect transactions, including transactions contrary to any recommendation herein, or have positions in the securities mentioned herein or options with respect thereto. Any recommendation contained in this report may not be suitable for all investors and it is not to be deemed an offer or solicitation on our part with respect to the purchase or sale of any securities. |
|
 |
Retail, Energy, and Semiconductor Indexes Led Group Gainers
Kenneth J. Gruneisen - Passed the CAN SLIM® Master's Exam
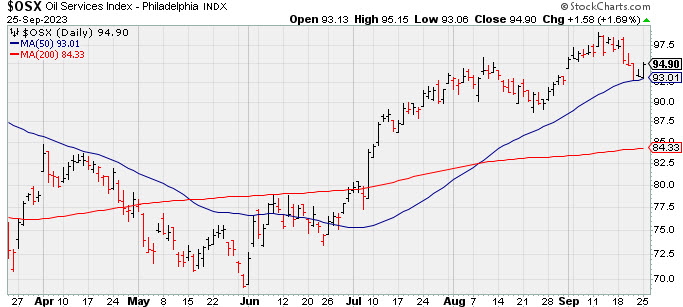
The Retail Index ($RLX +1.05%) posted a solid gain while the financials posted smaller gains as the Bank Index ($BKX +0.52%) outpaced the Broker/Dealer Index ($XBD +0.16%). The Semiconductor Index ($SOX +0.72%) rose while the Networking Index ($NWX -0.67%) and the Biotech Index ($BTK -0.21%) both edged lower. Commosdity-liniked groups were mixed as the Oil Services Index ($OSX +1.69%) and the Integrated Oil Index ($XOI +1.25%) both posted gains, meanwhile the Gold & Silver Index ($XAU -1.02%) ended lower.
PICTURED: The Oil Services Index ($OSX +1.69%) found support at its 50-day moving average (DMA) line.
| Oil Services |
$OSX |
94.90 |
+1.58 |
+1.69% |
+13.17% |
| Integrated Oil |
$XOI |
1,933.38 |
+23.89 |
+1.25% |
+8.18% |
| Semiconductor |
$SOX |
3,389.46 |
+24.17 |
+0.72% |
+33.86% |
| Networking |
$NWX |
743.64 |
-5.04 |
-0.67% |
-5.06% |
| Broker/Dealer |
$XBD |
488.78 |
+0.80 |
+0.16% |
+8.83% |
| Retail |
$RLX |
3,441.50 |
+35.76 |
+1.05% |
+24.96% |
| Gold & Silver |
$XAU |
113.41 |
-1.17 |
-1.02% |
-6.17% |
| Bank |
$BKX |
78.91 |
+0.41 |
+0.52% |
-21.75% |
| Biotech |
$BTK |
5,001.11 |
-10.50 |
-0.21% |
-5.30% |
|
|
|
 |
Lingering Below 50 DMA Line and Perched -12.3% Off High
Kenneth J. Gruneisen - Passed the CAN SLIM® Master's Exam
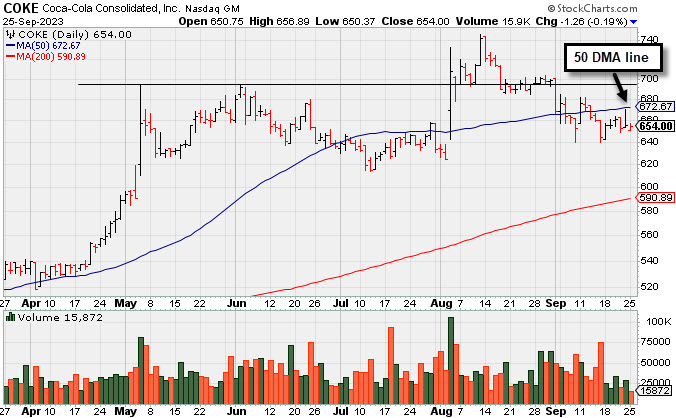
Coca-Cola Consolidated (COKE -$1.26 or -0.19% to $654.00) suffered a small loss today with very light volume. Recently it has been sputtering below its 50-day moving average (DMA) line ($672) after volume-driven losses. A rebound above the 50 DMA line is needed for its outlook to improve.
COKE was highlighted in yellow with pivot point cited based on its 5/04/23 high plus 10 cents in the 8/03/23 mid-day report. It was shown in this FSU section on 9/11/23 with an annotated graph under the headline "Rebounded Above 50-Day Moving Average".
COKE has a 99 Earnings Per Share Rating, well above the 80+ minimum for buy candidates. It reported Jun '23 quarterly earnings +54% on +9% sales revenues versus the year-ago period, continuing its strong track record. The 6 latest quarterly comparisons were well above the +25% minimum earnings guideline (C criteria). Annual earnings (A criteria) growth has been very strong after a slight downturn in FY '18.
The number of top-rated funds owning its shares rose from 379 in Jun '21 to 511 in Jun '23, a reassuring sign concerning the I criteria. Its current Up/Down Volume Ratio of 0.8 is an unbiased indication its shares have been under distributional pressure over the past 50 days. It has a Timeliness Rating of A and a Sponsorship Rating of C. There are only 5.8 million shares in the public float which can contribute to greater price volatility due to any buying or selling by the institutional crowd. |
|
|
Color Codes Explained :
Y - Better candidates highlighted by our
staff of experts.
G - Previously featured
in past reports as yellow but may no longer be buyable under the
guidelines.
***Last / Change / Volume data in this table is the closing quote data***
Symbol/Exchange
Company Name
Industry Group |
PRICE |
CHANGE
(%Change) |
Day High |
Volume
(% DAV)
(% 50 day avg vol) |
52 Wk Hi
% From Hi |
Featured
Date |
Price
Featured |
Pivot Featured |
|
Max Buy |
 STRL
-
NASDAQ
STRL
-
NASDAQ
Sterling Infrastructure
Bldg-Heavy Construction
|
$72.13
|
+0.47
0.66% |
$73.05
|
180,728
44.08% of 50 DAV
50 DAV is 410,000
|
$84.00
-14.13%
|
12/14/2022
|
$32.41
|
PP = $33.72
|
|
MB = $35.41
|
Most Recent Note - 9/21/2023 5:24:17 PM
G - Fell near its 50 DMA line ($71.38) with today's big loss on below-average volume. Fundamentals remain strong.
>>> FEATURED STOCK ARTICLE : 7th Straight Loss Off High for Sterling Infrastructure - 9/13/2023 |
View all notes |
Set NEW NOTE alert |
Company Profile |
SEC
News |
Chart |
Request a new note
C
A
S
I |
FIX
-
NYSE
Comfort Systems USA
Bldg-A/C and Heating Prds
|
$171.97
|
+1.59
0.93% |
$172.97
|
138,228
56.19% of 50 DAV
50 DAV is 246,000
|
$192.33
-10.59%
|
4/27/2023
|
$148.85
|
PP = $152.23
|
|
MB = $159.84
|
Most Recent Note - 9/21/2023 5:15:49 PM
G - Violated its 50 DMA line ($177.72) with today's gap down and 5th consecutive loss triggering a technical sell signal. Only a prompt rebound above the 50 DMA line would help its outlook improve. Fundamentals remain strong. See the latest FSU analysis for more details and a new annotated graph.
>>> FEATURED STOCK ARTICLE : Violated 50-Day Moving Average With a Damaging Gap Down - 9/21/2023 |
View all notes |
Set NEW NOTE alert |
Company Profile |
SEC
News |
Chart |
Request a new note
C
A
S
I |
CLH
-
NYSE
Clean Harbors
Pollution Control
|
$169.02
|
+1.80
1.08% |
$169.77
|
163,744
53.86% of 50 DAV
50 DAV is 304,000
|
$178.33
-5.22%
|
3/10/2023
|
$136.89
|
PP = $136.74
|
|
MB = $143.58
|
 Most Recent Note - 9/25/2023 5:26:35 PM
G - Posted a small gain with light volume today, consolidating near its 50 DMA line ($169.14). Jun '23 quarterly earnings were -13% on +3% sales revenues versus the year-ago period, below the +25% minimum earnings guideline (C criteria), raising fundamental concerns.
>>> FEATURED STOCK ARTICLE : Enduring Distributional Pressure Near 50-Day Moving Average - 9/20/2023 |
View all notes |
Set NEW NOTE alert |
Company Profile |
SEC
News |
Chart |
Request a new note
C
A
S
I |
ANET
-
NYSE
Arista Networks
Computer-Networking
|
$181.18
|
+0.84
0.47% |
$183.83
|
1,506,637
56.73% of 50 DAV
50 DAV is 2,656,000
|
$198.70
-8.82%
|
8/1/2023
|
$188.84
|
PP = $178.46
|
|
MB = $187.38
|
Most Recent Note - 9/21/2023 5:00:41 PM
G - Gapped down today violating its 50 DMA line ($180) with a loss on light volume triggering a technical sell signal and its color code is changed to green. Only a prompt rebound above the 50 DMA line would help its outlook improve. Fundamentals remain strong.
>>> FEATURED STOCK ARTICLE : Orderly Pullback Below "Max Buy" Level - 9/15/2023 |
View all notes |
Set NEW NOTE alert |
Company Profile |
SEC
News |
Chart |
Request a new note
C
A
S
I |
MEDP
-
NASDAQ
Medpace Holdings
Medical-Research Eqp/Svc
|
$244.70
|
+2.01
0.83% |
$245.62
|
176,050
60.50% of 50 DAV
50 DAV is 291,000
|
$282.73
-13.45%
|
7/25/2023
|
$196.32
|
PP = $241.57
|
|
MB = $253.65
|
Most Recent Note - 9/22/2023 5:17:23 PM
G - Halted its slide today after 6 damaging losses, abruptly retreating below the prior high ($269) and violating its 50 DMA line ($260) triggering a technical sell signal. Only a prompt rebound above the 50 DMA line would help its outlook improve. Fundamentals remain strong. See the latest FSU analysis for more details and a new annotated graph.
>>> FEATURED STOCK ARTICLE : Damaging Streak of Losses Violated 50-Day Moving Average Line - 9/22/2023 |
View all notes |
Set NEW NOTE alert |
Company Profile |
SEC
News |
Chart |
Request a new note
C
A
S
I |
Symbol/Exchange
Company Name
Industry Group |
PRICE |
CHANGE
(%Change) |
Day High |
Volume
(% DAV)
(% 50 day avg vol) |
52 Wk Hi
% From Hi |
Featured
Date |
Price
Featured |
Pivot Featured |
|
Max Buy |
COKE
-
NASDAQ
Coca-Cola Consolidated
Beverages-Non-Alcoholic
|
$654.00
|
-1.26
-0.19% |
$656.89
|
15,871
38.71% of 50 DAV
50 DAV is 41,000
|
$745.53
-12.28%
|
8/3/2023
|
$718.56
|
PP = $694.30
|
|
MB = $729.02
|
Most Recent Note - 9/25/2023 5:25:02 PM
G - Volume totals have been cooling while recently sputtering below its 50 DMA line ($672.75) after volume-driven losses. A rebound above the 50 DMA line is needed to help its outlook improve. See the latest FSU analysis for more details and a new annotated graph.
>>> FEATURED STOCK ARTICLE : Lingering Below 50 DMA Line and Perched -12.3% Off High - 9/25/2023 |
View all notes |
Set NEW NOTE alert |
Company Profile |
SEC
News |
Chart |
Request a new note
C
A
S
I |
PLUS
-
NASDAQ
ePlus
Computer-Tech Services
|
$63.74
|
+0.69
1.09% |
$64.07
|
45,451
42.08% of 50 DAV
50 DAV is 108,000
|
$75.90
-16.02%
|
8/8/2023
|
$67.60
|
PP = $62.92
|
|
MB = $66.07
|
Most Recent Note - 9/25/2023 5:27:48 PM
Y - Volume totals have been cooling while recently consolidating above its 50 DMA line ($62.46). More damaging losses may trigger a technical sell signal.
>>> FEATURED STOCK ARTICLE : Still Consolidating Above 50 DMA Line - 9/12/2023 |
View all notes |
Set NEW NOTE alert |
Company Profile |
SEC
News |
Chart |
Request a new note
C
A
S
I |
|
|
|
THESE ARE NOT BUY RECOMMENDATIONS!
Comments contained in the body of this report are technical
opinions only. The material herein has been obtained
from sources believed to be reliable and accurate, however,
its accuracy and completeness cannot be guaranteed.
This site is not an investment advisor, hence it does
not endorse or recommend any securities or other investments.
Any recommendation contained in this report may not
be suitable for all investors and it is not to be deemed
an offer or solicitation on our part with respect to
the purchase or sale of any securities. All trademarks,
service marks and trade names appearing in this report
are the property of their respective owners, and are
likewise used for identification purposes only.
This report is a service available
only to active Paid Premium Members.
You may opt-out of receiving report notifications
at any time. Questions or comments may be submitted
by writing to Premium Membership Services 665 S.E. 10 Street, Suite 201 Deerfield Beach, FL 33441-5634 or by calling 1-800-965-8307
or 954-785-1121.
|
|
|