You are not logged in.
This means you
CAN ONLY VIEW reports that were published prior to Thursday, April 10, 2025.
You
MUST UPGRADE YOUR MEMBERSHIP if you want to see any current reports.
AFTER MARKET UPDATE - FRIDAY, SEPTEMBER 16TH, 2016
Previous After Market Report Next After Market Report >>>
|
|
|
|
DOW |
-88.68 |
18,123.80 |
-0.49% |
|
Volume |
2,139,432,120 |
+161% |
|
Volume |
2,682,035,070 |
+51% |
|
NASDAQ |
-5.12 |
5,244.57 |
-0.10% |
|
Advancers |
1,064 |
36% |
|
Advancers |
1,313 |
46% |
|
S&P 500 |
-8.10 |
2,139.16 |
-0.38% |
|
Decliners |
1,924 |
64% |
|
Decliners |
1,571 |
54% |
|
Russell 2000 |
-2.25 |
1,224.78 |
-0.18% |
|
52 Wk Highs |
36 |
|
|
52 Wk Highs |
69 |
|
|
S&P 600 |
-1.11 |
740.50 |
-0.15% |
|
52 Wk Lows |
19 |
|
|
52 Wk Lows |
40 |
|
|
 |
Dow Industrials and S&P 500 Index Linger Well Below 50-Day Averages
Kenneth J. Gruneisen - Passed the CAN SLIM® Master's Exam
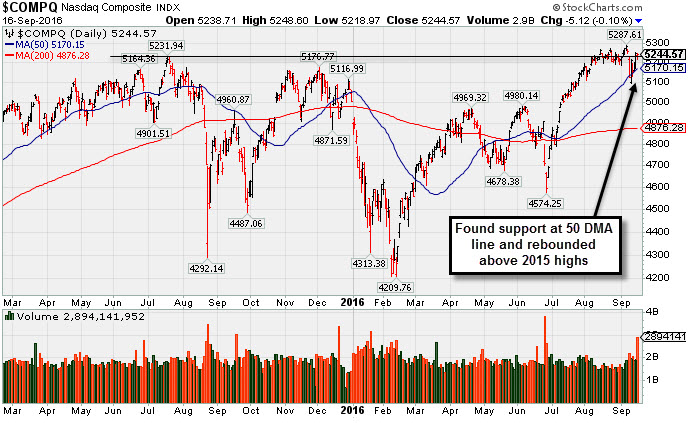
For the week, the Dow was up 0.2%, the S&P added 0.6%, and the Nasdaq gained 2.3%. Stocks finished lower on Friday. The Dow was down 88 points to 18123. The S&P 500 lost 8 points to 2139 and the Nasdaq Composite fell 5 points to 5244. The volume totals were much higher than the prior session on the NYSE and on the Nasdaq exchange, impacted by options expirations. Decliners led advancers by almost a 2-1 margin on the NYSE but by a narrower 8-7 margin on the Nasdaq exchange. Leadership improved as 28 high-ranked companies from the Leaders List made new 52-week highs and were listed on the BreakOuts Page, up from 22 on the prior session. New 52-week highs outnumbered new 52-week lows on the NYSE and on the Nasdaq exchange for a second consecutive session, an encouraging sign of improvement. PICTURED: The Nasdaq Composite Index found support at its 50-day moving average (DMA) line and rebounded above its 2015 highs.
The major indices' charts have shown the worrisome look of a "correction", and the recently noted "healthy crop" of leading stocks has withered considerably. In periods of market weakness the fact-based investment system suggests reducing exposure to stocks as they weaken and on a case-by-case basis. Technical damage for the market (M criteria) remains while both the Dow Jones Industrial Average and the S&P 500 Index have failed to rebounded from below their respective 50-day moving average (DMA) lines. The Featured Stocks Page lists noteworthy candidates that have made headway.
The major averages declined on the session as investors digested updates on the economy ahead of next week’s FOMC policy meeting. On the data front, a gauge of inflation showed that consumer prices increased 0.2% in August, above analyst expectations. Separately, a University of Michigan preliminary report on consumer sentiment came in below estimates. According to Bloomberg data, odds of a rate hike this year ticked up 4% after the optimistic inflation data.
Nine of 11 sectors in the S&P 500 finished in negative territory. Energy shares led the losses as ExxonMobil (XOM -1.23%) slid amid reports the New York attorney general is investigating the oil giant’s accounting practices. In Financials, Deutsche Bank (DB -9.35%) suffered a large loss on news the U.S. Justice Department is seeking $14 billion to settle a mortgage-backed securities probe. In earnings, Oracle (ORCL -4.75%) as the software giant’s quarterly revenue fell short of estimates. Intel (INTC +3.04%) was a notable gainer after the company raised its revenue outlook.
Treasuries finished mostly lower with the benchmark 10-year note down 1/32 to yield 1.68%. In commodities, NYMEX WTI crude lost 1.3% to $43.33/barrel. In FOREX, the Dollar Index gained 0.8%. |
 Kenneth J. Gruneisen started out as a licensed stockbroker in August 1987, a couple of months prior to the historic stock market crash that took the Dow Jones Industrial Average down -22.6% in a single day. He has published daily fact-based fundamental and technical analysis on high-ranked stocks online for two decades. Through FACTBASEDINVESTING.COM, Kenneth provides educational articles, news, market commentary, and other information regarding proven investment systems that work in good times and bad.
Comments contained in the body of this report are technical opinions only and are not necessarily those of Gruneisen Growth Corp. The material herein has been obtained from sources believed to be reliable and accurate, however, its accuracy and completeness cannot be guaranteed. Our firm, employees, and customers may effect transactions, including transactions contrary to any recommendation herein, or have positions in the securities mentioned herein or options with respect thereto. Any recommendation contained in this report may not be suitable for all investors and it is not to be deemed an offer or solicitation on our part with respect to the purchase or sale of any securities. |
|
 |
Financial, Technology and Commodity-Linked Groups Fell
Kenneth J. Gruneisen - Passed the CAN SLIM® Master's Exam
The Biotechnology Index ($BTK -2.31%) led the tech sector lower while the Networking Index ($NWX -0.53%) suffered a modest loss and the Semiconductor Index ($SOX -0.03%) finished flat on Friday. The Broker/Dealer Index ($XBD -1.00%) and the Bank Index ($BKX -1.11%) both created a drag on the major averages while the Retail Index ($RLX +0.12%) eked out a tiny gain. Commodity-linked groups were weak as the Gold & Silver Index ($XAU -1.30%), Oil Services Index ($OSX -1.07%) and the Integrated Oil Index ($XOI -0.66%) each lost ground. Charts courtesy www.stockcharts.com
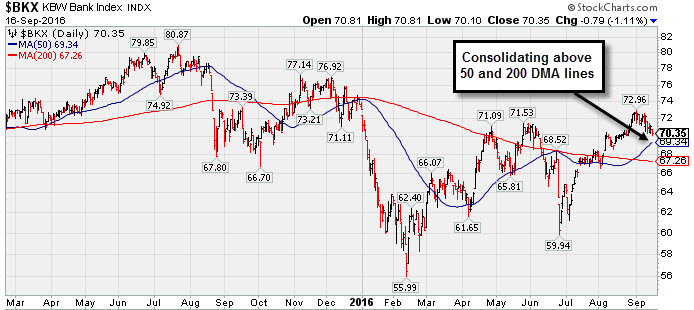
PICTURED: The Bank Index ($BKX -1.11%) is consolidating above its 50-day and 200-day moving average (DMA) lines which recently converged.
| Oil Services |
$OSX |
150.12 |
-1.62 |
-1.07% |
-4.82% |
| Integrated Oil |
$XOI |
1,102.28 |
-7.31 |
-0.66% |
+2.76% |
| Semiconductor |
$SOX |
801.55 |
-0.22 |
-0.03% |
+20.81% |
| Networking |
$NWX |
392.00 |
-2.11 |
-0.53% |
+4.27% |
| Broker/Dealer |
$XBD |
170.88 |
-1.73 |
-1.00% |
-4.05% |
| Retail |
$RLX |
1,318.12 |
+1.54 |
+0.12% |
+2.70% |
| Gold & Silver |
$XAU |
91.50 |
-1.21 |
-1.31% |
+101.99% |
| Bank |
$BKX |
70.35 |
-0.79 |
-1.11% |
-3.74% |
| Biotech |
$BTK |
3,357.98 |
-79.36 |
-2.31% |
-11.96% |
|
|
|
 |
Seriously Applying the Fact-Based System Now
Kenneth J. Gruneisen - Passed the CAN SLIM® Master's Exam
Asset Management Services Using the Fact-Based Investment System You can have professional help in limiting your losses and maximizing your gains in all market environments. For help with how your portfolio is managed click here and indicate "Find a Broker". Account minimum $250,000. |
|
|
Color Codes Explained :
Y - Better candidates highlighted by our
staff of experts.
G - Previously featured
in past reports as yellow but may no longer be buyable under the
guidelines.
***Last / Change / Volume data in this table is the closing quote data***
Symbol/Exchange
Company Name
Industry Group |
PRICE |
CHANGE
(%Change) |
Day High |
Volume
(% DAV)
(% 50 day avg vol) |
52 Wk Hi
% From Hi |
Featured
Date |
Price
Featured |
Pivot Featured |
|
Max Buy |
TDG
-
NYSE
Transdigm Group Inc
AEROSPACE/DEFENSE - Aerospace/Defense Products and; Services
|
$281.97
|
-2.35
-0.83% |
$286.17
|
767,695
229.85% of 50 DAV
50 DAV is 334,000
|
$294.38
-4.22%
|
5/11/2016
|
$248.33
|
PP = $245.00
|
|
MB = $257.25
|
 Most Recent Note - 9/16/2016 5:16:05 PM
G - Down today with twice average volume, slumping near its 50 DMA line ($280) defining important near-term support to watch.
>>> FEATURED STOCK ARTICLE : Light Volume Behind Gains Wedging for New Highs - 9/7/2016 |
View all notes |
Set NEW NOTE alert |
Company Profile |
SEC
News |
Chart |
Request a new note
C
A
S
I |
IESC
-
NASDAQ
I E S Holdings Inc
Bldg-Maintenance and Svc
|
$16.05
|
+0.03
0.19% |
$16.11
|
62,335
75.10% of 50 DAV
50 DAV is 83,000
|
$18.16
-11.62%
|
7/26/2016
|
$15.79
|
PP = $15.74
|
|
MB = $16.53
|
Most Recent Note - 9/15/2016 12:36:03 PM
G - It has found support at its 50 DMA line ($15.26) following a "negative reversal" noted on 9/06/16. Below that important short-term average, the prior low (13.50 on 8/02/16) defines the next important near-term support to watch.
>>> FEATURED STOCK ARTICLE : Strength Returned With Heavier Volume Gains for Highs - 8/30/2016 |
View all notes |
Set NEW NOTE alert |
Company Profile |
SEC
News |
Chart |
Request a new note
C
A
S
I |
NTES
-
NASDAQ
Netease Inc Adr
INTERNET - Internet Information Providers
|
$238.03
|
+0.28
0.12% |
$242.98
|
1,216,467
106.06% of 50 DAV
50 DAV is 1,147,000
|
$243.15
-2.11%
|
6/29/2016
|
$182.42
|
PP = $186.55
|
|
MB = $195.88
|
Most Recent Note - 9/14/2016 12:34:34 PM
G - Tallying considerable gains with above average volume and rallying further into new all-time high territory. It is very extended from any sound base. Its 50 DMA line ($206) defines near-term support.
>>> FEATURED STOCK ARTICLE : Pulled Back on Higher Volume Following Earnings Report - 8/18/2016 |
View all notes |
Set NEW NOTE alert |
Company Profile |
SEC
News |
Chart |
Request a new note
C
A
S
I |
HTHT
-
NASDAQ
China Lodging Group Ads
LEISURE - Lodging
|
$44.69
|
-1.21
-2.64% |
$46.00
|
172,620
79.92% of 50 DAV
50 DAV is 216,000
|
$47.72
-6.35%
|
7/13/2016
|
$38.87
|
PP = $39.29
|
|
MB = $41.25
|
Most Recent Note - 9/16/2016 5:14:50 PM
G - Perched near all-time highs, extended from any sound base. Prior highs and its 50 DMA line in the $41 area define near term support to watch on pullbacks.
>>> FEATURED STOCK ARTICLE : Volume-Driven Gains for New Highs Signal Institutional Demand - 8/17/2016 |
View all notes |
Set NEW NOTE alert |
Company Profile |
SEC
News |
Chart |
Request a new note
C
A
S
I |
PATK
-
NASDAQ
Patrick Industries Inc
WHOLESALE - Building Materials Wholesale
|
$59.58
|
-0.98
-1.62% |
$60.98
|
211,928
100.44% of 50 DAV
50 DAV is 211,000
|
$69.53
-14.31%
|
9/8/2016
|
$64.74
|
PP = $69.63
|
|
MB = $73.11
|
Most Recent Note - 9/13/2016 5:43:16 PM
G - Color code is changed to green after slumping below its 50 DMA line near prior lows. New pivot point was recently cited based on its 7/28/16 high plus 10 cents, however gains above the pivot point with heavy volume did not show up after members were reminded - "Volume-driven gains for new highs may trigger a new (or add-on) technical buy signal."
>>> FEATURED STOCK ARTICLE : Building a New Base Above 50-Day Moving Average Line - 8/31/2016 |
View all notes |
Set NEW NOTE alert |
Company Profile |
SEC
News |
Chart |
Request a new note
C
A
S
I |
Symbol/Exchange
Company Name
Industry Group |
PRICE |
CHANGE
(%Change) |
Day High |
Volume
(% DAV)
(% 50 day avg vol) |
52 Wk Hi
% From Hi |
Featured
Date |
Price
Featured |
Pivot Featured |
|
Max Buy |
LGIH
-
NASDAQ
L G I Homes Inc
Bldg-Resident/Comml
|
$35.63
|
-1.01
-2.76% |
$36.53
|
1,200,350
215.50% of 50 DAV
50 DAV is 557,000
|
$40.47
-11.96%
|
8/29/2016
|
$37.08
|
PP = $36.44
|
|
MB = $38.26
|
Most Recent Note - 9/16/2016 5:13:23 PM
Y - Ended near the session low with a loss on twice average volume undercutting prior highs in the $36 area. Testing near its 50 DMA line ($35.24), and more damaging losses leading to a violation would raise greater concerns and trigger a worrisome technical sell signal.
>>> FEATURED STOCK ARTICLE : Finished Strong While Rallying From Cup-With-Handle Base - 8/29/2016 |
View all notes |
Set NEW NOTE alert |
Company Profile |
SEC
News |
Chart |
Request a new note
C
A
S
I |
SFBS
-
NASDAQ
"ServisFirst Bancshares, Inc"
BANKING - Regional - Southeast Banks
|
$50.85
|
-0.49
-0.95% |
$51.54
|
153,197
245.90% of 50 DAV
50 DAV is 62,300
|
$53.58
-5.10%
|
7/19/2016
|
$53.28
|
PP = $52.82
|
|
MB = $55.46
|
Most Recent Note - 9/15/2016 12:47:06 PM
G - Color code is changed to green while sputtering near its 50 DMA line ($51.18). Members were previously reminded - "A volume-driven gain and strong close above the pivot point are needed to clinch a convincing technical buy signal. It has been quietly consolidating since highlighted in yellow in the 7/19/16 mid-day report with pivot point cited based on the 6/01/16 high plus 10 cents."
>>> FEATURED STOCK ARTICLE : Still Consolidating Within Close Striking Distance of New Highs - 8/25/2016 |
View all notes |
Set NEW NOTE alert |
Company Profile |
SEC
News |
Chart |
Request a new note
C
A
S
I |
INGN
-
NASDAQ
Inogen Inc
HEALTH SERVICES - Medical Instruments and Supplies
|
$60.21
|
+0.85
1.43% |
$60.33
|
341,383
170.69% of 50 DAV
50 DAV is 200,000
|
$60.71
-0.82%
|
8/5/2016
|
$51.72
|
PP = $56.08
|
|
MB = $58.88
|
Most Recent Note - 9/15/2016 12:39:23 PM
G - Consolidating above its "max buy" level, still perched near its 52-week high. Its 50 DMA line ($55.14) defines important near-term support coinciding with its Sep '15 highs. See the latest FSU analysis for additional details and an annotated graph.
>>> FEATURED STOCK ARTICLE : Stubbornly Holding Ground Near All-Time High - 9/12/2016 |
View all notes |
Set NEW NOTE alert |
Company Profile |
SEC
News |
Chart |
Request a new note
C
A
S
I |
|
|
|
THESE ARE NOT BUY RECOMMENDATIONS!
Comments contained in the body of this report are technical
opinions only. The material herein has been obtained
from sources believed to be reliable and accurate, however,
its accuracy and completeness cannot be guaranteed.
This site is not an investment advisor, hence it does
not endorse or recommend any securities or other investments.
Any recommendation contained in this report may not
be suitable for all investors and it is not to be deemed
an offer or solicitation on our part with respect to
the purchase or sale of any securities. All trademarks,
service marks and trade names appearing in this report
are the property of their respective owners, and are
likewise used for identification purposes only.
This report is a service available
only to active Paid Premium Members.
You may opt-out of receiving report notifications
at any time. Questions or comments may be submitted
by writing to Premium Membership Services 665 S.E. 10 Street, Suite 201 Deerfield Beach, FL 33441-5634 or by calling 1-800-965-8307
or 954-785-1121.
|
|
|