You are not logged in.
This means you
CAN ONLY VIEW reports that were published prior to Monday, April 7, 2025.
You
MUST UPGRADE YOUR MEMBERSHIP if you want to see any current reports.
AFTER MARKET UPDATE - FRIDAY, AUGUST 26TH, 2016
Previous After Market Report Next After Market Report >>>
|
|
|
|
DOW |
-53.01 |
18,395.40 |
-0.29% |
|
Volume |
797,000,010 |
+14% |
|
Volume |
1,471,957,690 |
+7% |
|
NASDAQ |
+6.72 |
5,218.92 |
+0.13% |
|
Advancers |
1,187 |
40% |
|
Advancers |
1,347 |
47% |
|
S&P 500 |
-3.43 |
2,169.04 |
-0.16% |
|
Decliners |
1,762 |
60% |
|
Decliners |
1,502 |
53% |
|
Russell 2000 |
-1.97 |
1,238.03 |
-0.16% |
|
52 Wk Highs |
192 |
|
|
52 Wk Highs |
141 |
|
|
S&P 600 |
-2.10 |
751.91 |
-0.28% |
|
52 Wk Lows |
11 |
|
|
52 Wk Lows |
27 |
|
|
 |
Fed Only Hints at Hikes and Indices Posted Small Losses For Week
Kenneth J. Gruneisen - Passed the CAN SLIM® Master's Exam
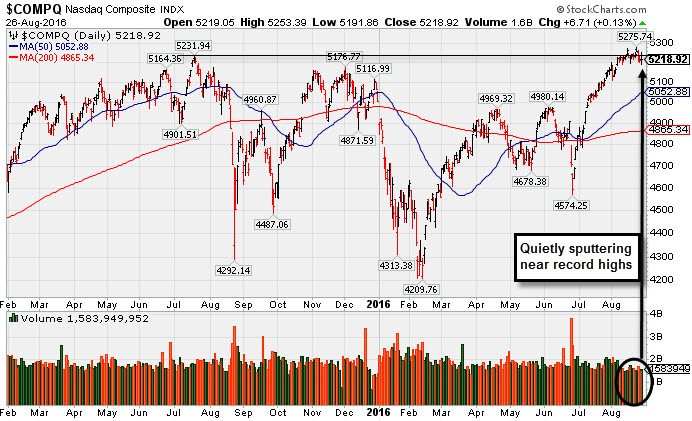
For the week, the Dow was down 0.8%, the S&P lost 0.7%, and the Nasdaq fell 0.4%. Stocks finished mostly lower on Friday. The Dow was down 53 points to 18395. The S&P 500 lost 3 points to 2169 and the Nasdaq Composite gained 6 points to 5218. Behind the losses the volume totals were higher than the prior session on the NYSE and on the Nasdaq exchange, again hinting that institutional selling pressure picked up its pace. Decliners led advancers by 3-2 on the NYSE and by 8-7 on the Nasdaq exchange. Leadership improved as there were 52 high-ranked companies from the Leaders List that made new 52-week highs and were listed on the BreakOuts Page, versus the total of 29 on the prior session. New 52-week highs totals expanded and solidly outnumbered new 52-week lows on both the NYSE and the Nasdaq exchange. PICTURED: The Nasdaq Composite Index is consolidating near its record high after briefly trading above its 2015 peak.
The "confirmed uptrend" for the market (M criteria) has recently encountered some distributional pressure. See the Featured Stocks Page which now lists a few noteworthy candidates that have made headway. The Nasdaq snapped its eight-week win streak on Friday as investors digested comments from Fed Chair Janet Yellen and Vice Chairman Stanley Fischer. Yellen signaled an optimistic approach to interest rate increases as she stated the case for rate hikes has strengthened in recent months. Equities moved lower after Fischer said Yellen’s comments were consistent with a possible September interest rate increase. On the data front, second-quarter GDP was revised down to 1.1% annualized rate from the initial 1.2% reading. Seven of 10 sectors in the S&P 500 finished in negative territory. Utilities were the worst performers retreating over 2% on the session. In earnings, Brocade (BRCD -11.66%) fell after reported weaker-than-expected IP Ethernet revenue. Herbalife (HLF -2.31%) fell with news Carl Icahn may sell his 18% stake in the company. Shares of Splunk (SPLK -10.11%) fell after being the subject of negative analyst commentary. Autodesk (ADSK +8.12%) rose as the software supplier raised its yearly guidance. Treasuries declined sharply after Fischer’s comments. The benchmark 10-year note finished 12/32 lower to yield 1.61%. In commodities, NYMEX WTI crude was little changed at $47.35/barrel. COMEX gold added 0.1% to $1321.50/ounce. In FOREX, the Dollar Index surged 0.7%. |
 Kenneth J. Gruneisen started out as a licensed stockbroker in August 1987, a couple of months prior to the historic stock market crash that took the Dow Jones Industrial Average down -22.6% in a single day. He has published daily fact-based fundamental and technical analysis on high-ranked stocks online for two decades. Through FACTBASEDINVESTING.COM, Kenneth provides educational articles, news, market commentary, and other information regarding proven investment systems that work in good times and bad.
Comments contained in the body of this report are technical opinions only and are not necessarily those of Gruneisen Growth Corp. The material herein has been obtained from sources believed to be reliable and accurate, however, its accuracy and completeness cannot be guaranteed. Our firm, employees, and customers may effect transactions, including transactions contrary to any recommendation herein, or have positions in the securities mentioned herein or options with respect thereto. Any recommendation contained in this report may not be suitable for all investors and it is not to be deemed an offer or solicitation on our part with respect to the purchase or sale of any securities. |
|
 |
Financial, Biotech and Semiconductor Indexes Rose
Kenneth J. Gruneisen - Passed the CAN SLIM® Master's Exam
The Retail Index ($RLX -0.15%) edged lower while the Broker/Dealer Index ($XBD +0.74%) and Bank Index ($BKX +0.73%) both posted modest gains on Friday. The Gold & Silver Index ($XAU -0.78%) and energy-linked groups were weak as the Oil Services Index ($OSX -0.86%) and the Integrated Oil Index ($XOI -0.21%) both finished lower. The Biotechnology Index ($BTK +0.91%) led the tech sector while the Semiconductor Index ($SOX +0.49%) posted a smaller gain but the Networking Index ($NWX -1.07%) fell. Charts courtesy www.stockcharts.com

PICTURED: The Oil Services Index ($OSX -0.86%) is consolidating above its 200-day moving average (DMA) line.
| Oil Services |
$OSX |
160.61 |
-1.40 |
-0.86% |
+1.83% |
| Integrated Oil |
$XOI |
1,141.76 |
-2.43 |
-0.21% |
+6.44% |
| Semiconductor |
$SOX |
801.40 |
+3.93 |
+0.49% |
+20.79% |
| Networking |
$NWX |
393.67 |
-4.26 |
-1.07% |
+4.72% |
| Broker/Dealer |
$XBD |
168.96 |
+1.23 |
+0.74% |
-5.13% |
| Retail |
$RLX |
1,351.65 |
-2.06 |
-0.15% |
+5.31% |
| Gold & Silver |
$XAU |
95.80 |
-0.71 |
-0.74% |
+111.48% |
| Bank |
$BKX |
71.00 |
+0.51 |
+0.72% |
-2.85% |
| Biotech |
$BTK |
3,298.12 |
+29.75 |
+0.91% |
-13.53% |
|
|
|
 |
Seriously Applying the Fact-Based System Now
Kenneth J. Gruneisen - Passed the CAN SLIM® Master's Exam
Asset Management Services Using the Winning Fact-Based Investment System - Inquire Now! You can have professional help in limiting your losses and maximizing your gains in all market environments. For help with how your portfolio is managed in 2016 and beyond click here and indicate "Find a Broker". *Accounts over $250,000 please. **Serious inquires only, please. |
|
|
Color Codes Explained :
Y - Better candidates highlighted by our
staff of experts.
G - Previously featured
in past reports as yellow but may no longer be buyable under the
guidelines.
***Last / Change / Volume data in this table is the closing quote data***
Symbol/Exchange
Company Name
Industry Group |
PRICE |
CHANGE
(%Change) |
Day High |
Volume
(% DAV)
(% 50 day avg vol) |
52 Wk Hi
% From Hi |
Featured
Date |
Price
Featured |
Pivot Featured |
|
Max Buy |
TDG
-
NYSE
Transdigm Group Inc
AEROSPACE/DEFENSE - Aerospace/Defense Products and; Services
|
$284.72
|
+0.30
0.11% |
$286.82
|
131,523
32.32% of 50 DAV
50 DAV is 407,000
|
$289.67
-1.71%
|
5/11/2016
|
$248.33
|
PP = $245.00
|
|
MB = $257.25
|
Most Recent Note - 8/22/2016 5:34:02 PM
G - Volume has been drying up while hovering in a tight range near all-time highs. Its 50 DMA line and prior highs near $268 define important near-term support to watch on pullbacks.
>>> FEATURED STOCK ARTICLE : Gains Lack Great Volume While Wedging to New Highs - 7/27/2016 |
View all notes |
Set NEW NOTE alert |
Company Profile |
SEC
News |
Chart |
Request a new note
C
A
S
I |
IESC
-
NASDAQ
I E S Holdings Inc
Bldg-Maintenance and Svc
|
$16.16
|
+0.21
1.32% |
$16.36
|
60,760
64.64% of 50 DAV
50 DAV is 94,000
|
$16.77
-3.64%
|
7/26/2016
|
$15.79
|
PP = $15.74
|
|
MB = $16.53
|
Most Recent Note - 8/23/2016 5:10:16 PM
Y - Finished near the session high with today's gain backed by below average volume. Found support above its 50 DMA line ($14.05), and the recent low (13.50 on 8/02/16) defines important near-term support.
>>> FEATURED STOCK ARTICLE : Volume-Driven Gain for New Highs Clinched Technical Buy Signal - 7/26/2016 |
View all notes |
Set NEW NOTE alert |
Company Profile |
SEC
News |
Chart |
Request a new note
C
A
S
I |
NTES
-
NASDAQ
Netease Inc Adr
INTERNET - Internet Information Providers
|
$217.71
|
+9.22
4.42% |
$218.77
|
1,288,950
116.12% of 50 DAV
50 DAV is 1,110,000
|
$217.37
0.16%
|
6/29/2016
|
$182.42
|
PP = $186.55
|
|
MB = $195.88
|
 Most Recent Note - 8/26/2016 5:42:57 PM
G - Hit a new all-time high and finished strong with today's gain on near average volume, getting more extended from any sound base. Its 50 DMA line ($195) and prior highs near $186 define support to watch on pullbacks.
>>> FEATURED STOCK ARTICLE : Pulled Back on Higher Volume Following Earnings Report - 8/18/2016 |
View all notes |
Set NEW NOTE alert |
Company Profile |
SEC
News |
Chart |
Request a new note
C
A
S
I |
HTHT
-
NASDAQ
China Lodging Group Ads
LEISURE - Lodging
|
$44.69
|
-0.33
-0.73% |
$45.20
|
139,549
61.75% of 50 DAV
50 DAV is 226,000
|
$46.57
-4.04%
|
7/13/2016
|
$38.87
|
PP = $39.29
|
|
MB = $41.25
|
Most Recent Note - 8/24/2016 12:24:02 PM
G - Poised for a best ever close with today's gain backed by above average volume. Extended from any sound base after rallying well above its "max buy" level. Recently hitting new highs with considerable volume-driven gains indicative of fresh institutional buying demand.
>>> FEATURED STOCK ARTICLE : Volume-Driven Gains for New Highs Signal Institutional Demand - 8/17/2016 |
View all notes |
Set NEW NOTE alert |
Company Profile |
SEC
News |
Chart |
Request a new note
C
A
S
I |
MXL
-
NYSE
Maxlinear Inc Cl A
Telecom-Infrastructure
|
$18.92
|
+0.41
2.22% |
$18.97
|
1,297,786
93.91% of 50 DAV
50 DAV is 1,382,000
|
$22.50
-15.91%
|
5/16/2016
|
$19.24
|
PP = $19.20
|
|
MB = $20.16
|
Most Recent Note - 8/26/2016 5:49:32 PM
G - A rebound above the 50 DMA line ($19.55) is needed for its outlook to improve. Its 200 DMA line and prior lows in the $17 area define the next important support level where violations would raise serious concerns.
>>> FEATURED STOCK ARTICLE : Consolidating Near Highs Above its "Max Buy" Level - 7/29/2016 |
View all notes |
Set NEW NOTE alert |
Company Profile |
SEC
News |
Chart |
Request a new note
C
A
S
I |
Symbol/Exchange
Company Name
Industry Group |
PRICE |
CHANGE
(%Change) |
Day High |
Volume
(% DAV)
(% 50 day avg vol) |
52 Wk Hi
% From Hi |
Featured
Date |
Price
Featured |
Pivot Featured |
|
Max Buy |
PATK
-
NASDAQ
Patrick Industries Inc
WHOLESALE - Building Materials Wholesale
|
$63.25
|
-1.11
-1.72% |
$64.47
|
148,214
66.76% of 50 DAV
50 DAV is 222,000
|
$69.53
-9.03%
|
5/24/2016
|
$53.45
|
PP = $50.68
|
|
MB = $53.21
|
Most Recent Note - 8/26/2016 5:51:56 PM
G - Quietly consolidating above the 50 DMA line and latest low ($59.51 on 8/16/16) where subsequent violations would raise concerns and trigger technical sell signals.
>>> FEATURED STOCK ARTICLE : Rallied +30% in 2 Months Since Breakout Was Featured - 7/28/2016 |
View all notes |
Set NEW NOTE alert |
Company Profile |
SEC
News |
Chart |
Request a new note
C
A
S
I |
FBHS
-
NYSE
Fortune Brands Hme & Sec
Bldg-Constr Prds/Misc
|
$63.40
|
-0.12
-0.19% |
$63.92
|
617,070
30.94% of 50 DAV
50 DAV is 1,994,600
|
$64.47
-1.66%
|
6/22/2016
|
$57.71
|
PP = $60.08
|
|
MB = $63.08
|
Most Recent Note - 8/26/2016 5:45:46 PM
G - Volume totals have been cooling while stubbornly holding its ground in a tight range near its 52-week high. Prior highs and its 50 DMA line define near-term support in the $60-61 area.
>>> FEATURED STOCK ARTICLE : Perched Above "Max Buy" Level Following Volume-Driven Gain - 8/1/2016 |
View all notes |
Set NEW NOTE alert |
Company Profile |
SEC
News |
Chart |
Request a new note
C
A
S
I |
NVEE
-
NASDAQ
N V 5 Global Inc
Comml Svcs-Consulting
|
$31.80
|
-0.27
-0.84% |
$32.40
|
39,727
44.64% of 50 DAV
50 DAV is 89,000
|
$37.00
-14.05%
|
4/19/2016
|
$28.20
|
PP = $28.10
|
|
MB = $29.51
|
Most Recent Note - 8/24/2016 12:33:40 PM
G - Rebounded from the session's early lows after testing its 50 DMA line ($30.83). The 50 DMA line and prior highs in the $30 define important near-term support. More damaging losses would raise concerns and trigger technical sell signals.
>>> FEATURED STOCK ARTICLE : Technically Strong Despite Fundamental Concerns - 8/22/2016 |
View all notes |
Set NEW NOTE alert |
Company Profile |
SEC
News |
Chart |
Request a new note
C
A
S
I |
SFBS
-
NASDAQ
Servisfirst Bancshares
BANKING - Regional - Southeast Banks
|
$52.21
|
+0.23
0.44% |
$52.72
|
85,589
92.03% of 50 DAV
50 DAV is 93,000
|
$53.58
-2.56%
|
7/19/2016
|
$53.28
|
PP = $52.82
|
|
MB = $55.46
|
Most Recent Note - 8/25/2016 5:04:41 PM
Y - Quietly consolidating within close striking distance of its 52-week high. Members were previously reminded - "A volume-driven gain and strong close above the pivot point are needed to clinch a convincing technical buy signal. It has been quietly consolidating since highlighted in yellow in the 7/19/16 mid-day report with pivot point cited based on the 6/01/16 high plus 10 cents." See the latest FSU analysis for more details and a new annotated graph.
>>> FEATURED STOCK ARTICLE : Still Consolidating Within Close Striking Distance of New Highs - 8/25/2016 |
View all notes |
Set NEW NOTE alert |
Company Profile |
SEC
News |
Chart |
Request a new note
C
A
S
I |
INGN
-
NASDAQ
Inogen Inc
HEALTH SERVICES - Medical Instruments and Supplies
|
$57.51
|
-0.16
-0.28% |
$57.91
|
121,753
54.11% of 50 DAV
50 DAV is 225,000
|
$58.78
-2.16%
|
8/5/2016
|
$51.72
|
PP = $56.08
|
|
MB = $58.88
|
Most Recent Note - 8/23/2016 5:11:33 PM
Y - Posted a gain with higher volume today and challenged its 52-week high. Stalled after its 8/09/16 volume-driven gain triggered a technical buy signal.
>>> FEATURED STOCK ARTICLE : Perched Within Striking Distance of Highs Following Rebound - 8/5/2016 |
View all notes |
Set NEW NOTE alert |
Company Profile |
SEC
News |
Chart |
Request a new note
C
A
S
I |
Symbol/Exchange
Company Name
Industry Group |
PRICE |
CHANGE
(%Change) |
Day High |
Volume
(% DAV)
(% 50 day avg vol) |
52 Wk Hi
% From Hi |
Featured
Date |
Price
Featured |
Pivot Featured |
|
Max Buy |
OLLI
-
NASDAQ
Ollie's Bargain Outlet
Retail-DiscountandVariety
|
$26.42
|
-0.28
-1.05% |
$26.98
|
504,095
78.40% of 50 DAV
50 DAV is 643,000
|
$28.72
-8.01%
|
7/19/2016
|
$26.42
|
PP = $28.82
|
|
MB = $30.26
|
Most Recent Note - 8/25/2016 5:06:35 PM
Y - Gapped down and finished near the session low today with a large loss on higher volume indicative of distributional pressure. Members were repeatedly reminded in prior notes - "Volume-driven gains above the pivot point are still needed to trigger a convincing technical buy signal." See the latest FSU analysis for additional details and an annotated graph.
>>> FEATURED STOCK ARTICLE : Near High Awaiting Volume-Driven Gain to Trigger Technical Buy Signal - 8/24/2016 |
View all notes |
Set NEW NOTE alert |
Company Profile |
SEC
News |
Chart |
Request a new note
C
A
S
I |
|
|
|
THESE ARE NOT BUY RECOMMENDATIONS!
Comments contained in the body of this report are technical
opinions only. The material herein has been obtained
from sources believed to be reliable and accurate, however,
its accuracy and completeness cannot be guaranteed.
This site is not an investment advisor, hence it does
not endorse or recommend any securities or other investments.
Any recommendation contained in this report may not
be suitable for all investors and it is not to be deemed
an offer or solicitation on our part with respect to
the purchase or sale of any securities. All trademarks,
service marks and trade names appearing in this report
are the property of their respective owners, and are
likewise used for identification purposes only.
This report is a service available
only to active Paid Premium Members.
You may opt-out of receiving report notifications
at any time. Questions or comments may be submitted
by writing to Premium Membership Services 665 S.E. 10 Street, Suite 201 Deerfield Beach, FL 33441-5634 or by calling 1-800-965-8307
or 954-785-1121.
|
|
|