You are not logged in.
This means you
CAN ONLY VIEW reports that were published prior to Tuesday, February 18, 2025.
You
MUST UPGRADE YOUR MEMBERSHIP if you want to see any current reports.
AFTER MARKET UPDATE - MONDAY, AUGUST 22ND, 2022
Previous After Market Report Next After Market Report >>>
|
|
|
|
DOW |
-643.13 |
33,063.61 |
-1.91% |
|
Volume |
841,913,257 |
-4% |
|
Volume |
4,236,660,000 |
-7% |
|
NASDAQ |
-323.64 |
12,381.57 |
-2.55% |
|
Advancers |
510 |
17% |
|
Advancers |
1,054 |
24% |
|
S&P 500 |
-90.49 |
4,137.99 |
-2.14% |
|
Decliners |
2,569 |
83% |
|
Decliners |
3,257 |
76% |
|
Russell 2000 |
-41.60 |
1,915.74 |
-2.13% |
|
52 Wk Highs |
20 |
|
|
52 Wk Highs |
42 |
|
|
S&P 600 |
-28.53 |
1,239.64 |
-2.25% |
|
52 Wk Lows |
88 |
|
|
52 Wk Lows |
195 |
|
|
 |
Lighter Volume Totals as Major Indices Suffered Bigger Losses
Kenneth J. Gruneisen - Passed the CAN SLIM® Master's Exam
The Dow lost 643 points, while the broader S&P 500 retreated 2.1%, with both indexes weathering their steepest single-session drops since June 16. The latter remains more than 12.8% above its mid-June low, though failed to reclaim its 200-day moving average (a closely watched technical level) last week. The Nasdaq Composite fell 2.6% for its worst day in nearly a month amid weakness in tech shares. The volume totals reported were lighter than the prior session on the NYSE and on the Nasdaq exchange. Breadth was negative as decliners led advancers by a 5-1 margin on the NYSE and by a 3-1 margin on the Nasdaq exchange. Leadership thinned as there were 7 high-ranked companies from the Leaders List that hit new 52-week highs and were listed on the BreakOuts Page, down from the total of 15 on the prior session. New 52-week lows totals expanded and outnumbered shrinking new 52-week highs on the NYSE and on the Nasdaq exchange. The market is in a confirmed uptrend (M criteria). Any sustainable rally requires a healthy crop of leading stocks hitting new highs, so the recent improvement in leadership was a reassuring sign.
Chart courtesy of www.stockcharts.com%20on%20Tuesday.%20Yesterday,%20the%20broad%20benchmark%20eclipsed%20the%204,300%20level%20for%20the%20first%20time%20since%20late%20April.%20The%20Nasdaq%20Composite%20fell%201.3%%20amid%20weakness%20in%20mega-cap%20tech%20shares.%20The%20volume%20totals%20reported%20were%20mixed,%20lighter%20than%20the%20prior%20session%20on%20the%20NYSE%20and%20higher%20on%20the%20Nasdaq%20exchange.%20Decliners%20led%20advancers%20by%20a%204-1%20margin%20on%20the%20NYSE%20ad%20by%20a%203-1%20margin%20on%20the%20Nasdaq%20exchange.%20There%20were%2017%20high-ranked%20companies%20from%20the%20Leaders%20List%20that%20hit%20new%2052-week%20highs%20and%20were%20listed%20on%20the%20BreakOuts%20Page,%20down%20from%20the%20total%20of%2045%20on%20the%20prior%20session.%20New%2052-week%20highs%20outnumbered%20new%2052-week%20lows%20on%20the%20NYSE,%20but%20new%20lows%20outnumbered%20new%20highs%20on%20the%20Nasdaq%20exchange.%20The%20market%20is%20in%20a%20confirmed%20uptrend%20(M%20criteria).%20Any%20sustainable%20rally%20requires%20a%20healthy%20crop%20of%20leading%20stocks%20hitting%20new%20highs,%20so%20the%20recent%20improvement%20in%20leadership%20was%20a%20reassuring%20sign.) 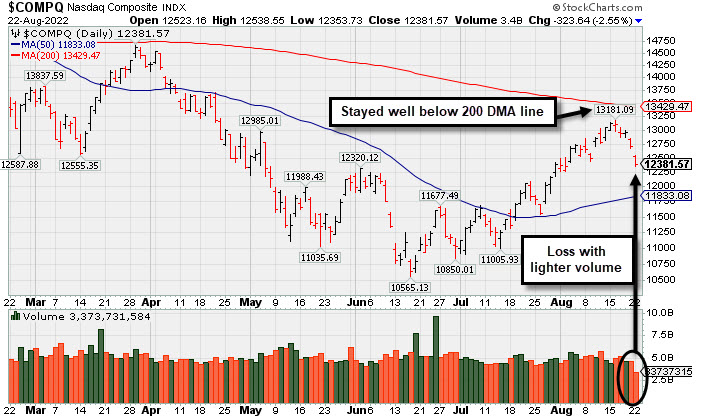 PICTURED: The Nasdaq Composite Index suffered a big loss Monday with lighter volume. Its rebound stalled well below its downward sloping 200-day moving average (DMA) line.
U.S. stocks finished firmly lower on Monday as Wall Street’s summer rally stalled amid jitters over monetary policy tightening. Investors struck a perceived risk-off tone, looking toward the Federal Reserve’s (Fed) Jackson Hole central bank forum later this week. Fed Chair Jerome Powell is slated to speak on Friday, with market participants widely expecting his comments to skew hawkish, reiterating the need for further interest rate hikes to tame inflation.
All 11 S&P 500 sectors closed in negative territory, with Consumer Discretionary, Technology, and Communication Services all leading the downturn. The CBOE Volatility Index (VIX) broke out of its recent trading range to a peak not seen in three weeks.
Growth-related pockets of the market were particularly under pressure as the yield on the 10-year Treasury note jumped six basis points (0.06%) to 3.03%, its highest level in a month. A gauge of the U.S. dollar spiked 0.7% to a fresh five-week high on the heels of its best week since April 2020 (+2.1%). In commodities, West Texas Intermediate crude slipped 0.6% to $90.23/barrel as lingering recessionary concerns weighed on the outlook for demand. |
 Kenneth J. Gruneisen started out as a licensed stockbroker in August 1987, a couple of months prior to the historic stock market crash that took the Dow Jones Industrial Average down -22.6% in a single day. He has published daily fact-based fundamental and technical analysis on high-ranked stocks online for two decades. Through FACTBASEDINVESTING.COM, Kenneth provides educational articles, news, market commentary, and other information regarding proven investment systems that work in good times and bad.
Comments contained in the body of this report are technical opinions only and are not necessarily those of Gruneisen Growth Corp. The material herein has been obtained from sources believed to be reliable and accurate, however, its accuracy and completeness cannot be guaranteed. Our firm, employees, and customers may effect transactions, including transactions contrary to any recommendation herein, or have positions in the securities mentioned herein or options with respect thereto. Any recommendation contained in this report may not be suitable for all investors and it is not to be deemed an offer or solicitation on our part with respect to the purchase or sale of any securities. |
|
 |
Retail, Financial, and Tech Indexes Led Broad Market Pullback
Kenneth J. Gruneisen - Passed the CAN SLIM® Master's Exam
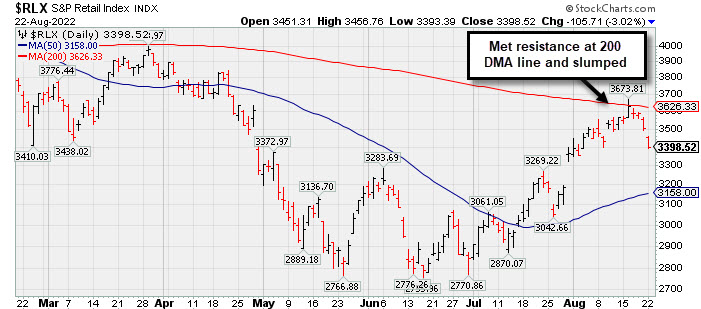
The Retail Index ($RLX -3.02%) and financials created a drag on the major averages as the Broker/Dealer Index ($XBD -2.09%) and Bank Index ($BKX -2.29%) each lost ground. The Semiconductor Index ($SOX -3.72%) led the tech sector lower while the Networking Index ($NWX -2.44%) also suffered a big loss and the Biotech Index ($BTK -1.42%) followed with a smaller loss. Commodity-linked groups were quieter as the Oil Services Index ($OSX -0.66%) edged lower while the Integrated Oil Index ($XOI +0.01%) and Gold & Silver Index ($XAU -0.14%) both were little changed.
PICTURED: The Retail Index ($RLX -3.02%) met resistance near its 200-day moving average (DMA) line and has slumped.
| Oil Services |
$OSX |
68.24 |
-0.46 |
-0.66% |
+29.44% |
| Integrated Oil |
$XOI |
1,629.93 |
+0.24 |
+0.01% |
+38.34% |
| Semiconductor |
$SOX |
2,843.37 |
-109.97 |
-3.72% |
-27.95% |
| Networking |
$NWX |
818.50 |
-20.50 |
-2.44% |
-15.71% |
| Broker/Dealer |
$XBD |
446.29 |
-9.54 |
-2.09% |
-8.33% |
| Retail |
$RLX |
3,398.52 |
-105.71 |
-3.02% |
-19.59% |
| Gold & Silver |
$XAU |
103.92 |
-0.15 |
-0.14% |
-21.54% |
| Bank |
$BKX |
109.59 |
-2.57 |
-2.29% |
-17.12% |
| Biotech |
$BTK |
4,820.58 |
-69.59 |
-1.42% |
-12.65% |
|
|
|
 |
Pulling Back From All-Time High After Volume-Driven Gains
Kenneth J. Gruneisen - Passed the CAN SLIM® Master's Exam
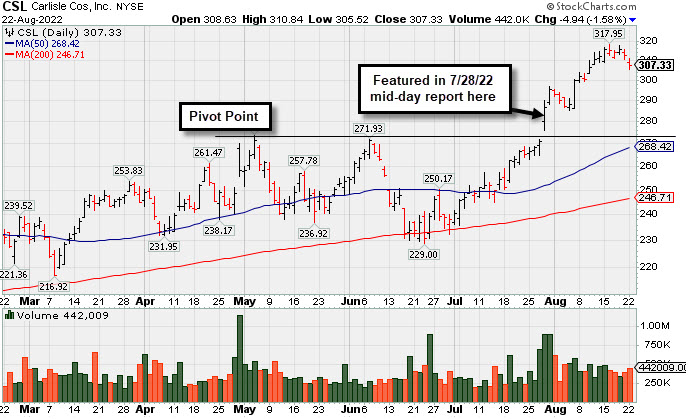
Carlisle Cos Inc (CSL -$4.94 or -1.58% to $307.33) pulled back from its all-time high with near average volume behind today's second consecutive loss. It has been noted as very extended from the previously noted base. Prior highs in the $275 area define initial support to watch on pullbacks.
Bullish action continued since highlighted in yellow in the 7/28/22 mid-day report with pivot point cited based on its 5/04/22 high plus 10 cents. It was last shown in detail in this FSU section on 8/02/22 with an annotated graph under the headline, "Carlisle Perched at All-Time High After Noted Breakout".
CSL has a 97 Earnings Per Share Rating. It recently reported Jun '22 quarterly earnings +185% on +57% sales revenues versus the year ago period, its 4th very strong quarter well above the +25% minimum earnings guideline (C criteria). Annual earnings (A criteria) history included a small downturn in FY '20 that was previously noted.
There are 51.7 million shares outstanding, which can contribute to greater price volatility in the event of institutional buying or selling. The number of top-rated funds owning its shares rose from 772 in Sep '21 to 827 in Jun '22, a reassuring sign concerning the I criteria. Its current Up/Down Volume Ratio of 1.8 is an unbiased indication its shares have been under accumulation over the past 50 days.
|
|
|
Color Codes Explained :
Y - Better candidates highlighted by our
staff of experts.
G - Previously featured
in past reports as yellow but may no longer be buyable under the
guidelines.
***Last / Change / Volume data in this table is the closing quote data***
Symbol/Exchange
Company Name
Industry Group |
PRICE |
CHANGE
(%Change) |
Day High |
Volume
(% DAV)
(% 50 day avg vol) |
52 Wk Hi
% From Hi |
Featured
Date |
Price
Featured |
Pivot Featured |
|
Max Buy |
 IMXI
-
NASDAQ
IMXI
-
NASDAQ
International Money Exp
Financial Svcs-Specialty
|
$25.24
|
-0.21
-0.83% |
$25.65
|
330,047
63.35% of 50 DAV
50 DAV is 521,000
|
$26.23
-3.77%
|
7/1/2022
|
$21.27
|
PP = $21.38
|
|
MB = $22.45
|
Most Recent Note - 8/19/2022 5:14:39 PM
G - Gapped down today for a small loss on lighter volume, retreating from its all-time high. It has been noted as extended from the previously noted base. Prior highs in the $22 area and its 50 DMA line ($22.44) define important near-term support to watch. Reported Jun '22 quarterly earnings +21% on +17% sales revenues versus the year ago period, below the +25% minimum earnings guideline (C criteria).
>>> FEATURED STOCK ARTICLE : Finished Strong With Another Volume-Driven Gain After Earnings - 8/3/2022 |
View all notes |
Set NEW NOTE alert |
Company Profile |
SEC
News |
Chart |
Request a new note
C
A
S
I |
HRMY
-
NASDAQ
Harmony Biosciences Holdings
Medical-Biomed/Biotech
|
$46.87
|
-0.21
-0.45% |
$47.91
|
5,952
0.88% of 50 DAV
50 DAV is 673,000
|
$57.13
-17.96%
|
7/6/2022
|
$54.12
|
PP = $52.85
|
|
MB = $55.49
|
 Most Recent Note - 8/22/2022 6:11:24 PM
G - Volume totals have cooled after damaging losses while it has failed to rebound after violating its 50 DMA line ($50.58) and prior low ($48.85) triggering technical sell signals. Only a prompt rebound above the 50 DMA line would help its outlook improve. Met stubborn resistance in the $57 area after reporting Jun '22 quarterly earnings +54% on +45% sales revenues versus the year ago period.
>>> FEATURED STOCK ARTICLE : Churning Higher Volume While Perched Near High After Earnings News - 8/4/2022 |
View all notes |
Set NEW NOTE alert |
Company Profile |
SEC
News |
Chart |
Request a new note
C
A
S
I |
CI
-
NYSE
Cigna Corp
Medical-Managed Care
|
$291.50
|
-1.48
-0.51% |
$292.65
|
1,346,585
66.70% of 50 DAV
50 DAV is 2,019,000
|
$293.96
-0.84%
|
7/7/2022
|
$276.55
|
PP = $273.68
|
|
MB = $287.36
|
Most Recent Note - 8/22/2022 6:06:40 PM
G - Volume totals have been cooling while hovering at its all-time high holding its ground after rising above its "max buy" level. Reported earnings for the Jun '22 quarter rose +19% on +5% sales revenues versus the year ago period, breaking a streak of 3 quarterly earnings increases above the +25% minimum guideline (C criteria), raising concerns. Near-term support to watch is at its 50 DMA line ($271.67).
>>> FEATURED STOCK ARTICLE : Wedging Higher With Lighter Volume Behind Gain for New High - 8/9/2022 |
View all notes |
Set NEW NOTE alert |
Company Profile |
SEC
News |
Chart |
Request a new note
C
A
S
I |
AN
-
NYSE
Autonation Inc
SPECIALTY RETAIL - Auto Dealerships
|
$124.42
|
-1.16
-0.92% |
$125.27
|
669,042
94.36% of 50 DAV
50 DAV is 709,000
|
$135.57
-8.22%
|
7/20/2022
|
$122.03
|
PP = $126.49
|
|
MB = $132.81
|
Most Recent Note - 8/22/2022 6:08:53 PM
Y - Fell today with near average volume for a 4th consecutive small loss, but raised concerns while undercutting prior highs in the $126 area which were noted as initial support to watch. Faces no resistance due to overhead supply. Reported Jun '22 quarterly earnings +34% on -2% sales revenues versus the year ago period.
>>> FEATURED STOCK ARTICLE : Autonation Hovering Near Stubborn Resistance - 8/11/2022 |
View all notes |
Set NEW NOTE alert |
Company Profile |
SEC
News |
Chart |
Request a new note
C
A
S
I |
ESQ
-
NASDAQ
Esquire Financial Hldgs
Finance-Commercial Loans
|
$39.23
|
-1.53
-3.75% |
$40.06
|
16,300
27.17% of 50 DAV
50 DAV is 60,000
|
$41.68
-5.88%
|
7/26/2022
|
$37.74
|
PP = $39.19
|
|
MB = $41.15
|
Most Recent Note - 8/22/2022 6:03:30 PM
Y - Pulled back today with lighter than average volume. Wedged above resistance in the $39 area with recent gains lacking volume conviction. Confirming gains above the pivot point backed by at least +40% above average volume may help clinch a proper technical buy signal. Its 50 DMA line ($35.74) defines important near-term support.
>>> FEATURED STOCK ARTICLE : Closed at Session High With Gain for New All-Time High - 8/12/2022 |
View all notes |
Set NEW NOTE alert |
Company Profile |
SEC
News |
Chart |
Request a new note
C
A
S
I |
Symbol/Exchange
Company Name
Industry Group |
PRICE |
CHANGE
(%Change) |
Day High |
Volume
(% DAV)
(% 50 day avg vol) |
52 Wk Hi
% From Hi |
Featured
Date |
Price
Featured |
Pivot Featured |
|
Max Buy |
GPK
-
NYSE
Graphic Packaging Hldg
CONSUMER NON-DURABLES - Packaging and Containers
|
$23.14
|
-0.10
-0.43% |
$23.34
|
3,168,031
105.15% of 50 DAV
50 DAV is 3,013,000
|
$23.71
-2.40%
|
7/26/2022
|
$22.63
|
PP = $23.09
|
|
MB = $24.24
|
Most Recent Note - 8/18/2022 5:30:34 PM
Y - Posted a gain today with average volume for a best-ever close by 3 cents. Churned heavy volume but made limited progress since its 8/10/22 breakout, action indicative of distributional pressure.
>>> FEATURED STOCK ARTICLE : Churned Heavy Volume Perched at High After 6 Straight Gains - 8/15/2022 |
View all notes |
Set NEW NOTE alert |
Company Profile |
SEC
News |
Chart |
Request a new note
C
A
S
I |
CSL
-
NYSE
Carlisle Cos Inc
Diversified Operations
|
$307.33
|
-4.94
-1.58% |
$310.84
|
442,009
109.68% of 50 DAV
50 DAV is 403,000
|
$318.71
-3.57%
|
7/28/2022
|
$282.31
|
PP = $275.23
|
|
MB = $288.99
|
Most Recent Note - 8/22/2022 6:01:33 PM
G - Pulled back today for a 2nd consecutive loss, retreating from its all-time high after getting very extended from the previously noted base. Prior highs in the $275 area define initial support to watch along with its 50 DMA line ($269). See the latest FSU analysis for more details and a new annotated graph.
>>> FEATURED STOCK ARTICLE : Pulling Back From All-Time High After Volume-Driven Gains - 8/22/2022 |
View all notes |
Set NEW NOTE alert |
Company Profile |
SEC
News |
Chart |
Request a new note
C
A
S
I |
ENPH
-
NASDAQ
Enphase Energy Inc
Energy-Solar
|
$280.76
|
-2.94
-1.04% |
$285.20
|
2,315,275
69.24% of 50 DAV
50 DAV is 3,344,000
|
$308.88
-9.10%
|
7/28/2022
|
$276.66
|
PP = $282.55
|
|
MB = $296.68
|
Most Recent Note - 8/19/2022 5:03:09 PM
Y - Gapped down today after hovering near its all-time high in recent weeks with volume totals cooling. The prior high in the $282 area has been noted as initial support to watch on pullbacks. Fundamentals remain strong. See the latest FSU analysis for more details and a new annotated graph.
>>> FEATURED STOCK ARTICLE : Enphase Energy Consolidating After Rallying to New Highs - 8/19/2022 |
View all notes |
Set NEW NOTE alert |
Company Profile |
SEC
News |
Chart |
Request a new note
C
A
S
I |
PWR
-
NYSE
Quanta Services Inc
MATERIALS and CONSTRUCTION - General Contractors
|
$140.01
|
-2.01
-1.42% |
$142.35
|
652,231
52.94% of 50 DAV
50 DAV is 1,232,000
|
$146.84
-4.65%
|
7/28/2022
|
$141.83
|
PP = $140.14
|
|
MB = $147.15
|
Most Recent Note - 8/19/2022 5:16:34 PM
Y - Pulled back today with light volume. Volume totals have been below average while recently wedging back above its pivot point since encountering some distributional pressure. Confirming volume-driven gains for new highs would be a reassuring sign of serious institutional buying demand. Its 50 DMA line ($131.36) defines important near-term support to watch. Fundamentals remain strong.
>>> FEATURED STOCK ARTICLE : Stalled After Breakout But Still Quietly Hovering Near High - 8/16/2022 |
View all notes |
Set NEW NOTE alert |
Company Profile |
SEC
News |
Chart |
Request a new note
C
A
S
I |
CLFD
-
NASDAQ
Clearfield Inc
TELECOMMUNICATIONS - Cables / Satalite Equipment
|
$119.26
|
-4.19
-3.39% |
$121.55
|
251,596
76.47% of 50 DAV
50 DAV is 329,000
|
$124.23
-4.00%
|
7/29/2022
|
$94.10
|
PP = $86.81
|
|
MB = $91.15
|
Most Recent Note - 8/22/2022 6:05:35 PM
G - Pulled back today with below average volume. Remains very extended from any sound base. Prior high in the $86 area defines initial support to watch above its 50 DMA line. Fundamentals remain strong.
>>> FEATURED STOCK ARTICLE : Clearfield Showed Resilience After Considerable Rally - 8/17/2022 |
View all notes |
Set NEW NOTE alert |
Company Profile |
SEC
News |
Chart |
Request a new note
C
A
S
I |
Symbol/Exchange
Company Name
Industry Group |
PRICE |
CHANGE
(%Change) |
Day High |
Volume
(% DAV)
(% 50 day avg vol) |
52 Wk Hi
% From Hi |
Featured
Date |
Price
Featured |
Pivot Featured |
|
Max Buy |
GFF
-
NYSE
Griffon Corporation
MATERIALS and CONSTRUCTION - General Building Materials
|
$33.52
|
+0.29
0.87% |
$33.97
|
563,671
124.43% of 50 DAV
50 DAV is 453,000
|
$34.35
-2.42%
|
8/8/2022
|
$32.46
|
PP = $31.12
|
|
MB = $32.68
|
Most Recent Note - 8/22/2022 6:04:21 PM
G - Posted a solid gain today backed by above average volume, hovering near its 52-week high. Prior highs in the $31 area define initial support to watch on pullbacks.
>>> FEATURED STOCK ARTICLE : Breakout for New High Backed by +52% Above Average Volume - 8/8/2022 |
View all notes |
Set NEW NOTE alert |
Company Profile |
SEC
News |
Chart |
Request a new note
C
A
S
I |
CLH
-
NYSE
Clean Harbors Inc
Pollution Control
|
$115.01
|
-2.03
-1.73% |
$116.15
|
250,326
79.72% of 50 DAV
50 DAV is 314,000
|
$118.92
-3.29%
|
8/10/2022
|
$111.78
|
PP = $115.10
|
|
MB = $120.86
|
Most Recent Note - 8/18/2022 5:26:44 PM
Y - Posted a quiet gain today. Gain and strong close above the pivot point backed by +116% above average volume on 8/12/22 triggered a technical buy signal. No resistance remains due to overhead supply. Fundamentals remain strong.
>>> FEATURED STOCK ARTICLE : Pollution Control Firm Perched Near Prior High - 8/10/2022 |
View all notes |
Set NEW NOTE alert |
Company Profile |
SEC
News |
Chart |
Request a new note
C
A
S
I |
SNPS
-
NASDAQ
Synopsys Inc
COMPUTER SOFTWARE and SERVICES - Technical and System Software
|
$358.10
|
-4.90
-1.35% |
$361.60
|
1,296,319
137.61% of 50 DAV
50 DAV is 942,000
|
$391.17
-8.45%
|
8/17/2022
|
$381.37
|
PP = $377.70
|
|
MB = $396.59
|
Most Recent Note - 8/19/2022 12:23:26 PM
G - Color code is changed to green due to fundamental concerns while pulling back today for a 4th consecutive loss marked by above average volume, encountering distributional pressure since reaching a new all-time high. Reported Jul '22 quarterly earnings +16% on +18% sales revenues versus the year ago period, below the +25% minimum earnings guideline (C criteria), raising fundamental concerns. Renewed strength and subsequent gains above the pivot point backed by at least +40% above average volume are needed to clinch a technical buy signal.
>>> FEATURED STOCK ARTICLE : Earnings Report Below +25% Minimum and Encountering Distributional Pressure - 8/18/2022 |
View all notes |
Set NEW NOTE alert |
Company Profile |
SEC
News |
Chart |
Request a new note
C
A
S
I |
|
|
|
THESE ARE NOT BUY RECOMMENDATIONS!
Comments contained in the body of this report are technical
opinions only. The material herein has been obtained
from sources believed to be reliable and accurate, however,
its accuracy and completeness cannot be guaranteed.
This site is not an investment advisor, hence it does
not endorse or recommend any securities or other investments.
Any recommendation contained in this report may not
be suitable for all investors and it is not to be deemed
an offer or solicitation on our part with respect to
the purchase or sale of any securities. All trademarks,
service marks and trade names appearing in this report
are the property of their respective owners, and are
likewise used for identification purposes only.
This report is a service available
only to active Paid Premium Members.
You may opt-out of receiving report notifications
at any time. Questions or comments may be submitted
by writing to Premium Membership Services 665 S.E. 10 Street, Suite 201 Deerfield Beach, FL 33441-5634 or by calling 1-800-965-8307
or 954-785-1121.
|
|
|