You are not logged in.
This means you
CAN ONLY VIEW reports that were published prior to Thursday, April 17, 2025.
You
MUST UPGRADE YOUR MEMBERSHIP if you want to see any current reports.
AFTER MARKET UPDATE - FRIDAY, JULY 7TH, 2023
Previous After Market Report Next After Market Report >>>
|
|
|
|
DOW |
-187.38 |
33,734.88 |
-0.55% |
|
Volume |
941,100,073 |
+4% |
|
Volume |
5,216,598,200 |
-15% |
|
NASDAQ |
-18.33 |
13,660.72 |
-0.13% |
|
Advancers |
2,041 |
71% |
|
Advancers |
2,853 |
65% |
|
S&P 500 |
-12.64 |
4,398.95 |
-0.29% |
|
Decliners |
817 |
29% |
|
Decliners |
1,533 |
35% |
|
Russell 2000 |
+22.43 |
1,864.66 |
+1.22% |
|
52 Wk Highs |
54 |
|
|
52 Wk Highs |
58 |
|
|
S&P 600 |
+11.91 |
1,199.83 |
+1.00% |
|
52 Wk Lows |
19 |
|
|
52 Wk Lows |
66 |
|
|
 |
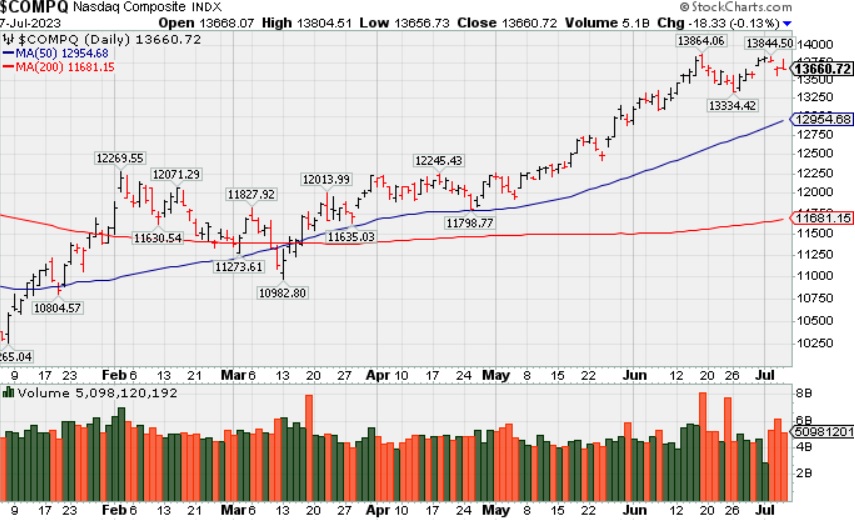
Major Indices Fell While Small Caps Posted Gains
Kenneth J. Gruneisen - Passed the CAN SLIM® Master's Exam
The major averages lost ground on Friday. The volume totals reported were mixed, higher on the NYSE and lower on the Nasdaq exchange versus the prior session. Breadth was positive as advancers led decliners by more than a 2-1 margin on the NYSE and by nearly 2-1 on the Nasdaq exchange. Leadership improved as there were 20 high-ranked companies from the Leaders List that hit a new 52-week high and were listed on the BreakOuts Page, versus the total of 7 on the prior session. New 52-week highs outnumbered new 52-week lows totals on the NYSE but new lows still outnumbered new highs on the Nasdaq exchange. The major indices are in a confirmed uptrend (M criteria). Appropriate new buying efforts may be considered under the fact-based investment system.
PICTURED: The Nasdaq Composite Index pulled back for a 3rd consecutive loss.
Microsoft (MSFT -1.2%) and Apple (AAPL -0.6%) were among the more influential laggards, contributing to the underperformance of the Dow Jones Industrial Average (-0.6%) and the information technology sector (-0.4%).
Small caps and value stocks exhibited relative strength throughout the session, reflecting the pro-growth mentality. The Russell 2000 rose 1.2% while the Russell Value Indices all outperformed their growth counterparts.
Nonfarm payrolls increased by 209,000 while nonfarm private payrolls rose by just 149,000. The ADP Report on Thursday estimated that 497,000 jobs were added to private sector payrolls in June, so the official employment report mitigated the strength of that reading. Overall, the employment report supported the soft landing narrative.
Concerning Treasuries, the 2-yr note yield fell seven basis points to 4.94% and the 10-yr note yield rose one basis point to 4.05%.
|
 Kenneth J. Gruneisen started out as a licensed stockbroker in August 1987, a couple of months prior to the historic stock market crash that took the Dow Jones Industrial Average down -22.6% in a single day. He has published daily fact-based fundamental and technical analysis on high-ranked stocks online for two decades. Through FACTBASEDINVESTING.COM, Kenneth provides educational articles, news, market commentary, and other information regarding proven investment systems that work in good times and bad.
Comments contained in the body of this report are technical opinions only and are not necessarily those of Gruneisen Growth Corp. The material herein has been obtained from sources believed to be reliable and accurate, however, its accuracy and completeness cannot be guaranteed. Our firm, employees, and customers may effect transactions, including transactions contrary to any recommendation herein, or have positions in the securities mentioned herein or options with respect thereto. Any recommendation contained in this report may not be suitable for all investors and it is not to be deemed an offer or solicitation on our part with respect to the purchase or sale of any securities. |
|
 |
Energy-Linked Groups Led Financial, Retail, and Networking Indexes
Kenneth J. Gruneisen - Passed the CAN SLIM® Master's Exam
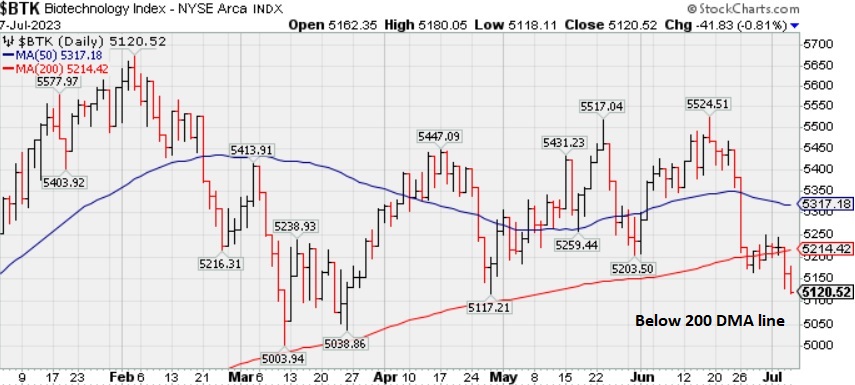
The Bank Index ($BKX +1.36%), Broker/Dealer Index ($XBD +1.43%), and the Retail Index ($RLX +0.57%) wash posted gains on Friday. The tech sector was mixed as the Semiconductor Index ($SOX 0.01%) was unchanged while the Networking Index ($NWX+1.35%) rose and the Biotech Index ($BTK -0.81%) lost ground. The Integrated Oil Index ($XOI +2.54%) and the Oil Services Index ($OSX +6.41%) posted standout gains and the Gold & Silver Index ($XAU +1.23%) also rose.
PICTURED: The Biotech Index ($BTK -0.81%) is testing near prior lows after slumping below its 200-day moving average (DMA) line.
| Oil Services |
$OSX |
83.79 |
+5.05 |
+6.41% |
-0.08% |
| Integrated Oil |
$XOI |
1,671.49 |
+41.46 |
+2.54% |
-6.48% |
| Semiconductor |
$SOX |
3,577.73 |
+0.24 |
+0.01% |
+41.29% |
| Networking |
$NWX |
855.76 |
+11.38 |
+1.35% |
+9.25% |
| Broker/Dealer |
$XBD |
472.43 |
+6.65 |
+1.43% |
+5.19% |
| Retail |
$RLX |
3,434.49 |
+19.41 |
+0.57% |
+24.71% |
| Gold & Silver |
$XAU |
117.11 |
+1.42 |
+1.23% |
-3.11% |
| Bank |
$BKX |
80.71 |
+1.08 |
+1.36% |
-19.97% |
| Biotech |
$BTK |
5,120.52 |
-41.83 |
-0.81% |
-3.04% |
|
|
|
 |
Featured Stocks
Kenneth J. Gruneisen - Passed the CAN SLIM® Master's Exam
|
|
|
Color Codes Explained :
Y - Better candidates highlighted by our
staff of experts.
G - Previously featured
in past reports as yellow but may no longer be buyable under the
guidelines.
***Last / Change / Volume data in this table is the closing quote data***
Symbol/Exchange
Company Name
Industry Group |
PRICE |
CHANGE
(%Change) |
Day High |
Volume
(% DAV)
(% 50 day avg vol) |
52 Wk Hi
% From Hi |
Featured
Date |
Price
Featured |
Pivot Featured |
|
Max Buy |
 STRL
-
NASDAQ
STRL
-
NASDAQ
Sterling Infrastructure
Bldg-Heavy Construction
|
$57.47
|
+1.01
1.79% |
$58.61
|
379,012
122.26% of 50 DAV
50 DAV is 310,000
|
$59.43
-3.30%
|
12/14/2022
|
$32.41
|
PP = $33.72
|
|
MB = $35.41
|
Most Recent Note - 7/6/2023 4:57:34 PM
G - Pulled back today following 6 consecutive gains for new all-time highs, very extended from any sound base. Mar '23 quarterly earnings were below the +25% minimum guideline (C criteria) raising fundamental concerns.
>>> FEATURED STOCK ARTICLE : Streak of Gains Lifts Sterling Infrastructure to New Highs - 7/3/2023 |
View all notes |
Set NEW NOTE alert |
Company Profile |
SEC
News |
Chart |
Request a new note
C
A
S
I |
FIX
-
NYSE
Comfort Systems USA
Bldg-A/C and Heating Prds
|
$159.84
|
+0.07
0.04% |
$162.10
|
199,922
72.96% of 50 DAV
50 DAV is 274,000
|
$167.53
-4.59%
|
4/27/2023
|
$148.85
|
PP = $152.23
|
|
MB = $159.84
|
 Most Recent Note - 7/7/2023 8:52:05 PM
G - Volume totals have been cooling while still hovering near its all-time high and near its "max buy" level. No resistance remains due to overhead supply. Its 50 DMA line ($154.51) defines important near-term support to watch.
>>> FEATURED STOCK ARTICLE : "Negative Reversal" Following Recent Volume-Driven Gains - 6/16/2023 |
View all notes |
Set NEW NOTE alert |
Company Profile |
SEC
News |
Chart |
Request a new note
C
A
S
I |
KOF
-
NYSE
Coca-Cola Femsa ADR
Beverages-Non-Alcoholic
|
$81.63
|
+0.10
0.12% |
$82.18
|
139,152
79.52% of 50 DAV
50 DAV is 175,000
|
$91.23
-10.52%
|
6/9/2023
|
$88.61
|
PP = $91.33
|
|
MB = $95.90
|
Most Recent Note - 7/6/2023 4:59:49 PM
G - Today's loss undercut the prior low ($81.63 on 5/31/23) raising greater concerns. A prompt rebound above the 50 DMA line ($86.31) is needed for its outlook to improve. Fundamentals remain strong.
>>> FEATURED STOCK ARTICLE : Slumping Below 50-Day Moving Average and Below Prior Low - 7/6/2023 |
View all notes |
Set NEW NOTE alert |
Company Profile |
SEC
News |
Chart |
Request a new note
C
A
S
I |
CLH
-
NYSE
Clean Harbors
Pollution Control
|
$167.68
|
+3.48
2.12% |
$168.87
|
490,781
124.25% of 50 DAV
50 DAV is 395,000
|
$165.88
1.09%
|
3/10/2023
|
$136.89
|
PP = $136.74
|
|
MB = $143.58
|
Most Recent Note - 7/7/2023 8:47:30 PM
G - Hit yet another new all-time high with today's gain backed by +22% above average volume, getting more extended from any sound base. Its 50 DMA line ($149.39) and prior high define important near-term support to watch on pullbacks. Fundamentals remain strong.
>>> FEATURED STOCK ARTICLE : Extended From Any Sound Base and Hovering Near High - 6/15/2023 |
View all notes |
Set NEW NOTE alert |
Company Profile |
SEC
News |
Chart |
Request a new note
C
A
S
I |
SPSC
-
NASDAQ
SPS Commerce
Comp Sftwr-Spec Enterprs
|
$182.27
|
-3.73
-2.01% |
$187.78
|
249,391
137.03% of 50 DAV
50 DAV is 182,000
|
$192.67
-5.40%
|
4/24/2023
|
$150.01
|
PP = $157.56
|
|
MB = $165.44
|
Most Recent Note - 7/7/2023 8:59:36 PM
G - Pulled back from its 52-week high with above average volume behind today's 2nd consecutive loss. Very extended from the previously noted base. Reported Mar '23 quarterly earnings +22% on +20% versus the year-ago period, below the +25% minimum earnings guideline (C criteria) raising some fundamental concerns.
>>> FEATURED STOCK ARTICLE : Perched Near High Following Noted Volume-Driven Gains - 6/21/2023 |
View all notes |
Set NEW NOTE alert |
Company Profile |
SEC
News |
Chart |
Request a new note
C
A
S
I |
Symbol/Exchange
Company Name
Industry Group |
PRICE |
CHANGE
(%Change) |
Day High |
Volume
(% DAV)
(% 50 day avg vol) |
52 Wk Hi
% From Hi |
Featured
Date |
Price
Featured |
Pivot Featured |
|
Max Buy |
HUBB
-
NYSE
Hubbell
Electrical-Power/Equipmt
|
$327.80
|
+1.43
0.44% |
$331.41
|
384,861
89.29% of 50 DAV
50 DAV is 431,000
|
$332.76
-1.49%
|
4/25/2023
|
$262.85
|
PP = $257.51
|
|
MB = $270.39
|
Most Recent Note - 7/7/2023 8:53:13 PM
G - Still hovering near its all-time high, very extended from the prior base. Its 50 DMA line ($295.48) defines initial support to watch on pullbacks. Fundamentals remain strong.
>>> FEATURED STOCK ARTICLE : Hubbell on Track for 11th Weekly Gain - 6/22/2023 |
View all notes |
Set NEW NOTE alert |
Company Profile |
SEC
News |
Chart |
Request a new note
C
A
S
I |
NVR
-
NYSE
NVR
Bldg-Resident/Comml
|
$6,062.78
|
-18.42
-0.30% |
$6,148.93
|
22,047
91.86% of 50 DAV
50 DAV is 24,000
|
$6,386.62
-5.07%
|
4/25/2023
|
$5,882.18
|
PP = $5,978.25
|
|
MB = $6,277.16
|
Most Recent Note - 7/6/2023 5:02:25 PM
G - Pulled back from its all-time high with today's 3rd consecutive loss. Its 50 DMA line ($5,886) defines near-term support watch on pullbacks.
>>> FEATURED STOCK ARTICLE : New High Close for Strong Homebuilder - 6/30/2023 |
View all notes |
Set NEW NOTE alert |
Company Profile |
SEC
News |
Chart |
Request a new note
C
A
S
I |
PHM
-
NYSE
PulteGroup
Bldg-Resident/Comml
|
$75.03
|
+0.02
0.03% |
$75.86
|
2,728,556
91.47% of 50 DAV
50 DAV is 2,983,000
|
$79.15
-5.21%
|
4/25/2023
|
$65.17
|
PP = $64.01
|
|
MB = $67.21
|
Most Recent Note - 7/6/2023 5:03:23 PM
G - Pulling back from its all-time high after getting very extended from any sound base. Reported earnings +28% for the Mar '23 quarter versus the year-ago period. Important support to watch is defined by its 50 DMA line ($70.51).
>>> FEATURED STOCK ARTICLE : Negative Reversal After Hitting Another New High - 6/26/2023 |
View all notes |
Set NEW NOTE alert |
Company Profile |
SEC
News |
Chart |
Request a new note
C
A
S
I |
COKE
-
NASDAQ
Coca-Cola Consolidated
Beverages-Non-Alcoholic
|
$633.29
|
-6.29
-0.98% |
$641.98
|
39,311
98.28% of 50 DAV
50 DAV is 40,000
|
$694.20
-8.77%
|
5/4/2023
|
$646.66
|
PP = $656.21
|
|
MB = $689.02
|
Most Recent Note - 7/3/2023 4:10:16 PM
Y - Consolidating near its 50 DMA line ($640). More damaging losses would raise concerns and trigger technical sell signals. Fundamentals remain strong.
>>> FEATURED STOCK ARTICLE : Fell Below Pivot Point With Recent Volume-Driven Losses - 6/14/2023 |
View all notes |
Set NEW NOTE alert |
Company Profile |
SEC
News |
Chart |
Request a new note
C
A
S
I |
AMPH
-
NASDAQ
Amphastar Pharm
Medical-Biomed/Biotech
|
$55.92
|
-1.26
-2.20% |
$57.70
|
401,346
87.06% of 50 DAV
50 DAV is 461,000
|
$58.80
-4.90%
|
5/15/2023
|
$43.56
|
PP = $44.15
|
|
MB = $46.36
|
Most Recent Note - 7/7/2023 8:49:19 PM
G - Volume totals have been cooling while hovering near its all-time high, extended from any sound base. Its 50 DMA line ($46.46) and prior highs in the $44 area define important support to watch on pullbacks. Fundamentals remain strong.
>>> FEATURED STOCK ARTICLE : Hit Another New High With 4th Consecutive Volume-Driven Gain - 6/20/2023 |
View all notes |
Set NEW NOTE alert |
Company Profile |
SEC
News |
Chart |
Request a new note
C
A
S
I |
Symbol/Exchange
Company Name
Industry Group |
PRICE |
CHANGE
(%Change) |
Day High |
Volume
(% DAV)
(% 50 day avg vol) |
52 Wk Hi
% From Hi |
Featured
Date |
Price
Featured |
Pivot Featured |
|
Max Buy |
ANET
-
NYSE
Arista Networks
Computer-Networking
|
$158.00
|
-0.90
-0.57% |
$160.69
|
1,785,064
48.79% of 50 DAV
50 DAV is 3,659,000
|
$178.36
-11.42%
|
5/30/2023
|
$176.35
|
PP = $171.54
|
|
MB = $180.12
|
Most Recent Note - 7/7/2023 8:45:45 PM
G - Volume totals have been cooling while consolidating above its 50 DMA line ($153). Faces near-term resistance due to overhead supply up to the $178 level. Fundamentals remain strong.
>>> FEATURED STOCK ARTICLE : Rebounding Near Recent High With 3 Consecutive Gains - 6/12/2023 |
View all notes |
Set NEW NOTE alert |
Company Profile |
SEC
News |
Chart |
Request a new note
C
A
S
I |
PANW
-
NASDAQ
Palo Alto Networks
Computer Sftwr-Security
|
$247.59
|
-5.81
-2.29% |
$253.08
|
3,690,505
59.50% of 50 DAV
50 DAV is 6,203,000
|
$258.88
-4.36%
|
6/5/2023
|
$228.35
|
PP = $213.73
|
|
MB = $224.42
|
Most Recent Note - 7/7/2023 8:57:55 PM
G - Pulled back from its all-time high with today's 2nd consecutive loss on light volume. Its 50 DMA line ($216) and prior high ($213) defines near-term support to watch. Fundamentals remain strong.
>>> FEATURED STOCK ARTICLE : Strength Continues for Network Security Leader - 6/27/2023 |
View all notes |
Set NEW NOTE alert |
Company Profile |
SEC
News |
Chart |
Request a new note
C
A
S
I |
LSCC
-
NASDAQ
Lattice Semiconductor
Elec-Semicondctor Fablss
|
$91.65
|
-0.11
-0.12% |
$93.85
|
948,501
37.27% of 50 DAV
50 DAV is 2,545,000
|
$97.27
-5.78%
|
6/13/2023
|
$91.73
|
PP = $96.92
|
|
MB = $101.77
|
Most Recent Note - 7/7/2023 8:55:41 PM
Y - Pulled back for a 4th consecutive loss today backed by below-average volume after wedging to touch a new all-time high. Its 50 DMA line ($84.85) defines near-term support to watch. Subsequent gains above the pivot point backed by at least +40% above average volume may trigger a technical buy signal. Fundamentals remain strong.
>>> FEATURED STOCK ARTICLE : Lattice Posts Volume-Driven Gains Approaching Prior High - 6/13/2023 |
View all notes |
Set NEW NOTE alert |
Company Profile |
SEC
News |
Chart |
Request a new note
C
A
S
I |
XPEL
-
NASDAQ
XPEL
Auto/Truck-Replace Parts
|
$84.35
|
+0.68
0.81% |
$85.04
|
227,022
175.99% of 50 DAV
50 DAV is 129,000
|
$87.01
-3.06%
|
6/28/2023
|
$83.14
|
PP = $87.11
|
|
MB = $91.47
|
Most Recent Note - 7/7/2023 12:39:07 PM
Y - Color code was changed to yellow with pivot point cited based on its 8/15/23 high plus 10 cents when featured in the 6/28/23 mid-day report. Perched within striking distance of its 52-week high after an orderly 10-month base. Reported Mar '23 quarterly earnings +46% on +19% sales revenues versus the year ago period, its 3rd quarterly comparison above the +25% minimum earnings guideline (C criteria), helping it better match the winning models of the fact-based investment system. Annual earnings growth remained strong while it went through a deep consolidation since dropped from the Featured Stocks list on 8/13/21. See the latest FSU analysis for more details and a new annotated graph.
>>> FEATURED STOCK ARTICLE : XPEL Returns to Featured Stocks List After Long Consolidation - 6/28/2023 |
View all notes |
Set NEW NOTE alert |
Company Profile |
SEC
News |
Chart |
Request a new note
C
A
S
I |
|
|
|
THESE ARE NOT BUY RECOMMENDATIONS!
Comments contained in the body of this report are technical
opinions only. The material herein has been obtained
from sources believed to be reliable and accurate, however,
its accuracy and completeness cannot be guaranteed.
This site is not an investment advisor, hence it does
not endorse or recommend any securities or other investments.
Any recommendation contained in this report may not
be suitable for all investors and it is not to be deemed
an offer or solicitation on our part with respect to
the purchase or sale of any securities. All trademarks,
service marks and trade names appearing in this report
are the property of their respective owners, and are
likewise used for identification purposes only.
This report is a service available
only to active Paid Premium Members.
You may opt-out of receiving report notifications
at any time. Questions or comments may be submitted
by writing to Premium Membership Services 665 S.E. 10 Street, Suite 201 Deerfield Beach, FL 33441-5634 or by calling 1-800-965-8307
or 954-785-1121.
|
|
|