You are not logged in.
This means you
CAN ONLY VIEW reports that were published prior to Thursday, March 13, 2025.
You
MUST UPGRADE YOUR MEMBERSHIP if you want to see any current reports.
AFTER MARKET UPDATE - WEDNESDAY, JUNE 28TH, 2023
Previous After Market Report Next After Market Report >>>
|
|
|
|
DOW |
-74.08 |
33,852.66 |
-0.22% |
|
Volume |
838,754,328 |
+3% |
|
Volume |
4,563,653,300 |
-10% |
|
NASDAQ |
+36.08 |
13,591.75 |
+0.27% |
|
Advancers |
1,601 |
56% |
|
Advancers |
2,263 |
52% |
|
S&P 500 |
-1.55 |
4,376.86 |
-0.04% |
|
Decliners |
1,277 |
44% |
|
Decliners |
2,111 |
48% |
|
Russell 2000 |
+8.78 |
1,858.71 |
+0.47% |
|
52 Wk Highs |
106 |
|
|
52 Wk Highs |
83 |
|
|
S&P 600 |
+1.36 |
1,195.28 |
+0.11% |
|
52 Wk Lows |
32 |
|
|
52 Wk Lows |
127 |
|
|
 |
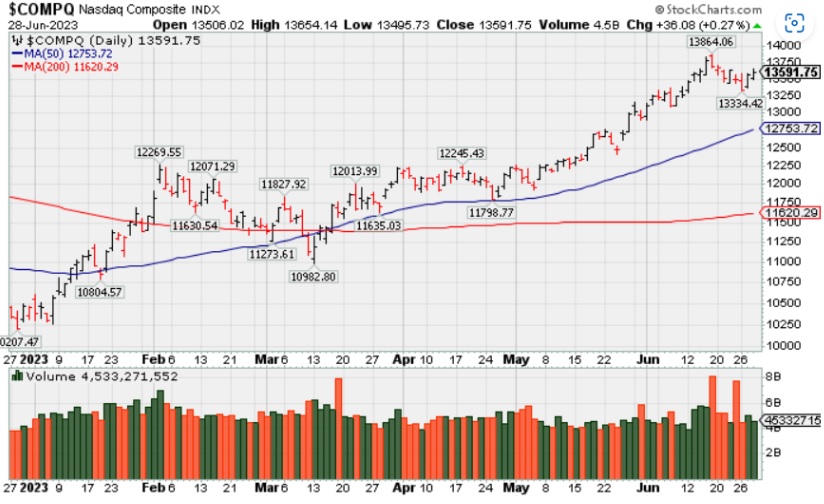
Major Indices Ended Mixed and Were Indecisive
Kenneth J. Gruneisen - Passed the CAN SLIM® Master's Exam
US equities had a mixed showing and the major indices ultimately settled the session near their flat lines, registering only modest gains or declines. The Russell 2000 was a relative outperformer, gaining 0.5%. Volume totals reported were mixed, higher on the NYSE and lighter on the Nasdaq exchange versus the prior session. Advancers led decliners by almost a 4-3 margin on the NYSE and by a narrower margin on the Nasdaq exchange. There were 72 high-ranked companies from the Leaders List that hit a new 52-week high and were listed on the BreakOuts Page, versus the total of 66 on the prior session. New 52-week highs outnumbered new 52-week lows on the NYSE, but new lows outnumbered new highs on the Nasdaq exchange. The major indices are in a confirmed uptrend (M criteria). Appropriate new buying efforts may be considered under the fact-based investment system.
PICTURED: The Nasdaq Composite Index is consolidating following a "negative reversal" on 6/16/23 after hitting a new 2023 high.
Fed Chair Powell caused little reaction from the market with his latest commentary. Semiconductor stocks were a notable pocket of weakness, but Apple (AAPL +0.6%) reached a new 52-week high and nearly reached a $3 trillion valuation today. Microsoft (MSFT +0.4%) also offered some support to the sector.
Treasuries settled with gains across the curve. The 2-yr note yield fell four basis points to 4.72% and the 10-yr note yield fell six basis points to 3.71%, aided by strong demand seen at the 7-yr note auction. |
 Kenneth J. Gruneisen started out as a licensed stockbroker in August 1987, a couple of months prior to the historic stock market crash that took the Dow Jones Industrial Average down -22.6% in a single day. He has published daily fact-based fundamental and technical analysis on high-ranked stocks online for two decades. Through FACTBASEDINVESTING.COM, Kenneth provides educational articles, news, market commentary, and other information regarding proven investment systems that work in good times and bad.
Comments contained in the body of this report are technical opinions only and are not necessarily those of Gruneisen Growth Corp. The material herein has been obtained from sources believed to be reliable and accurate, however, its accuracy and completeness cannot be guaranteed. Our firm, employees, and customers may effect transactions, including transactions contrary to any recommendation herein, or have positions in the securities mentioned herein or options with respect thereto. Any recommendation contained in this report may not be suitable for all investors and it is not to be deemed an offer or solicitation on our part with respect to the purchase or sale of any securities. |
|
 |
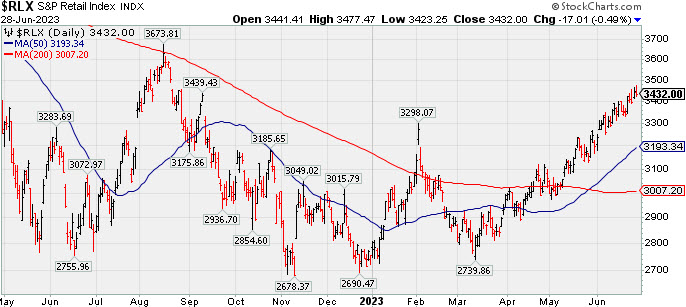
Networking, Biotech, and Integrated Oil Indexes Rose
Kenneth J. Gruneisen - Passed the CAN SLIM® Master's Exam
The Bank Index ($BKX -0.41%) edged lower while the Broker/Dealer Index ($XBD +0.03%) finished flat. The tech sector was mixed as the Semiconductor Index ($SOX -0.90%) pulled back while the Networking Index ($NWX +0.91%) and the Biotech Index ($BTK +0.59) both posted gains. The Gold & Silver Index ($XAU -1.48%) slumped as the Oil Services Index ($OSX -0.07%) finished flat and the Integrated Oil Index ($XOI +0.78%) posted a small gain.
PICTURED: The Retail Index ($RLX -0.49%) pulled back after hitting a new 2023 high.
| Oil Services |
$OSX |
76.47 |
-0.05 |
-0.07% |
-8.82% |
| Integrated Oil |
$XOI |
1,649.59 |
+12.77 |
+0.78% |
-7.70% |
| Semiconductor |
$SOX |
3,609.48 |
-32.93 |
-0.90% |
+42.55% |
| Networking |
$NWX |
828.64 |
+7.50 |
+0.91% |
+5.79% |
| Broker/Dealer |
$XBD |
464.79 |
+0.14 |
+0.03% |
+3.49% |
| Retail |
$RLX |
3,432.00 |
-17.01 |
-0.49% |
+24.62% |
| Gold & Silver |
$XAU |
116.62 |
-1.75 |
-1.48% |
-3.51% |
| Bank |
$BKX |
78.60 |
-0.33 |
-0.41% |
-22.06% |
| Biotech |
$BTK |
5,211.98 |
+30.50 |
+0.59% |
-1.31% |
|
|
|
 |
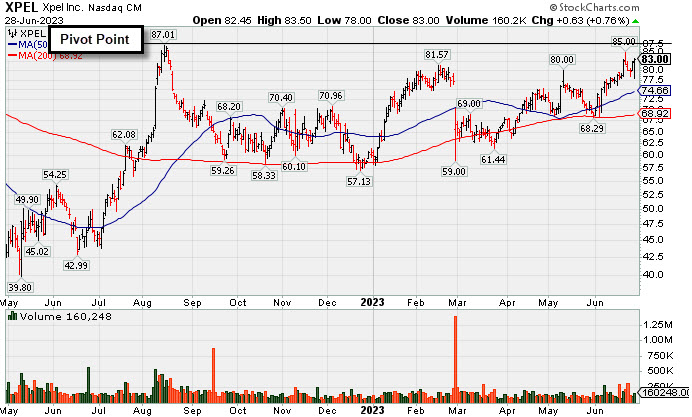
XPEL Returns to Featured Stocks List After Long Consolidation
Kenneth J. Gruneisen - Passed the CAN SLIM® Master's Exam
Xpel Inc (XPEL +$0.63 or +0.76% to $83.00) was highlighted in yellow with pivot point cited based on its 8/15/23 high plus 10 cents in the earlier mid-day report (read here). It is perched within striking distance of its 52-week high after an orderly 10-month base. Reported Mar '23 quarterly earnings +46% on +19% sales revenues versus the year ago period, its 3rd quarterly comparison above the +25% minimum earnings guideline (C criteria), helping it better match the winning models of the fact-based investment system.
This Auto/Truck - Replacement Parts firm has a 99 Earnings Per Share Rating. It went through a long consolidation since shown in this FSU section on 7/21/21 under the headline, "New Base Formed May Be 'Late Stage'". Annual earnings growth remained strong while it went through a deep consolidation since dropped from the Featured Stocks list on 8/13/21.
The number of top-rated funds owning its shares rose from 45 in Mar '20 to 335 in Mar '23, a reassuring sign concerning the I criteria. Its current Up/Down Volume Ratio of 1.1 is an unbiased indication its shares have been under slight accumulation over the past 50 days. Its small supply of only 27.6 million shares outstanding (S criteria) can contribute to greater volatility in the event of institutional buying or selling.
|
|
|
Color Codes Explained :
Y - Better candidates highlighted by our
staff of experts.
G - Previously featured
in past reports as yellow but may no longer be buyable under the
guidelines.
***Last / Change / Volume data in this table is the closing quote data***
Symbol/Exchange
Company Name
Industry Group |
PRICE |
CHANGE
(%Change) |
Day High |
Volume
(% DAV)
(% 50 day avg vol) |
52 Wk Hi
% From Hi |
Featured
Date |
Price
Featured |
Pivot Featured |
|
Max Buy |
 GPK
-
NYSE
GPK
-
NYSE
Graphic Packaging Hldg
CONSUMER NON-DURABLES - Packaging and Containers
|
$24.02
|
-0.20
-0.83% |
$24.22
|
4,435,789
100.89% of 50 DAV
50 DAV is 4,396,700
|
$27.56
-12.84%
|
10/25/2022
|
$22.75
|
PP = $24.17
|
|
MB = $25.38
|
 Most Recent Note - 6/28/2023 5:08:01 PM
G - Holding its ground after undercutting the prior low (23.75) and still staying above its 200 DMA line ($23.35). Violation of its 50 DMA line raised concerns following a noted "negative reversal" on 6/13/23. A rebound above the 50 DMA line ($25.17) is needed to help its outlook improve. Its Relative Strength Rating has slumped to 66, below the 80+ minimum guideline for buy candidates.
>>> FEATURED STOCK ARTICLE : Graphic Packaging Hits New High With 6th Consecutive Gain - 6/8/2023 |
View all notes |
Set NEW NOTE alert |
Company Profile |
SEC
News |
Chart |
Request a new note
C
A
S
I |
STRL
-
NASDAQ
Sterling Infrastructure
Bldg-Heavy Construction
|
$53.80
|
+0.88
1.66% |
$54.80
|
298,541
105.87% of 50 DAV
50 DAV is 282,000
|
$54.44
-1.18%
|
12/14/2022
|
$32.41
|
PP = $33.72
|
|
MB = $35.41
|
Most Recent Note - 6/28/2023 5:11:39 PM
G - Posted a gain today with average volume wedging to a new all-time high, extended from any sound base. Mar '23 quarterly earnings were below the +25% minimum guideline (C criteria) raising fundamental concerns.
>>> FEATURED STOCK ARTICLE : Impressive Streak of Gains for New Highs - 6/7/2023 |
View all notes |
Set NEW NOTE alert |
Company Profile |
SEC
News |
Chart |
Request a new note
C
A
S
I |
FIX
-
NYSE
Comfort Systems USA
Bldg-A/C and Heating Prds
|
$160.93
|
-1.07
-0.66% |
$163.16
|
146,907
52.84% of 50 DAV
50 DAV is 278,000
|
$165.05
-2.50%
|
4/27/2023
|
$148.85
|
PP = $152.23
|
|
MB = $159.84
|
Most Recent Note - 6/27/2023 5:37:17 PM
G - Volume totals have been cooling while hovering near its all-time high. Extended from the prior base and no resistance remains due to overhead supply. Prior highs in the $152-156 area define initial support to watch above its 50 DMA line ($150.54).
>>> FEATURED STOCK ARTICLE : "Negative Reversal" Following Recent Volume-Driven Gains - 6/16/2023 |
View all notes |
Set NEW NOTE alert |
Company Profile |
SEC
News |
Chart |
Request a new note
C
A
S
I |
KOF
-
NYSE
Coca-Cola Femsa ADR
Beverages-Non-Alcoholic
|
$83.95
|
-0.56
-0.66% |
$84.71
|
169,230
95.07% of 50 DAV
50 DAV is 178,000
|
$91.23
-7.98%
|
6/9/2023
|
$88.61
|
PP = $91.33
|
|
MB = $95.90
|
Most Recent Note - 6/27/2023 12:30:58 PM
G - Further undercutting its 50 DMA line ($86.36) with today's 4th consecutive loss raising greater concerns. A prompt rebound above the 50 DMA line is needed to help its outlook improve. The prior low ($81.63 on 5/31/23) defines the next important near-term support to watch. Subsequent gains above the pivot point backed by at least +40% above average volume may trigger a technical buy signal. Fundamentals remain strong.
>>> FEATURED STOCK ARTICLE : Coca-Cola Femsa Posts 7th Consecutive Gain - 6/9/2023 |
View all notes |
Set NEW NOTE alert |
Company Profile |
SEC
News |
Chart |
Request a new note
C
A
S
I |
CLH
-
NYSE
Clean Harbors
Pollution Control
|
$160.02
|
+1.85
1.17% |
$160.20
|
383,719
98.14% of 50 DAV
50 DAV is 391,000
|
$160.50
-0.30%
|
3/10/2023
|
$136.89
|
PP = $136.74
|
|
MB = $143.58
|
Most Recent Note - 6/27/2023 5:36:07 PM
G - Volume totals have cooled while hovering near its all-time high, extended from any sound base. Its 50 DMA line ($146.56) and prior high define important near-term support to watch on pullbacks. Fundamentals remain strong.
>>> FEATURED STOCK ARTICLE : Extended From Any Sound Base and Hovering Near High - 6/15/2023 |
View all notes |
Set NEW NOTE alert |
Company Profile |
SEC
News |
Chart |
Request a new note
C
A
S
I |
Symbol/Exchange
Company Name
Industry Group |
PRICE |
CHANGE
(%Change) |
Day High |
Volume
(% DAV)
(% 50 day avg vol) |
52 Wk Hi
% From Hi |
Featured
Date |
Price
Featured |
Pivot Featured |
|
Max Buy |
SPSC
-
NASDAQ
SPS Commerce
Comp Sftwr-Spec Enterprs
|
$188.50
|
+4.65
2.53% |
$189.20
|
257,151
146.11% of 50 DAV
50 DAV is 176,000
|
$186.39
1.13%
|
4/24/2023
|
$150.01
|
PP = $157.56
|
|
MB = $165.44
|
Most Recent Note - 6/28/2023 5:13:52 PM
G - Volume was +46% above average behind today's gain while hitting another new 52-week high, getting very extended from the previously noted base. Reported Mar '23 quarterly earnings +22% on +20% versus the year-ago period, below the +25% minimum earnings guideline (C criteria) raising some fundamental concerns.
>>> FEATURED STOCK ARTICLE : Perched Near High Following Noted Volume-Driven Gains - 6/21/2023 |
View all notes |
Set NEW NOTE alert |
Company Profile |
SEC
News |
Chart |
Request a new note
C
A
S
I |
HUBB
-
NYSE
Hubbell
Electrical-Power/Equipmt
|
$321.82
|
-1.50
-0.46% |
$325.76
|
697,247
165.22% of 50 DAV
50 DAV is 422,000
|
$326.62
-1.47%
|
4/25/2023
|
$262.85
|
PP = $257.51
|
|
MB = $270.39
|
Most Recent Note - 6/28/2023 5:10:08 PM
G - Churning above-average volume while recently hovering near its all-time high, very extended from the prior base. Its 50 DMA line ($284) defines initial support to watch on pullbacks. Fundamentals remain strong.
>>> FEATURED STOCK ARTICLE : Hubbell on Track for 11th Weekly Gain - 6/22/2023 |
View all notes |
Set NEW NOTE alert |
Company Profile |
SEC
News |
Chart |
Request a new note
C
A
S
I |
NVR
-
NYSE
NVR
Bldg-Resident/Comml
|
$6,312.91
|
-17.29
-0.27% |
$6,386.62
|
22,008
84.65% of 50 DAV
50 DAV is 26,000
|
$6,357.53
-0.70%
|
4/25/2023
|
$5,882.18
|
PP = $5,978.25
|
|
MB = $6,277.16
|
Most Recent Note - 6/26/2023 6:32:01 PM
G - There was a "negative reversal" today after hitting another new all-time high. Its 50 DMA line ($5,824) defines near-term support watch on pullbacks. Reported Mar '23 quarterly earnings -14% on -3% sales revenues versus the year-ago period, below the +25% minimum earnings guideline (C criteria) raising fundamental concerns, and its color code was changed to green.
>>> FEATURED STOCK ARTICLE : Rebounded Above 50 Day Average With Light Volume Gains - 6/6/2023 |
View all notes |
Set NEW NOTE alert |
Company Profile |
SEC
News |
Chart |
Request a new note
C
A
S
I |
PHM
-
NYSE
PulteGroup
Bldg-Resident/Comml
|
$77.72
|
-0.95
-1.21% |
$79.15
|
3,099,515
101.69% of 50 DAV
50 DAV is 3,048,000
|
$78.80
-1.37%
|
4/25/2023
|
$65.17
|
PP = $64.01
|
|
MB = $67.21
|
Most Recent Note - 6/26/2023 6:27:37 PM
G - There was a "negative reversal" today after hitting yet another new high . Very extended from any sound base. Reported earnings +28% for the Mar '23 quarter versus the year-ago period. Important support to watch is defined by its 50 DMA line ($68.40). See the latest FSU analysis for more details and a new annotated graph.
>>> FEATURED STOCK ARTICLE : Negative Reversal After Hitting Another New High - 6/26/2023 |
View all notes |
Set NEW NOTE alert |
Company Profile |
SEC
News |
Chart |
Request a new note
C
A
S
I |
COKE
-
NASDAQ
Coca-Cola Consolidated
Beverages-Non-Alcoholic
|
$646.33
|
+1.56
0.24% |
$648.10
|
29,072
72.68% of 50 DAV
50 DAV is 40,000
|
$694.20
-6.90%
|
5/4/2023
|
$646.66
|
PP = $656.21
|
|
MB = $689.02
|
Most Recent Note - 6/26/2023 6:35:42 PM
Y - Pulled back today with average volume. Important near-term support is its 50 DMA line ($630). Fundamentals remain strong.
>>> FEATURED STOCK ARTICLE : Fell Below Pivot Point With Recent Volume-Driven Losses - 6/14/2023 |
View all notes |
Set NEW NOTE alert |
Company Profile |
SEC
News |
Chart |
Request a new note
C
A
S
I |
Symbol/Exchange
Company Name
Industry Group |
PRICE |
CHANGE
(%Change) |
Day High |
Volume
(% DAV)
(% 50 day avg vol) |
52 Wk Hi
% From Hi |
Featured
Date |
Price
Featured |
Pivot Featured |
|
Max Buy |
AMPH
-
NASDAQ
Amphastar Pharm
Medical-Biomed/Biotech
|
$55.62
|
-0.52
-0.93% |
$56.83
|
418,936
90.09% of 50 DAV
50 DAV is 465,000
|
$58.70
-5.25%
|
5/15/2023
|
$43.56
|
PP = $44.15
|
|
MB = $46.36
|
Most Recent Note - 6/26/2023 6:34:06 PM
G - Pulled back from its all-time high with today's 2nd consecutive volume-driven loss. Very extended from any sound base. Prior highs in the $44 area define important support to watch coinciding with its 50 DMA line. Fundamentals remain strong.
>>> FEATURED STOCK ARTICLE : Hit Another New High With 4th Consecutive Volume-Driven Gain - 6/20/2023 |
View all notes |
Set NEW NOTE alert |
Company Profile |
SEC
News |
Chart |
Request a new note
C
A
S
I |
ANET
-
NYSE
Arista Networks
Computer-Networking
|
$155.86
|
-0.27
-0.17% |
$158.05
|
2,340,111
63.80% of 50 DAV
50 DAV is 3,668,000
|
$178.36
-12.61%
|
5/30/2023
|
$176.35
|
PP = $171.54
|
|
MB = $180.12
|
Most Recent Note - 6/27/2023 5:32:56 PM
G - Rebounded above its 50 DMA line ($152.81) with below-average volume behind today's 2nd consecutive gain helping its outlook improve. Faces near-term resistance due to overhead supply up to the $178 level. Fundamentals remain strong.
>>> FEATURED STOCK ARTICLE : Rebounding Near Recent High With 3 Consecutive Gains - 6/12/2023 |
View all notes |
Set NEW NOTE alert |
Company Profile |
SEC
News |
Chart |
Request a new note
C
A
S
I |
PANW
-
NASDAQ
Palo Alto Networks
Computer Sftwr-Security
|
$253.41
|
+1.82
0.72% |
$255.42
|
3,918,325
64.31% of 50 DAV
50 DAV is 6,093,000
|
$253.51
-0.04%
|
6/5/2023
|
$228.35
|
PP = $213.73
|
|
MB = $224.42
|
Most Recent Note - 6/27/2023 5:29:16 PM
G - Hit another new all-time high with today's gain. Very extended from the prior high ($213) which defines initial support to watch on pullbacks. Fundamentals remain strong. See the latest FSU analysis for more details and a new annotated graph.
>>> FEATURED STOCK ARTICLE : Strength Continues for Network Security Leader - 6/27/2023 |
View all notes |
Set NEW NOTE alert |
Company Profile |
SEC
News |
Chart |
Request a new note
C
A
S
I |
LSCC
-
NASDAQ
Lattice Semiconductor
Elec-Semicondctor Fablss
|
$91.68
|
+0.69
0.76% |
$92.39
|
1,722,008
68.94% of 50 DAV
50 DAV is 2,498,000
|
$96.82
-5.31%
|
6/13/2023
|
$91.73
|
PP = $96.92
|
|
MB = $101.77
|
Most Recent Note - 6/27/2023 5:43:34 PM
Y - Posted a solid gain today backed by light volume after recently testing its 50 DMA line ($84.54). More damaging losses would raise concerns. Subsequent gains above the pivot point backed by at least +40% above average volume may trigger a technical buy signal. Reported Mar '23 quarterly earnings +38% on +22% sales revenues versus the year-ago period, its 9th consecutive strong quarterly comparison above the +25% minimum earnings guideline (C criteria). Annual earnings history (A criteria) has been strong.
>>> FEATURED STOCK ARTICLE : Lattice Posts Volume-Driven Gains Approaching Prior High - 6/13/2023 |
View all notes |
Set NEW NOTE alert |
Company Profile |
SEC
News |
Chart |
Request a new note
C
A
S
I |
XPEL
-
NASDAQ
XPEL
Auto/Truck-Replace Parts
|
$83.00
|
+0.63
0.76% |
$83.50
|
160,358
121.48% of 50 DAV
50 DAV is 132,000
|
$87.01
-4.61%
|
6/28/2023
|
$83.14
|
PP = $87.11
|
|
MB = $91.47
|
Most Recent Note - 6/28/2023 5:04:54 PM
Y - Color code was changed to yellow with pivot point cited based on its 8/15/23 high plus 10 cents when featured in the earlier mid-day report. Perched within striking distance of its 52-week high after an orderly 10-month base. Reported Mar '23 quarterly earnings +46% on +19% sales revenues versus the year ago period, its 3rd quarterly comparison above the +25% minimum earnings guideline (C criteria), helping it better match the winning models of the fact-based investment system. Annual earnings growth remained strong while it went through a deep consolidation since dropped from the Featured Stocks list on 8/13/21. See the latest FSU analysis for more details and a new annotated graph.
>>> FEATURED STOCK ARTICLE : XPEL Returns to Featured Stocks List After Long Consolidation - 6/28/2023 |
View all notes |
Set NEW NOTE alert |
Company Profile |
SEC
News |
Chart |
Request a new note
C
A
S
I |
Symbol/Exchange
Company Name
Industry Group |
PRICE |
CHANGE
(%Change) |
Day High |
Volume
(% DAV)
(% 50 day avg vol) |
52 Wk Hi
% From Hi |
Featured
Date |
Price
Featured |
Pivot Featured |
|
Max Buy |
|
|
|
THESE ARE NOT BUY RECOMMENDATIONS!
Comments contained in the body of this report are technical
opinions only. The material herein has been obtained
from sources believed to be reliable and accurate, however,
its accuracy and completeness cannot be guaranteed.
This site is not an investment advisor, hence it does
not endorse or recommend any securities or other investments.
Any recommendation contained in this report may not
be suitable for all investors and it is not to be deemed
an offer or solicitation on our part with respect to
the purchase or sale of any securities. All trademarks,
service marks and trade names appearing in this report
are the property of their respective owners, and are
likewise used for identification purposes only.
This report is a service available
only to active Paid Premium Members.
You may opt-out of receiving report notifications
at any time. Questions or comments may be submitted
by writing to Premium Membership Services 665 S.E. 10 Street, Suite 201 Deerfield Beach, FL 33441-5634 or by calling 1-800-965-8307
or 954-785-1121.
|
|
|