You are not logged in.
This means you
CAN ONLY VIEW reports that were published prior to Tuesday, April 15, 2025.
You
MUST UPGRADE YOUR MEMBERSHIP if you want to see any current reports.
AFTER MARKET UPDATE - THURSDAY, MAY 11TH, 2023
Previous After Market Report Next After Market Report >>>
|
|
|
|
DOW |
-221.82 |
33,309.51 |
-0.66% |
|
Volume |
844,655,829 |
-7% |
|
Volume |
4,557,004,700 |
-9% |
|
NASDAQ |
+22.06 |
12,328.51 |
+0.18% |
|
Advancers |
900 |
31% |
|
Advancers |
1,569 |
36% |
|
S&P 500 |
-7.02 |
4,130.62 |
-0.17% |
|
Decliners |
1,977 |
69% |
|
Decliners |
2,827 |
64% |
|
Russell 2000 |
-14.81 |
1,744.71 |
-0.84% |
|
52 Wk Highs |
32 |
|
|
52 Wk Highs |
83 |
|
|
S&P 600 |
-7.85 |
1,122.72 |
-0.69% |
|
52 Wk Lows |
82 |
|
|
52 Wk Lows |
217 |
|
|
 |
Nasdaq Composite Rose Despite the Session's Negative Bias
Kenneth J. Gruneisen - Passed the CAN SLIM® Master's Exam
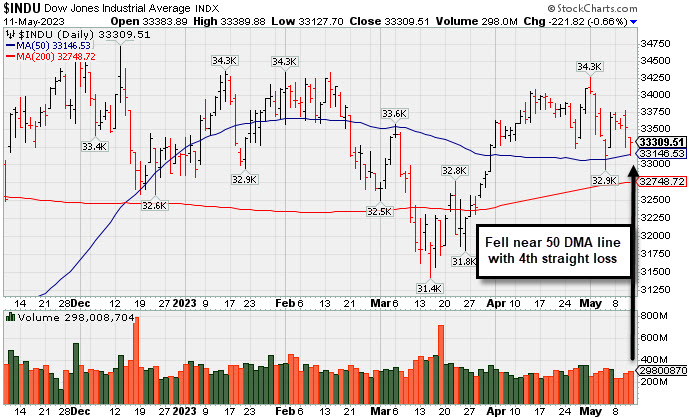
The Dow shed 221 points (0.7%), and the S&P 500 fell 0.2%, while the Nasdaq Composite climbed 0.2%. Volume totals reported were lighter on the NYSE and on the Nasdaq exchange, indicative of less institutional selling pressure. Decliners led advancers by almost a 2-1 margin on the NYSE and on the Nasdaq exchange. Leadership thinned as there were 19 high-ranked companies from the Leaders List that hit a new 52-week high and were listed on the BreakOuts Page, versus the total of 40 on the prior session. New 52-week lows totals expanded and outnumbered shrinking new 52-week highs totals on the NYSE and on the Nasdaq exchange. The major indices are in an uptrend under pressure (M criteria). Appropriate new buying efforts may be considered under the fact-based investment system.
PICTURED: The Dow Jones Industrial Average is testing support at its 50-day moving average (DMA) line after sputtering shy of its 2023 high.
Eight of 11 sectors ended in negative territory as U.S. equities finished mixed Thursday. Concerns over an impending recession and heightened bank jitters weighed on sentiment. Regional bank shares tumbled as worries over stability in the Financials sector weighed on sentiment. Investors also digested April’s wholesale inflation data. The headline Producer Price Index (PPI) accelerated on a monthly basis, coming in at 0.2% month-over-month versus March’s revised -0.4% print. On an annual basis, headline PPI eased to 2.3% year-over-year. Core PPI (which excludes food and energy prices) came in at 0.2% month-over-month and 3.2% year-over-year.
Elsewhere on the data front, initial jobless claims for the week ended May 6 came in at 264,000, notching their highest level since October 2021. The report, coupled with this week’s inflation data, suggests the Federal Reserve’s (Fed) interest rate hikes may be having a marked impact. Treasuries strengthened, with the yield on the benchmark 10-year note down six basis points (0.06%) to 3.38%, while the 30-year bond yield fell six basis points (0.06%) to 3.73%. The yield on the two-year note, which is more sensitive to changes in Fed policy, dipped two basis points (0.02%) to 3.89%. In commodities, West Texas Intermediate (WTI) crude fell 1.5% to $71.45/barrel amid heightened concerns over the economic outlook.
|
 Kenneth J. Gruneisen started out as a licensed stockbroker in August 1987, a couple of months prior to the historic stock market crash that took the Dow Jones Industrial Average down -22.6% in a single day. He has published daily fact-based fundamental and technical analysis on high-ranked stocks online for two decades. Through FACTBASEDINVESTING.COM, Kenneth provides educational articles, news, market commentary, and other information regarding proven investment systems that work in good times and bad.
Comments contained in the body of this report are technical opinions only and are not necessarily those of Gruneisen Growth Corp. The material herein has been obtained from sources believed to be reliable and accurate, however, its accuracy and completeness cannot be guaranteed. Our firm, employees, and customers may effect transactions, including transactions contrary to any recommendation herein, or have positions in the securities mentioned herein or options with respect thereto. Any recommendation contained in this report may not be suitable for all investors and it is not to be deemed an offer or solicitation on our part with respect to the purchase or sale of any securities. |
|
 |
Commodity-Linked Groups Led Decliners
Kenneth J. Gruneisen - Passed the CAN SLIM® Master's Exam
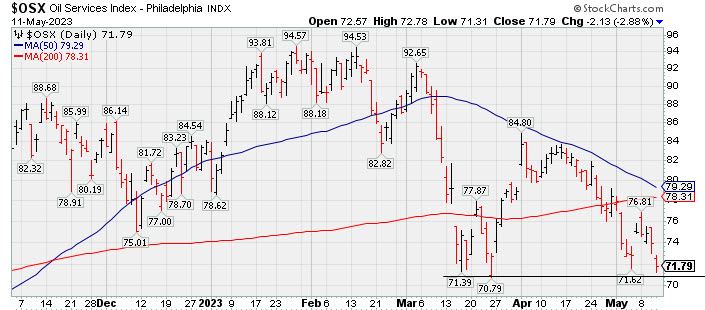
Commodity-linked groups clearly had a negative bias as the Gold & Silver Index ($XAU -3.92%) outpaced the Oil Services Index ($OSX -2.88%) and Integrated Oil Index ($XOI -1.18%) to the downside. The Retail Index ($RLX +0.85%) was a positive influence while the Bank Index ($BKX -1.26%) createrd a drag on the major averages and the Broker/Dealer Index ($XBD -0.23%) also edged lower. The Networking Index ($NWX -1.04%) and Semiconductor Index ($SOX -0.63%) led the tech sector's retreat while the Biotech Index ($BTK -0.17%) also edged lower.
PICTURED: The Oil Services Index ($OSX -2.88%) is sputtering near its 2023 low. Its 50-day and 200-day moving average (DMA) lines have nearly converged in a bearish "death cross".
| Oil Services |
$OSX |
71.79 |
-2.13 |
-2.88% |
-14.39% |
| Integrated Oil |
$XOI |
1,627.03 |
-19.37 |
-1.18% |
-8.96% |
| Semiconductor |
$SOX |
2,978.72 |
-18.79 |
-0.63% |
+17.64% |
| Networking |
$NWX |
724.97 |
-7.63 |
-1.04% |
-7.45% |
| Broker/Dealer |
$XBD |
431.60 |
-0.98 |
-0.23% |
-3.90% |
| Retail |
$RLX |
3,130.35 |
+26.41 |
+0.85% |
+13.67% |
| Gold & Silver |
$XAU |
133.46 |
-5.45 |
-3.92% |
+10.42% |
| Bank |
$BKX |
73.23 |
-0.93 |
-1.26% |
-27.39% |
| Biotech |
$BTK |
5,314.02 |
-9.03 |
-0.17% |
+0.62% |
|
|
|
 |
Featured Stocks
Kenneth J. Gruneisen - Passed the CAN SLIM® Master's Exam
|
|
|
Color Codes Explained :
Y - Better candidates highlighted by our
staff of experts.
G - Previously featured
in past reports as yellow but may no longer be buyable under the
guidelines.
***Last / Change / Volume data in this table is the closing quote data***
Symbol/Exchange
Company Name
Industry Group |
PRICE |
CHANGE
(%Change) |
Day High |
Volume
(% DAV)
(% 50 day avg vol) |
52 Wk Hi
% From Hi |
Featured
Date |
Price
Featured |
Pivot Featured |
|
Max Buy |
 GPK
-
NYSE
GPK
-
NYSE
Graphic Packaging
CONSUMER NON-DURABLES - Packaging and Containers
|
$25.68
|
-0.22
-0.85% |
$25.88
|
1,619,112
52.38% of 50 DAV
50 DAV is 3,091,000
|
$26.16
-1.83%
|
10/25/2022
|
$22.75
|
PP = $24.17
|
|
MB = $25.38
|
Most Recent Note - 5/10/2023 12:10:15 PM
G - Touched a new all-time high again today. Color code was changed to green while hovering above its "max buy" level with volume totals cooling. Reported Mar '23 quarterly earnings +60% on +9% sales revenues versus the year-ago period. Its 50 DMA line ($24.68) defines important near-term support to watch on pullbacks.
>>> FEATURED STOCK ARTICLE : Packaging Firm Due to Report Earnings News - 5/1/2023 |
View all notes |
Set NEW NOTE alert |
Company Profile |
SEC
News |
Chart |
Request a new note
C
A
S
I |
STRL
-
NASDAQ
Sterling Infrastructure
MATERIALS and; CONSTRUCTION - Heavy Construction
|
$42.68
|
-0.24
-0.56% |
$42.94
|
147,445
58.74% of 50 DAV
50 DAV is 251,000
|
$43.60
-2.11%
|
12/14/2022
|
$32.41
|
PP = $33.72
|
|
MB = $35.41
|
 Most Recent Note - 5/11/2023 6:26:45 PM
G - Perched at its all-time high with volume totals cooling. Reported Mar '23 quarterly earnings +0% on +10% sales revenues versus the year-ago period, below the +25% minimum earnings guideline (C criteria) raising fundamental concerns.
>>> FEATURED STOCK ARTICLE : 50-Day Moving Average Line Acted as Recent Resistance - 4/28/2023 |
View all notes |
Set NEW NOTE alert |
Company Profile |
SEC
News |
Chart |
Request a new note
C
A
S
I |
FIX
-
NYSE
Comfort Systems USA
MATERIALS and CONSTRUCTION - General Contractors
|
$150.00
|
-0.30
-0.20% |
$150.79
|
294,197
99.06% of 50 DAV
50 DAV is 297,000
|
$154.15
-2.69%
|
4/27/2023
|
$148.85
|
PP = $152.23
|
|
MB = $159.84
|
Most Recent Note - 5/8/2023 7:38:49 PM
Y - Pulled back today with lighter volume after hitting a new high on the prior session with a volume-driven gain. Previously noted - "Bullish action came after it reported Mar '23 quarterly earnings +66% on +33% sales revenues versus the year-ago period. Powered above its 50 DMA line ($140.70) with a considerable gain backed by twice its average volume. Its color code was changed to yellow with pivot point cited based on its 3/03/23 high plus 10 cents. Very little resistance remains due to overhead supply up to the $152 level. A gain and new high backed by at least +40% above average volume may trigger a technical buy signal."
>>> FEATURED STOCK ARTICLE : Consolidating Near 50-Day Moving Average and -10.5% off High - 4/21/2023 |
View all notes |
Set NEW NOTE alert |
Company Profile |
SEC
News |
Chart |
Request a new note
C
A
S
I |
KOF
-
NYSE
Coca-Cola Femsa ADR
FOOD and BEVERAGE - Beverages - Soft Drinks
|
$90.62
|
+0.35
0.39% |
$90.86
|
140,020
70.36% of 50 DAV
50 DAV is 199,000
|
$91.23
-0.67%
|
3/7/2023
|
$76.63
|
PP = $77.11
|
|
MB = $80.97
|
Most Recent Note - 5/8/2023 7:41:17 PM
G - Hit another new all-time high with above-average volume behind today's 5th consecutive gain. Reported Mar '23 quarterly earnings +53% on +24% sales revenues versus the year-ago period. On pullbacks, prior highs in the $79-$77 area define initial support to watch along with its 50 DMA line ($80.14).
>>> FEATURED STOCK ARTICLE : Posted Gain Afrer Reporting Strong Mar '23 Quarterly Results - 5/2/2023 |
View all notes |
Set NEW NOTE alert |
Company Profile |
SEC
News |
Chart |
Request a new note
C
A
S
I |
CLH
-
NYSE
Clean Harbors
Pollution Control
|
$139.96
|
+0.76
0.55% |
$140.22
|
289,453
65.49% of 50 DAV
50 DAV is 442,000
|
$147.76
-5.28%
|
3/10/2023
|
$136.89
|
PP = $136.74
|
|
MB = $143.58
|
Most Recent Note - 5/10/2023 5:47:17 PM
Y - Found support near its 50 DMA line ($138.24) after a big loss last week triggered a technical sell signal. More damaging losses would raise greater concerns. Reported Mar '23 quarterly earnings +64% on +12% sales revenues versus the year-ago period. Recently wedged up above its "max buy" level with gains backed by lackluster volume, not action considered indicative of fresh institutional buying demand. Fundamentals remain strong. See the latest FSU analysis for more details and a new annotated graph.
>>> FEATURED STOCK ARTICLE : Showed Resilience Near 50-Day Moving Average Following Sell-Off - 5/10/2023 |
View all notes |
Set NEW NOTE alert |
Company Profile |
SEC
News |
Chart |
Request a new note
C
A
S
I |
Symbol/Exchange
Company Name
Industry Group |
PRICE |
CHANGE
(%Change) |
Day High |
Volume
(% DAV)
(% 50 day avg vol) |
52 Wk Hi
% From Hi |
Featured
Date |
Price
Featured |
Pivot Featured |
|
Max Buy |
MTRN
-
NYSE
Materion
METALS and MINING - Industrial Metals and Minerals
|
$102.44
|
-0.48
-0.47% |
$103.17
|
63,518
61.08% of 50 DAV
50 DAV is 104,000
|
$121.29
-15.54%
|
4/18/2023
|
$114.52
|
PP = $118.30
|
|
MB = $124.22
|
Most Recent Note - 5/9/2023 6:54:29 PM
G - Fell with lighter volume after abruptly retreating on 5/04/23 for damaging loss with above-average volume as it again violated its 50 DMA line ($110.75) raising concerns. Disciplined investors may note that it did not quite produce a gain and a strong close above the pivot point backed by at least +40% above average volume to trigger a proper technical buy signal. Reported Mar '23 quarterly earnings +13% versus the year-ago period, below the +25% minimum guideline (C criteria) raising fundamental concerns. See the latest FSU analysis for more details and a new annotated graph.
>>> FEATURED STOCK ARTICLE : Materion Sputtering Below 50 DMA Line After Subpar Earnings - 5/9/2023 |
View all notes |
Set NEW NOTE alert |
Company Profile |
SEC
News |
Chart |
Request a new note
C
A
S
I |
SPSC
-
NASDAQ
SPS Commerce
COMPUTER SOFTWARE and SERVICES - Application Software
|
$155.69
|
-2.85
-1.80% |
$157.86
|
114,111
77.63% of 50 DAV
50 DAV is 147,000
|
$159.65
-2.48%
|
4/24/2023
|
$150.01
|
PP = $157.56
|
|
MB = $165.44
|
Most Recent Note - 5/10/2023 5:31:28 PM
Y - Hit a new 52-week high with today's 4th consecutive gain backed by average volume. Subsequent gains above the pivot point backed by at least +40% above average volume may trigger a technical buy signal. Reported Mar '23 quarterly earnings +22% on +20% versus the year-ago period, below the +25% minimum earnings guideline (C criteria) raising some fundamental concerns.
>>> FEATURED STOCK ARTICLE : Sputtered While Perched in Striking Distance of 52-Week HIgh - 4/24/2023 |
View all notes |
Set NEW NOTE alert |
Company Profile |
SEC
News |
Chart |
Request a new note
C
A
S
I |
HUBB
-
NYSE
Hubbell
Electrical-Power/Equipmt
|
$272.75
|
+0.56
0.21% |
$273.63
|
250,063
63.63% of 50 DAV
50 DAV is 393,000
|
$282.19
-3.35%
|
4/25/2023
|
$262.85
|
PP = $257.51
|
|
MB = $270.39
|
Most Recent Note - 5/9/2023 3:04:04 PM
G - Holding its ground near its all-time high with volume totals cooling. Bullish action came after its strong Mar '23 quarterly results. Prior highs in the $263 area define initial support to watch on pullbacks.
>>> FEATURED STOCK ARTICLE : Gap Up Following Earnings Triggered Technical Buy Signal - 4/25/2023 |
View all notes |
Set NEW NOTE alert |
Company Profile |
SEC
News |
Chart |
Request a new note
C
A
S
I |
NVR
-
NYSE
NVR Inc
MATERIALS and CONSTRUCTION - Residential Construction
|
$5,837.83
|
+1.32
0.02% |
$5,873.92
|
17,248
78.40% of 50 DAV
50 DAV is 22,000
|
$5,986.96
-2.49%
|
4/25/2023
|
$5,882.18
|
PP = $5,978.25
|
|
MB = $6,277.16
|
Most Recent Note - 5/10/2023 5:53:37 PM
G - Still hovering near its all-time high with volume totals cooling. Reported Mar '23 quarterly earnings -14% on -3% sales revenues versus the year-ago period, below the +25% minimum earnings guideline (C criteria) raising fundamental concerns, and its color code was changed to green. Confirming gains and a close above the pivot point backed by at least +40% above average volume may clinch a proper technical buy signal. Prior quarterly comparisons were well above the +25% minimum earnings guideline (C criteria). Annual earnings (A criteria) growth has been very strong.
>>> FEATURED STOCK ARTICLE : Fell From High and Raised Concern With Subpar Mar '23 Report - 4/27/2023 |
View all notes |
Set NEW NOTE alert |
Company Profile |
SEC
News |
Chart |
Request a new note
C
A
S
I |
PHM
-
NYSE
PulteGroup
MATERIALS and CONSTRUCTION - Residential Construction
|
$68.12
|
+0.32
0.47% |
$68.26
|
1,939,076
64.34% of 50 DAV
50 DAV is 3,014,000
|
$68.73
-0.89%
|
4/25/2023
|
$65.17
|
PP = $64.01
|
|
MB = $67.21
|
Most Recent Note - 5/10/2023 5:59:32 PM
G - Perched at its all-time high and "max buy" level and its color code is changed to green. Reported earnings +28% for the Mar '23 quarter versus the year-ago period. Prior highs in the $64-60 area define initial support to watch above its 50 DMA line ($59.61).
>>> FEATURED STOCK ARTICLE : Recently Rallying to New All-Time Highs - 4/26/2023 |
View all notes |
Set NEW NOTE alert |
Company Profile |
SEC
News |
Chart |
Request a new note
C
A
S
I |
Symbol/Exchange
Company Name
Industry Group |
PRICE |
CHANGE
(%Change) |
Day High |
Volume
(% DAV)
(% 50 day avg vol) |
52 Wk Hi
% From Hi |
Featured
Date |
Price
Featured |
Pivot Featured |
|
Max Buy |
COKE
-
NASDAQ
Coca-Cola Consolidated
FOOD and BEVERAGE - Beverages - Soft Drinks
|
$633.22
|
+3.30
0.52% |
$634.09
|
29,175
81.04% of 50 DAV
50 DAV is 36,000
|
$694.20
-8.78%
|
5/4/2023
|
$646.66
|
PP = $656.21
|
|
MB = $689.02
|
Most Recent Note - 5/9/2023 3:09:26 PM
Y - Pulling back today for a 3rd consecutive loss, raising concerns while slumping back below the pivot point cited. Solid gain on 5/04/23 backed by +128% above average volume as it closed above the new pivot point cited based on its 6/07/22 high plus 10 cents triggered a technical buy signal. Bullish action came after it reported Mar '23 quarterly earnings +93% on +12% sales revenues versus the year-ago period, continuing its strong earnings track record.
>>> FEATURED STOCK ARTICLE : COKE is Showing Real Strength - 5/4/2023 |
View all notes |
Set NEW NOTE alert |
Company Profile |
SEC
News |
Chart |
Request a new note
C
A
S
I |
|
|
|
THESE ARE NOT BUY RECOMMENDATIONS!
Comments contained in the body of this report are technical
opinions only. The material herein has been obtained
from sources believed to be reliable and accurate, however,
its accuracy and completeness cannot be guaranteed.
This site is not an investment advisor, hence it does
not endorse or recommend any securities or other investments.
Any recommendation contained in this report may not
be suitable for all investors and it is not to be deemed
an offer or solicitation on our part with respect to
the purchase or sale of any securities. All trademarks,
service marks and trade names appearing in this report
are the property of their respective owners, and are
likewise used for identification purposes only.
This report is a service available
only to active Paid Premium Members.
You may opt-out of receiving report notifications
at any time. Questions or comments may be submitted
by writing to Premium Membership Services 665 S.E. 10 Street, Suite 201 Deerfield Beach, FL 33441-5634 or by calling 1-800-965-8307
or 954-785-1121.
|
|
|