You are not logged in.
This means you
CAN ONLY VIEW reports that were published prior to Wednesday, April 9, 2025.
You
MUST UPGRADE YOUR MEMBERSHIP if you want to see any current reports.
AFTER MARKET UPDATE - THURSDAY, MARCH 4TH, 2021
Previous After Market Report Next After Market Report >>>
|
|
|
|
DOW |
-345.95 |
30,924.14 |
-1.11% |
|
Volume |
1,449,467,239 |
+21% |
|
Volume |
7,740,459,800 |
+42% |
|
NASDAQ |
-274.28 |
12,723.47 |
-2.11% |
|
Advancers |
713 |
23% |
|
Advancers |
605 |
16% |
|
S&P 500 |
-51.25 |
3,768.47 |
-1.34% |
|
Decliners |
2,438 |
77% |
|
Decliners |
3,192 |
84% |
|
Russell 2000 |
-60.87 |
2,146.92 |
-2.76% |
|
52 Wk Highs |
160 |
|
|
52 Wk Highs |
200 |
|
|
S&P 600 |
-25.20 |
1,272.27 |
-1.94% |
|
52 Wk Lows |
154 |
|
|
52 Wk Lows |
313 |
|
|
Weak action has raised a red flag concerning the M criteria. Damaging losses have been noted as the mood of the market has abruptly shifted. Raise cash by selling stocks on a case-by-case basis as the market dictates. Disciplined investors will watch for a new rally and follow-through day before considering any new buying efforts.
|
 |
Major Indices Show Weakness Indicative of Market Correction
Kenneth J. Gruneisen - Passed the CAN SLIM® Master's Exam
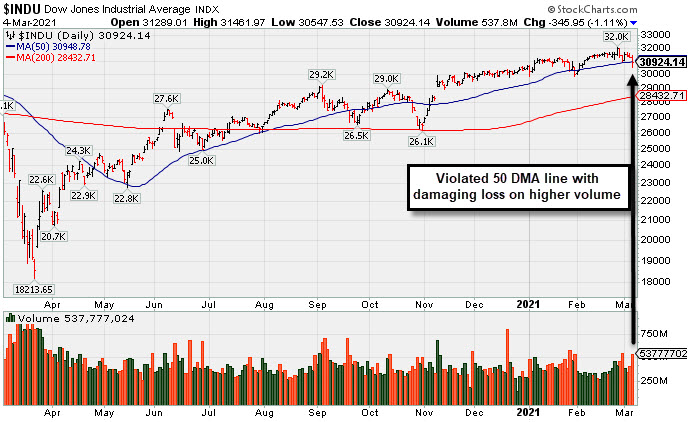
The Dow reversed earlier gains, sliding 345 points. The S&P 500 briefly fell into negative territory for the year before paring steeper declines. Still, the benchmark index fell 1.3%. The tech-heavy Nasdaq Composite slumped 2.1%, closing within 0.3% of correction territory, which is defined as a 10% drop from its recent high (February 12). The volume was higher than the prior session total on the NYSE and on the Nasdaq exchange, indicative of distributional pressure or institutional selling. Decliners led advancers by more than a 3-1 margin on the NYSE and 5-1 on the Nasdaq exchange. There were 40 high-ranked companies from the Leaders List that hit new 52-week highs and were listed on the BreakOuts Page, versus the total of 84 on the prior session. New 52-week highs outnumbered new 52-week lows totals on the NYSE while new lows outnumbered new highs on the Nasdaq exchange. The major indices are in a correction (M criteria). Investors are reminded to raise cash and avoid new buying efforts until a new confirmed rally marked by a solid follow-through day.
PICTURED: The Dow Jones Industrial Average violated its 50-day moving average (DMA) line with a damaging loss on higher volume.
U.S. stocks fell for a third consecutive day in volatile trading, as investors digested comments from Federal Reserve Chair Jerome Powell. Market participants seemed underwhelmed as the Fed Chief refrained from rebuking the recent jump in bond yields. He focused on reiterating that the central bank’s accommodative monetary policy would remain for some time, as the U.S. economy remains “a long way” from the Fed’s goals of maximum employment and average inflation of 2%.
Treasuries resumed their sell-off, with the benchmark 10-year note rising eight basis points to 1.54%. Nine of 11 S&P 500 sectors ended in negative territory, with Information Technology stocks lagging. Energy shares bucked the downtrend, rising 2.5%, as WTI crude rallied 4.7% to $64.17/barrel after OPEC+ agreed to roll production cuts into April. In earnings, Vroom Inc. (VRM -28.00%) slumped to a new low after the used-car retailer posted a quarterly loss and revenue fell short of Wall Street expectations. Meanwhile, software maker Snowflake (SNOW +0.80%) edged higher following positive commentary from a number of analysts on the heels of its profit tally.
On the data front, initial jobless claims data showed 745,000 Americans filed for unemployment benefits in the week ending February 27. The figure came in slightly below expectations for a 750,000 uptick, but was higher than the prior 736,000 reading. |
 Kenneth J. Gruneisen started out as a licensed stockbroker in August 1987, a couple of months prior to the historic stock market crash that took the Dow Jones Industrial Average down -22.6% in a single day. He has published daily fact-based fundamental and technical analysis on high-ranked stocks online for two decades. Through FACTBASEDINVESTING.COM, Kenneth provides educational articles, news, market commentary, and other information regarding proven investment systems that work in good times and bad.
Comments contained in the body of this report are technical opinions only and are not necessarily those of Gruneisen Growth Corp. The material herein has been obtained from sources believed to be reliable and accurate, however, its accuracy and completeness cannot be guaranteed. Our firm, employees, and customers may effect transactions, including transactions contrary to any recommendation herein, or have positions in the securities mentioned herein or options with respect thereto. Any recommendation contained in this report may not be suitable for all investors and it is not to be deemed an offer or solicitation on our part with respect to the purchase or sale of any securities. |
|
 |
Tech, Financial, Retail, and Gold & Silver Indexes Fell
Kenneth J. Gruneisen - Passed the CAN SLIM® Master's Exam
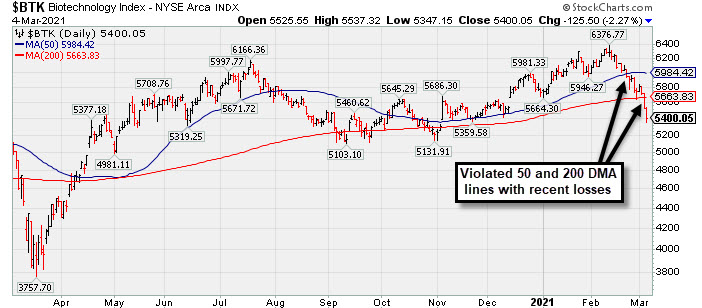
The Semiconductor Index ($SOX -4.84%) led the tech retreat while the Networking Index ($NWX -3.26%) and Biotech Index ($BTK -2.27%) also slumped for large losses. The Broker/Dealer Index ($XBD -2.09%) and Bank Index ($BKX -1.09%) both lost ground, and the Retail Index ($RLX -1.47%) also created a drag on the major averages. Commodity-linked groups were mixed as the Oil Services Index ($OSX +1.58%) and Integrated Oil Index ($XOI +2.73%) both posted solid gains while the Gold & Silver Index ($XAU -0.85%) ended lower.
PICTURED: The Biotech Index ($BTK -2.27%) graph shows that it has recently violated its 50-day and 200-day moving average lines, slumping toward prior lows.
| Oil Services |
$OSX |
57.99 |
+0.90 |
+1.58% |
+30.81% |
| Integrated Oil |
$XOI |
1,044.67 |
+27.75 |
+2.73% |
+31.82% |
| Semiconductor |
$SOX |
2,831.70 |
-143.89 |
-4.84% |
+1.29% |
| Networking |
$NWX |
742.90 |
-25.07 |
-3.26% |
+3.60% |
| Broker/Dealer |
$XBD |
427.23 |
-9.13 |
-2.09% |
+13.14% |
| Retail |
$RLX |
3,355.03 |
-50.20 |
-1.47% |
-5.84% |
| Gold & Silver |
$XAU |
130.68 |
-1.12 |
-0.85% |
-9.37% |
| Bank |
$BKX |
116.34 |
-1.29 |
-1.09% |
+18.83% |
| Biotech |
$BTK |
5,400.05 |
-125.50 |
-2.27% |
-5.91% |
|
|
|
 |
Negative Reversal When Poised For Technical Breakout
Kenneth J. Gruneisen - Passed the CAN SLIM® Master's Exam
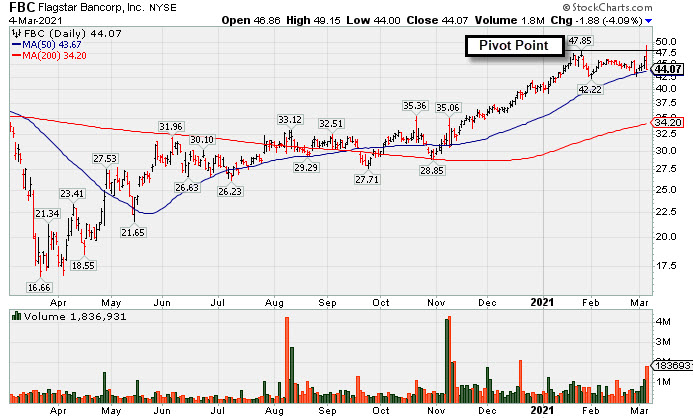
Flagstar Bancorp Inc (FBC -$1.88 or -4.09% to $44.07) had a "negative reversal" today after highlighted in yellow with pivot point cited based on its 1/26/21 high plus 10 cents in the earlier mid-day report (read here). It recently found support at its 50-day moving average (DMA) line and rallied to hit a new 52-week high with today's early gain. It was noted - "A gain and strong close above the pivot point backed by at least +40% above average volume is needed to trigger a proper technical buy signal." However, the negative reversal was action indicative of distributional pressure, not institutional accumulation. Confirming gains are needed to clinch a convincing technical buy signal.
The high-ranked BANKING - Savings and Loans firm was noted in the 2/16/21 mid-day report - "Reported very strong quarterly earnings results through Dec '20 well above the +25% minimum (C criteria). Annual earnings history has been good." The number of top-rated funds that own its shares rose from 395 in Mar '20 to 440 in Dec '20, a reassuring sign concerning the I criteria. Its current Up/Down Volume Ratio of 1.2 is an unbiased indication its shares have been under accumulation over the past 50 days.
" |
|
|
Color Codes Explained :
Y - Better candidates highlighted by our
staff of experts.
G - Previously featured
in past reports as yellow but may no longer be buyable under the
guidelines.
***Last / Change / Volume data in this table is the closing quote data***
Symbol/Exchange
Company Name
Industry Group |
PRICE |
CHANGE
(%Change) |
Day High |
Volume
(% DAV)
(% 50 day avg vol) |
52 Wk Hi
% From Hi |
Featured
Date |
Price
Featured |
Pivot Featured |
|
Max Buy |
 FBC
-
NYSE
FBC
-
NYSE
Flagstar Bancorp Inc
BANKING - Savings and Loans
|
$44.07
|
-1.88
-4.09% |
$49.15
|
1,511,210
242.57% of 50 DAV
50 DAV is 623,000
|
$47.92
-8.03%
|
3/4/2021
|
$47.26
|
PP = $48.02
|
|
MB = $50.42
|
 Most Recent Note - 3/4/2021 6:18:34 PM
Y - There was a "negative reversal" today at its 52-week high after featured in yellow with pivot point cited based on its 1/26/21 high plus 10 cents in the earlier mid-day report. Subsequent gains and a strong close above the pivot point backed by at least +40% above average volume are needed to trigger a proper technical buy signal. See the latest FSU analysis for more details and a new annotated graph.
>>> FEATURED STOCK ARTICLE : Negative Reversal When Poised For Technical Breakout - 3/4/2021 |
View all notes |
Set NEW NOTE alert |
Company Profile |
SEC
News |
Chart |
Request a new note
C
A
S
I |
CRL
-
NYSE
Charles River Labs Intl
DRUGS - Biotechnology
|
$268.16
|
-10.11
-3.63% |
$279.10
|
294,626
90.49% of 50 DAV
50 DAV is 325,600
|
$303.79
-11.73%
|
12/17/2020
|
$247.06
|
PP = $257.98
|
|
MB = $270.88
|
Most Recent Note - 3/4/2021 6:21:04 PM
G - Violated its 50 DMA line with a loss today with below average volume. Sputtering since it reported Dec '20 quarterly earnings +19% on +14% sales revenues versus the year ago period, below the +25% minimum earnings guideline (C criteria).
>>> FEATURED STOCK ARTICLE : CRL Still Hovering Near Record High - 3/1/2021 |
View all notes |
Set NEW NOTE alert |
Company Profile |
SEC
News |
Chart |
Request a new note
C
A
S
I |
OPY
-
NYSE
Oppenheimer Holdings Inc
FINANCIAL SERVICES - Investment Brokerage - Regiona
|
$38.85
|
-0.67
-1.70% |
$40.02
|
123,439
99.55% of 50 DAV
50 DAV is 124,000
|
$40.84
-4.87%
|
2/25/2021
|
$38.95
|
PP = $38.11
|
|
MB = $40.02
|
Most Recent Note - 3/2/2021 12:48:55 PM
G - Hit another new all-time high today following a noted spurt of volume-driven gains since featured in the 2/25/21 mid-day report. Disciplined investors avoid chasing stocks extended more than +5% above their pivot point.
>>> FEATURED STOCK ARTICLE : Rose From "3-weeks Tight" Base But Ended Near Session Low - 2/25/2021 |
View all notes |
Set NEW NOTE alert |
Company Profile |
SEC
News |
Chart |
Request a new note
C
A
S
I |
CLFD
-
NASDAQ
Clearfield Inc
TELECOMMUNICATIONS - Cables / Satalite Equipment
|
$30.83
|
-2.45
-7.36% |
$33.64
|
237,288
153.09% of 50 DAV
50 DAV is 155,000
|
$38.75
-20.44%
|
1/20/2021
|
$31.38
|
PP = $28.42
|
|
MB = $29.84
|
Most Recent Note - 3/4/2021 5:14:30 PM
G - Testing support at its 50 DMA line ($30.76) with today's damaging volume-driven loss. Prior highs in the $28 area define the next near-term support to watch. Fundamentals remain strong.
>>> FEATURED STOCK ARTICLE : Consolidating Well Above 50-Day Moving Average Line - 2/24/2021 |
View all notes |
Set NEW NOTE alert |
Company Profile |
SEC
News |
Chart |
Request a new note
C
A
S
I |
SMPL
-
NASDAQ
Simply Good Foods Co
Food-Confectionery
|
$28.94
|
+0.03
0.10% |
$29.79
|
795,415
69.77% of 50 DAV
50 DAV is 1,140,000
|
$32.03
-9.65%
|
12/28/2020
|
$30.40
|
PP = $31.44
|
|
MB = $33.01
|
Most Recent Note - 3/2/2021 5:23:48 PM
Y - Posted a big loss today with below average (but higher) volume, retesting its 50 DMA line ($28.91) which recently acted as support. Its Relative Strength Rating is 75, still below the 80+ minimum guideline. Its prior low ($26.78) defines the next important near term support to watch.
>>> FEATURED STOCK ARTICLE : Pulling Back Quietly After Rebounding Near All-Time High - 2/17/2021 |
View all notes |
Set NEW NOTE alert |
Company Profile |
SEC
News |
Chart |
Request a new note
C
A
S
I |
Symbol/Exchange
Company Name
Industry Group |
PRICE |
CHANGE
(%Change) |
Day High |
Volume
(% DAV)
(% 50 day avg vol) |
52 Wk Hi
% From Hi |
Featured
Date |
Price
Featured |
Pivot Featured |
|
Max Buy |
SHOP
-
NYSE
Shopify Inc Cl A
Computer Sftwr-Enterprse
|
$1,149.44
|
-70.86
-5.81% |
$1,220.30
|
2,635,582
194.51% of 50 DAV
50 DAV is 1,355,000
|
$1,499.75
-23.36%
|
2/2/2021
|
$1,218.72
|
PP = $1,285.28
|
|
MB = $1,349.54
|
Most Recent Note - 3/4/2021 5:20:24 PM
Slumped further below its 50 DMA line ($1,240) with today's big loss on heavy volume. Damaging losses triggered a technical sell signal and it will be dropped from the Featured Stocks list tonight. Only a prompt rebound above the 50 DMA line would help its outlook improve. Reported Dec '20 quarterly earnings +267% on +94% sales revenues versus the year ago period.
>>> FEATURED STOCK ARTICLE : Found Support Near Prior High and 50-Day Moving Average - 3/2/2021 |
View all notes |
Set NEW NOTE alert |
Company Profile |
SEC
News |
Chart |
Request a new note
C
A
S
I |
YETI
-
NYSE
Yeti Holdings Inc
Leisure-Products
|
$65.09
|
-4.25
-6.13% |
$68.52
|
1,822,489
123.22% of 50 DAV
50 DAV is 1,479,000
|
$80.89
-19.53%
|
2/19/2021
|
$74.99
|
PP = $80.99
|
|
MB = $85.04
|
Most Recent Note - 3/4/2021 5:48:03 PM
Suffered another damaging loss today with above average volume triggering a more worrisome technical sell signal. Undercut the prior low ($64.80) on 2/01/21) which defines important near term support. Fundamentals remain strong. It will be dropped from the Featured Stocks list tonight.
>>> FEATURED STOCK ARTICLE : Rebounded Just Above 50-Day Moving Average Line - 2/18/2021 |
View all notes |
Set NEW NOTE alert |
Company Profile |
SEC
News |
Chart |
Request a new note
C
A
S
I |
DT
-
NYSE
Dynatrace Inc
Computer Sftwr-Enterprse
|
$48.12
|
-2.34
-4.64% |
$51.45
|
3,486,006
139.38% of 50 DAV
50 DAV is 2,501,000
|
$56.77
-15.24%
|
2/4/2021
|
$51.39
|
PP = $48.95
|
|
MB = $51.40
|
Most Recent Note - 3/4/2021 5:50:17 PM
G - Pulled back with above average volume today, testing prior highs in the $48 area and its 50 DMA line ($46.94). More damaging losses would raise serious concerns. Fundamentals remain strong after it reported Dec '20 earnings +70% on +28% sales revenues versus the year ago period.
>>> FEATURED STOCK ARTICLE : Consolidating Above Prior Highs and 50-Day Moving Average - 3/3/2021 |
View all notes |
Set NEW NOTE alert |
Company Profile |
SEC
News |
Chart |
Request a new note
C
A
S
I |
MRBK
-
NASDAQ
Meridian Corp
Banks-Northeast
|
$26.00
|
+0.34
1.33% |
$26.90
|
60,544
208.77% of 50 DAV
50 DAV is 29,000
|
$26.94
-3.49%
|
2/22/2021
|
$25.58
|
PP = $26.10
|
|
MB = $27.41
|
Most Recent Note - 3/4/2021 1:01:11 PM
Y - Posting a solid gain today with above average volume, rising above the pivot point and challenging its 52-week high. Pivot point cited was based on its 12/18/21 high plus 10 cents. Repeatedly noted - "Subsequent gains and a strong close above its pivot point backed by at least +40% above average volume may help clinch a convincing technical buy signal. Fundamentals are strong.
>>> FEATURED STOCK ARTICLE : Negative Reversal When Poised to Convincingly Breakout - 2/22/2021 |
View all notes |
Set NEW NOTE alert |
Company Profile |
SEC
News |
Chart |
Request a new note
C
A
S
I |
AXON
-
NASDAQ
Axon Enterprise Inc
Security/Sfty
|
$144.90
|
-10.11
-6.52% |
$155.36
|
1,239,037
173.53% of 50 DAV
50 DAV is 714,000
|
$212.37
-31.77%
|
12/22/2020
|
$127.84
|
PP = $130.51
|
|
MB = $137.04
|
Most Recent Note - 3/4/2021 5:11:48 PM
Suffered a 3rd consecutive big loss today on heavier volume, decisively violating its 50 DMA line ($156) and triggering a technical sell signal. It will be dropped from the featured Stocks list tonight. Only a prompt rebound above the 50 DMA line would help its outlook improve.
>>> FEATURED STOCK ARTICLE : Slumping Toward 50-Day Average Following Great Rally - 2/26/2021 |
View all notes |
Set NEW NOTE alert |
Company Profile |
SEC
News |
Chart |
Request a new note
C
A
S
I |
Symbol/Exchange
Company Name
Industry Group |
PRICE |
CHANGE
(%Change) |
Day High |
Volume
(% DAV)
(% 50 day avg vol) |
52 Wk Hi
% From Hi |
Featured
Date |
Price
Featured |
Pivot Featured |
|
Max Buy |
|
|
|
THESE ARE NOT BUY RECOMMENDATIONS!
Comments contained in the body of this report are technical
opinions only. The material herein has been obtained
from sources believed to be reliable and accurate, however,
its accuracy and completeness cannot be guaranteed.
This site is not an investment advisor, hence it does
not endorse or recommend any securities or other investments.
Any recommendation contained in this report may not
be suitable for all investors and it is not to be deemed
an offer or solicitation on our part with respect to
the purchase or sale of any securities. All trademarks,
service marks and trade names appearing in this report
are the property of their respective owners, and are
likewise used for identification purposes only.
This report is a service available
only to active Paid Premium Members.
You may opt-out of receiving report notifications
at any time. Questions or comments may be submitted
by writing to Premium Membership Services 665 S.E. 10 Street, Suite 201 Deerfield Beach, FL 33441-5634 or by calling 1-800-965-8307
or 954-785-1121.
|
|
|