You are not logged in.
This means you
CAN ONLY VIEW reports that were published prior to Tuesday, April 8, 2025.
You
MUST UPGRADE YOUR MEMBERSHIP if you want to see any current reports.
AFTER MARKET UPDATE - FRIDAY, JANUARY 14TH, 2022
Previous After Market Report Next After Market Report >>>
|
|
|
|
DOW |
-201.81 |
35,911.81 |
-0.56% |
|
Volume |
893,617,614 |
+6% |
|
Volume |
4,327,079,500 |
+2% |
|
NASDAQ |
+86.94 |
14,893.75 |
+0.59% |
|
Advancers |
1,304 |
40% |
|
Advancers |
2,004 |
45% |
|
S&P 500 |
+3.82 |
4,662.85 |
+0.08% |
|
Decliners |
1,963 |
60% |
|
Decliners |
2,419 |
55% |
|
Russell 2000 |
+3.02 |
2,162.46 |
+0.14% |
|
52 Wk Highs |
101 |
|
|
52 Wk Highs |
79 |
|
|
S&P 600 |
+6.25 |
1,388.27 |
+0.45% |
|
52 Wk Lows |
199 |
|
|
52 Wk Lows |
683 |
|
|
 |
Major Indices Were Mixed as New Lows Totals Swelled
Kenneth J. Gruneisen - Passed the CAN SLIM® Master's Exam
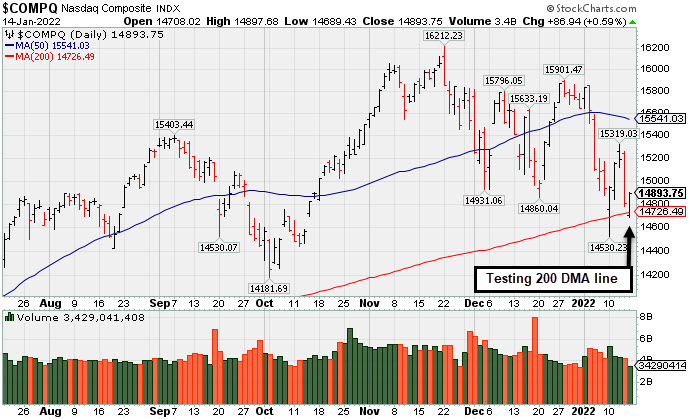
The Dow fell 201 points, dragging the blue chip index 0.9% lower for the week. The S&P 500 rose 0.1%, trimming its weekly loss to 0.3%. The Nasdaq Composite added 0.6%, paring its five-day drop to 0.3%, still its third straight weekly decline. Volume totals reported were higher than the prior session on the NYSE and on the Nasdaq exchange. Decliners led advancers by a 3-2 margin on the NYSE and 6-5 on the Nasdaq exchange. There were 41 high-ranked companies from the Leaders List that hit new 52-week highs and were listed on the BreakOuts Page, versus the total of 65 on the prior session. New 52-week lows outnumbered new 52-week highs by about 2-1 on the NYSE and even more decisively on the Nasdaq exchange. The market averages (M criteria) have an uptrend that is currently under pressure. New buying efforts are to be carefully made under the fact-based investment system's strict criteria. PICTURED: The Nasdaq Composite Index has been testing its 200-day moving average (DMA) line. The tech-heavy benchmark closed more than 7.2% below its most recent November 19 record, but remained above its 200-day moving average, a closely watched technical level.
Stocks finished mixed on Friday as investors weighed disappointing corporate earnings results and economic data. Seven of 11 S&P 500 sectors closed in negative territory, with Financials lagging the most as earnings from major banks were poorly received. JPMorgan Chase & Co. (JPM -6.15%) and Citigroup Inc. (C -1.25%) fell after both firms reported a slowdown in fourth-quarter profits amid weaker trading revenue. Elsewhere, Netflix Inc. (NFLX +1.25%) rose after announcing price increases for its streaming service.
Disappointing data also dampened sentiment. U.S. retail sales slumped 1.9% in December, the largest decline in 10 months. Separately, a preliminary reading from the University of Michigan showed consumer sentiment deteriorating in January. Additionally, industrial production contracted last month amid material and labor shortages.
Treasuries retreated as a chorus for Federal Reserve (Fed) leaders this week voiced support for a March rate hike. The yield on the more Fed-sensitive two-year note spiked seven basis points (0.07%) to 0.96%, a fresh pandemic peak. The yield on the 10-year note jumped eight basis points (0.08%) to 1.78%, though little changed on the week. In commodities, WTI crude ended at $84.19/barrel, capping a four-week winning streak that marked its best run since October.
|
 Kenneth J. Gruneisen started out as a licensed stockbroker in August 1987, a couple of months prior to the historic stock market crash that took the Dow Jones Industrial Average down -22.6% in a single day. He has published daily fact-based fundamental and technical analysis on high-ranked stocks online for two decades. Through FACTBASEDINVESTING.COM, Kenneth provides educational articles, news, market commentary, and other information regarding proven investment systems that work in good times and bad.
Comments contained in the body of this report are technical opinions only and are not necessarily those of Gruneisen Growth Corp. The material herein has been obtained from sources believed to be reliable and accurate, however, its accuracy and completeness cannot be guaranteed. Our firm, employees, and customers may effect transactions, including transactions contrary to any recommendation herein, or have positions in the securities mentioned herein or options with respect thereto. Any recommendation contained in this report may not be suitable for all investors and it is not to be deemed an offer or solicitation on our part with respect to the purchase or sale of any securities. |
|
 |
Semiconductor, Biotech, and Energy-Linked Groups Rose
Kenneth J. Gruneisen - Passed the CAN SLIM® Master's Exam
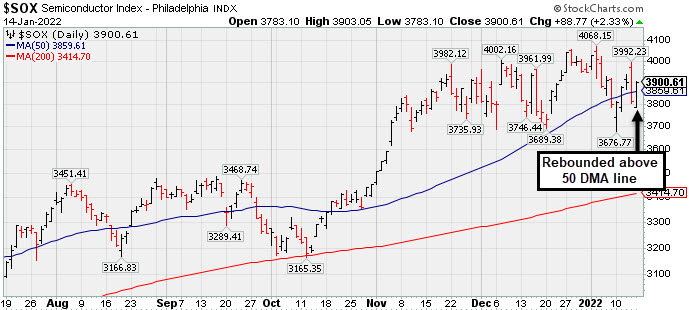
The Retail Index ($RLX -0.94%) outpaced the Bank Index ($BKX -0.31%) and Broker/Dealer Index ($XBD -0.67%) to the downside. The Semiconductor Index ($SOX +2.33%) and Biotech Index ($BTK +1.27%) both posted gains while the Networking Index ($NWX -0.42%) edged lower. Commodity-linked groups were mixed as the Oil Services Index ($OSX +3.82%) and Integrated Oil Index ($XOI +2.61%) both posted solid gains while the Gold & Silver Index ($XAU -1.13%) lost ground.
PICTURED: The Semiconductor Index ($SOX +2.33%) rebounded above its 50 DMA line with Friday's gain. It halted its slide after recently dipping below the prior low.
| Oil Services |
$OSX |
65.05 |
+2.40 |
+3.82% |
+23.39% |
| Integrated Oil |
$XOI |
1,382.96 |
+35.20 |
+2.61% |
+17.38% |
| Semiconductor |
$SOX |
3,900.61 |
+88.77 |
+2.33% |
-1.15% |
| Networking |
$NWX |
922.99 |
-3.86 |
-0.42% |
-4.95% |
| Broker/Dealer |
$XBD |
493.06 |
-3.30 |
-0.67% |
+1.27% |
| Retail |
$RLX |
4,005.45 |
-37.99 |
-0.94% |
-5.23% |
| Gold & Silver |
$XAU |
128.54 |
-1.47 |
-1.13% |
-2.96% |
| Bank |
$BKX |
147.10 |
-0.45 |
-0.31% |
+11.26% |
| Biotech |
$BTK |
5,256.11 |
+65.82 |
+1.27% |
-4.75% |
|
|
|
 |
Recent Low and 200 DMA Line Define Near-Term Support
Kenneth J. Gruneisen - Passed the CAN SLIM® Master's Exam
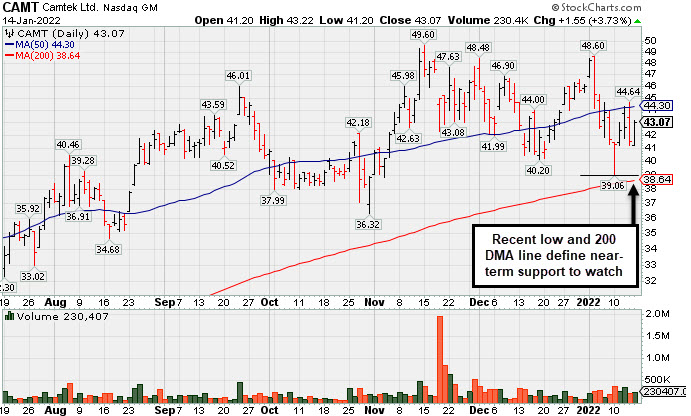
Camtek Ltd (CAMT +$1.55 or +3.73% to $43.07) has been sputtering after slumping below its 50-day moving average (DMA) line ($44.30). A rebound above the 50 DMA line is needed for its outlook to improve. The recent low and its 200 DMA line define the next important support level in the $39 area where any violation would raise more serious concerns.
Fundamentals remain strong. Recently it reported Sep '21 quarterly earnings +150% versus the year ago period, continuing its strong earnings track record. That marked its 5th strong quarterly comparison well above the +25% minimum guideline (C criteria) and showing impressive sequential acceleration. This Israeli Electronics firm has a strong annual earnings (A criteria) history. It has a 99 Earnings Per Share Rating.
The number of top-rated funds owning its shares rose from 48 in Jun '20 to 114 in Dec '21 a reassuring sign concerning the I criteria. Its current Up/Down Volume Ratio of 0.7 is an unbiased indication its shares have been under distributional pressure over the past 50 days. It completed a new Public Offering on 11/19/20. Still, its small supply of only 43.7 million shares outstanding (S criteria) can contribute to greater price volatility in the event of institutional buying or selling. It has a Timeliness Rating of B and a Sponsorship Rating of C. |
|
|
Color Codes Explained :
Y - Better candidates highlighted by our
staff of experts.
G - Previously featured
in past reports as yellow but may no longer be buyable under the
guidelines.
***Last / Change / Volume data in this table is the closing quote data***
Symbol/Exchange
Company Name
Industry Group |
PRICE |
CHANGE
(%Change) |
Day High |
Volume
(% DAV)
(% 50 day avg vol) |
52 Wk Hi
% From Hi |
Featured
Date |
Price
Featured |
Pivot Featured |
|
Max Buy |
 BLDR
-
NYSE
BLDR
-
NYSE
Builders Firstsource Inc
Bldg-Constr Prds/Misc
|
$78.68
|
-1.90
-2.36% |
$80.40
|
2,017,722
71.70% of 50 DAV
50 DAV is 2,814,000
|
$86.48
-9.02%
|
8/12/2021
|
$52.38
|
PP = $54.09
|
|
MB = $56.79
|
Most Recent Note - 1/10/2022 5:22:41 PM
G - Managed a positive reversal today. Very extended from any sound base. Reported Sep '21 quarterly earnings +308% on +140% sales revenues versus the year ago period. Its 50 DMA line ($73.99) and prior low ($72.60 on 12/20/21) define important near-term support to watch. See the latest FSU analysis for more details and a new annotated graph.
>>> FEATURED STOCK ARTICLE : Pulling Back After Getting Very Extended From Any Sound Base - 1/10/2022 |
View all notes |
Set NEW NOTE alert |
Company Profile |
SEC
News |
Chart |
Request a new note
C
A
S
I |
KFRC
-
NASDAQ
Kforce Inc
Comml Svcs-Staffing
|
$72.44
|
+0.17
0.24% |
$72.63
|
83,255
69.96% of 50 DAV
50 DAV is 119,000
|
$81.47
-11.08%
|
9/10/2021
|
$59.53
|
PP = $64.48
|
|
MB = $67.70
|
Most Recent Note - 1/13/2022 5:57:17 PM
G - Posted a gain today with lighter volume. A rebound above its 50 DMA line ($75) is needed for its outlook to improve. Recently reported Sep '21 quarterly earnings +8% on +10% sales revenues versus the year ago period, below the +25% minimum earnings guideline (C criteria), raising fundamental concerns.
>>> FEATURED STOCK ARTICLE : Consolidating Above its 50-Day Moving Average Line - 12/29/2021 |
View all notes |
Set NEW NOTE alert |
Company Profile |
SEC
News |
Chart |
Request a new note
C
A
S
I |
REGN
-
NASDAQ
Regeneron Pharmaceutical
DRUGS - Biotechnology
|
$615.24
|
-0.87
-0.14% |
$623.20
|
787,534
107.44% of 50 DAV
50 DAV is 733,000
|
$686.62
-10.40%
|
12/13/2021
|
$647.95
|
PP = $686.72
|
|
MB = $721.06
|
Most Recent Note - 1/11/2022 5:38:14 PM
G - Posted a 4th consecutive gain today, and a rebound above the 50 DMA line ($635) still is needed for its outlook to improve. See the latest FSU analysis for more details and a new annotated graph.
>>> FEATURED STOCK ARTICLE : Regeneron Still Lingering Below 50-Day Moving Average Line - 1/11/2022 |
View all notes |
Set NEW NOTE alert |
Company Profile |
SEC
News |
Chart |
Request a new note
C
A
S
I |
LLY
-
NYSE
Eli Lilly & Co
Medical-Diversified
|
$244.12
|
-5.55
-2.22% |
$250.54
|
2,887,698
91.79% of 50 DAV
50 DAV is 3,146,000
|
$283.91
-14.02%
|
12/16/2021
|
$279.28
|
PP = $275.97
|
|
MB = $289.77
|
Most Recent Note - 1/12/2022 12:50:12 PM
G - Color code is changed to green after slumping well below its 50 DMA line ($261) with today's big volume-driven loss raising greater concerns and triggering a technical sell signal. A prompt rebound above the 50 DMA line is needed for its outlook to improve.
>>> FEATURED STOCK ARTICLE : Eli Lilly & Co Powered to New Highs With Volume - 12/16/2021 |
View all notes |
Set NEW NOTE alert |
Company Profile |
SEC
News |
Chart |
Request a new note
C
A
S
I |
CAMT
-
NASDAQ
Camtek Ltd
ELECTRONICS - Scientific and Technical Instrum
|
$43.07
|
+1.55
3.73% |
$43.22
|
230,357
83.16% of 50 DAV
50 DAV is 277,000
|
$49.60
-13.17%
|
11/9/2021
|
$45.43
|
PP = $46.11
|
|
MB = $48.42
|
 Most Recent Note - 1/14/2022 5:21:29 PM
G - A rebound above the 50 DMA line is needed for its outlook to improve. Recent low and its 200 DMA line define the next important support level in the $39 area. See the latest FSU analysis for more details and a new annotated graph.
>>> FEATURED STOCK ARTICLE : Recent Low and 200 DMA Line Define Near-Term Support - 1/14/2022 |
View all notes |
Set NEW NOTE alert |
Company Profile |
SEC
News |
Chart |
Request a new note
C
A
S
I |
Symbol/Exchange
Company Name
Industry Group |
PRICE |
CHANGE
(%Change) |
Day High |
Volume
(% DAV)
(% 50 day avg vol) |
52 Wk Hi
% From Hi |
Featured
Date |
Price
Featured |
Pivot Featured |
|
Max Buy |
AMD
-
NASDAQ
Advanced Micro Devices
ELECTRONICS - Semiconductor - Broad Line
|
$136.88
|
+4.14
3.12% |
$137.00
|
70,945,725
115.26% of 50 DAV
50 DAV is 61,552,000
|
$164.46
-16.77%
|
10/27/2021
|
$124.91
|
PP = $122.59
|
|
MB = $128.72
|
Most Recent Note - 1/14/2022 5:25:56 PM
G - Posted a solid volume-driven gain today. A rebound above its 50 DMA line ($144.70) is needed for its outlook to improve. Fundamentals remain strong after it reported Sep '21 quarterly earnings +78% on +54% sales revenues versus the year ago period.
>>> FEATURED STOCK ARTICLE : Violation of 50-Day Moving Average Triggered Technical Sell Signal - 1/5/2022 |
View all notes |
Set NEW NOTE alert |
Company Profile |
SEC
News |
Chart |
Request a new note
C
A
S
I |
UMC
-
NYSE
United Microelectrnc Adr
ELECTRONICS - Semiconductor - Integrated Cir
|
$11.69
|
+0.29
2.54% |
$11.70
|
8,975,484
126.63% of 50 DAV
50 DAV is 7,088,000
|
$12.68
-7.81%
|
12/1/2021
|
$12.60
|
PP = $12.72
|
|
MB = $13.36
|
Most Recent Note - 1/14/2022 5:31:33 PM
Y - Rose above its 50 DMA line ($11.45) with 2 consecutive volume-driven gains helping its outlook improve and its color code is changed to yellow. Any damaging losses below the prior lows ($10.86) would raise more serious concerns and trigger a technical sell signal. A gain and solid close above the pivot point may help clinch a proper new (or add-on) technical buy signal. Reported Sep '21 quarterly earnings +100% on +30% sales revenues versus the year ago period.
>>> FEATURED STOCK ARTICLE : Testing Support and Perched Not Far From Prior Highs - 1/4/2022 |
View all notes |
Set NEW NOTE alert |
Company Profile |
SEC
News |
Chart |
Request a new note
C
A
S
I |
ENTG
-
NASDAQ
Entegris Inc
ELECTRONICS - Semiconductor Equipment and Mate
|
$133.62
|
+1.80
1.37% |
$133.88
|
743,621
60.71% of 50 DAV
50 DAV is 1,224,900
|
$158.00
-15.43%
|
8/4/2021
|
$125.33
|
PP = $126.51
|
|
MB = $132.84
|
Most Recent Note - 1/11/2022 5:42:50 PM
G - Halted its slide recently above its 200 DMA line, but a rebound above the 50 DMA line ($143.98) still is needed for its outlook to improve. Fundamentals remain strong after it recently reported Sep '21 quarterly earnings +37% on +20% sales revenues versus the year ago period.
>>> FEATURED STOCK ARTICLE : Still Below 50-Day Moving Average - 1/3/2022 |
View all notes |
Set NEW NOTE alert |
Company Profile |
SEC
News |
Chart |
Request a new note
C
A
S
I |
SKY
-
NYSE
Skyline Champion Corp
Bldg-Mobile/Mfg andamp; RV
|
$68.24
|
-2.27
-3.22% |
$70.43
|
457,743
88.20% of 50 DAV
50 DAV is 519,000
|
$85.92
-20.58%
|
11/3/2021
|
$72.19
|
PP = $66.92
|
|
MB = $70.27
|
Most Recent Note - 1/14/2022 5:27:58 PM
Slumped further today with lighter volume and it will be dropped from the Featured Stocks list tonight. A rebound above the 50 DMA line is needed for its outlook to improve. Fundamentals remain strong. See the latest FSU analysis for more details and an annotated graph.
>>> FEATURED STOCK ARTICLE : Sputtering Below 50 Day Moving Average Hurts Outlook - 1/13/2022 |
View all notes |
Set NEW NOTE alert |
Company Profile |
SEC
News |
Chart |
Request a new note
C
A
S
I |
DHI
-
NYSE
D R Horton Inc
MATERIALS and CONSTRUCTION - Residential Construction
|
$98.53
|
-1.23
-1.23% |
$99.88
|
2,722,132
87.70% of 50 DAV
50 DAV is 3,104,000
|
$110.45
-10.79%
|
12/6/2021
|
$104.40
|
PP = $106.99
|
|
MB = $112.34
|
Most Recent Note - 1/13/2022 6:04:10 PM
G - Posted a 4th consecutive volume-driven gain today after finding support at its 200 DMA line, but met resistance and ended the session below its 50 DMA line. A rebound above the 50 DMA line is needed to help its outlook improve.
>>> FEATURED STOCK ARTICLE : Pullback Testing Support at 50-Day Moving Average Line - 1/6/2022 |
View all notes |
Set NEW NOTE alert |
Company Profile |
SEC
News |
Chart |
Request a new note
C
A
S
I |
Symbol/Exchange
Company Name
Industry Group |
PRICE |
CHANGE
(%Change) |
Day High |
Volume
(% DAV)
(% 50 day avg vol) |
52 Wk Hi
% From Hi |
Featured
Date |
Price
Featured |
Pivot Featured |
|
Max Buy |
TITN
-
NASDAQ
Titan Machinery Inc
SPECIALTY RETAIL
|
$34.04
|
+0.33
0.98% |
$34.24
|
150,599
81.85% of 50 DAV
50 DAV is 184,000
|
$38.58
-11.77%
|
11/23/2021
|
$36.22
|
PP = $35.34
|
|
MB = $37.11
|
Most Recent Note - 1/10/2022 5:23:56 PM
G - Pulled back today with lighter volume undercutting its 50 DMA line ($32.86). It has not formed a sound base and faces resistance due to overhead supply up to the $38 level. Reported Oct '21 quarterly earnings +81% on +26% sales revenues over the year ago period, its 4th strong quarterly comparison.
>>> FEATURED STOCK ARTICLE : Recently Found Support at 50-Day Moving Average Line - 12/31/2021 |
View all notes |
Set NEW NOTE alert |
Company Profile |
SEC
News |
Chart |
Request a new note
C
A
S
I |
CLFD
-
NASDAQ
Clearfield Inc
TELECOMMUNICATIONS - Cables / Satalite Equipment
|
$67.84
|
-2.77
-3.92% |
$70.74
|
225,254
130.20% of 50 DAV
50 DAV is 173,000
|
$86.71
-21.76%
|
12/16/2021
|
$72.76
|
PP = $72.10
|
|
MB = $75.71
|
Most Recent Note - 1/14/2022 5:24:26 PM
G - Following a noted "negative reversal" on the prior session it violated its 50 DMA line ($69.82) with today's damaging loss raising more serious concerns. A prompt rebound above the 50 DMA line is needed for its outlook to improve. Reported Sep '21 quarterly earnings +141% on +66% sales revenues above the year ago period.
>>> FEATURED STOCK ARTICLE : Negative Reversal After Hitting a New All Time High - 12/30/2021 |
View all notes |
Set NEW NOTE alert |
Company Profile |
SEC
News |
Chart |
Request a new note
C
A
S
I |
POOL
-
NASDAQ
Pool Corp
WHOLESALE - Basic Materials Wholesale
|
$494.10
|
-13.13
-2.59% |
$503.83
|
332,072
123.91% of 50 DAV
50 DAV is 268,000
|
$582.27
-15.14%
|
12/27/2021
|
$555.44
|
PP = $582.37
|
|
MB = $611.49
|
Most Recent Note - 1/12/2022 1:00:19 PM
G - Halted its slide above its 200 DMA line ($475) after a damaging streak of 6 losses. A rebound above the 50 DMA line is ($547) is needed for its outlook to improve. Fundamentals remain strong.
>>> FEATURED STOCK ARTICLE : Forming New Base After Finding Prompt Support at 50 DMA - 12/27/2021 |
View all notes |
Set NEW NOTE alert |
Company Profile |
SEC
News |
Chart |
Request a new note
C
A
S
I |
SMPL
-
NASDAQ
Simply Good Foods Co
Food-Confectionery
|
$39.15
|
+0.65
1.69% |
$39.26
|
560,448
113.91% of 50 DAV
50 DAV is 492,000
|
$43.17
-9.31%
|
12/22/2021
|
$40.04
|
PP = $41.45
|
|
MB = $43.52
|
Most Recent Note - 1/10/2022 12:58:38 PM
G - Color code is changed to green while slumping below its 50 DMA line ($39.22) with a loss today raising greater concerns. Its 200 DMA line ($36.13) and prior low ($35.60 on 12/02/21) define the next important near-term support. Reported Nov '21 quarterly earnings +48% on +22% sales revenues versus the year ago period.
>>> FEATURED STOCK ARTICLE : Formed New 5-Week Base and Perched Near Pivot Point - 12/22/2021 |
View all notes |
Set NEW NOTE alert |
Company Profile |
SEC
News |
Chart |
Request a new note
C
A
S
I |
HLI
-
NYSE
Houlihan Lokey Inc Cl A
Finance-Invest Bnk/Bkrs
|
$114.96
|
-2.51
-2.14% |
$116.74
|
666,289
179.59% of 50 DAV
50 DAV is 371,000
|
$122.62
-6.25%
|
1/12/2022
|
$118.49
|
PP = $119.99
|
|
MB = $125.99
|
Most Recent Note - 1/12/2022 5:49:42 PM
Y - Closed above the new pivot point cited with today's 5th consecutive gain triggering a technical buy signal. Reported Sep '21 quarterly earnings +128% on +95% sales revenues versus the year ago period, marking its 4th quarterly comparison above the +25% minimum earnings guideline (C criteria). Completed a new Public Offering on 5/20/20. See the latest FSU analysis for more details and a new annotated graph.
>>> FEATURED STOCK ARTICLE : Powerful Volume-Driven Gain for New High - 1/12/2022 |
View all notes |
Set NEW NOTE alert |
Company Profile |
SEC
News |
Chart |
Request a new note
C
A
S
I |
Symbol/Exchange
Company Name
Industry Group |
PRICE |
CHANGE
(%Change) |
Day High |
Volume
(% DAV)
(% 50 day avg vol) |
52 Wk Hi
% From Hi |
Featured
Date |
Price
Featured |
Pivot Featured |
|
Max Buy |
AVTR
-
NYSE
Avantor Inc
Medical-Research Eqp/Svc
|
$37.71
|
+0.21
0.56% |
$37.73
|
3,767,616
100.39% of 50 DAV
50 DAV is 3,753,100
|
$44.37
-15.01%
|
12/27/2021
|
$41.96
|
PP = $44.47
|
|
MB = $46.69
|
Most Recent Note - 1/13/2022 6:10:08 PM
G - Met resistance near its 50 DMA line and slumped toward its 200 DMA line ($36.88) and prior low. A rebound above the 50 DMA line ($39.38) is needed for its outlook to improve. Reported Sep '21 quarterly earnings +46% above the year ago period.
>>> FEATURED STOCK ARTICLE : Rebounding With Volume-Driven Gains - 12/21/2021 |
View all notes |
Set NEW NOTE alert |
Company Profile |
SEC
News |
Chart |
Request a new note
C
A
S
I |
|
|
|
THESE ARE NOT BUY RECOMMENDATIONS!
Comments contained in the body of this report are technical
opinions only. The material herein has been obtained
from sources believed to be reliable and accurate, however,
its accuracy and completeness cannot be guaranteed.
This site is not an investment advisor, hence it does
not endorse or recommend any securities or other investments.
Any recommendation contained in this report may not
be suitable for all investors and it is not to be deemed
an offer or solicitation on our part with respect to
the purchase or sale of any securities. All trademarks,
service marks and trade names appearing in this report
are the property of their respective owners, and are
likewise used for identification purposes only.
This report is a service available
only to active Paid Premium Members.
You may opt-out of receiving report notifications
at any time. Questions or comments may be submitted
by writing to Premium Membership Services 665 S.E. 10 Street, Suite 201 Deerfield Beach, FL 33441-5634 or by calling 1-800-965-8307
or 954-785-1121.
|
|
|