You are not logged in.
This means you
CAN ONLY VIEW reports that were published prior to Tuesday, March 25, 2025.
You
MUST UPGRADE YOUR MEMBERSHIP if you want to see any current reports.
AFTER MARKET UPDATE - THURSDAY, DECEMBER 28TH, 2023
Previous After Market Report Next After Market Report >>>
|
|
|
|
DOW |
+53.58 |
37,710.10 |
+0.14% |
|
Volume |
662,416,240 |
-1% |
|
Volume |
5,221,733,800 |
-31% |
|
NASDAQ |
-4.04 |
15,095.14 |
-0.03% |
|
Advancers |
1,289 |
47% |
|
Advancers |
2,063 |
48% |
|
S&P 500 |
+1.77 |
4,783.35 |
+0.04% |
|
Decliners |
1,476 |
53% |
|
Decliners |
2,250 |
52% |
|
Russell 2000 |
-7.88 |
2,058.34 |
-0.38% |
|
52 Wk Highs |
127 |
|
|
52 Wk Highs |
258 |
|
|
S&P 600 |
-3.68 |
1,335.95 |
-0.27% |
|
52 Wk Lows |
6 |
|
|
52 Wk Lows |
62 |
|
|
 |
Major Indices Little Changed as Trading Volumes Cool Down
Kenneth J. Gruneisen - Passed the CAN SLIM® Master's Exam
The S&P 500 and Nasdaq Composite settled little changed while the Dow Jones Industrial Average eked out a +0.1% gain. The Russell 2000 (-0.4%) underperformed with a modest decline. Volume was reported near the prior session total on the NYSE and lighter on the Nasdaq exchange. Decliners led advancers by a narrow margin on the NYSE and on the Nasdaq exchange. There were 57 high-ranked companies from the Leaders List that hit new 52-week highs and were listed on the BreakOuts Page, less than half the total of 116 on the prior session. New 52-week highs totals contracted yet still outnumbered new 52-week lows totals on the NYSE and on the Nasdaq exchange. The major indices are in a confirmed uptrend (M criteria). New buying efforts should be only made in stocks fitting all key criteria of the fact-based investment system.
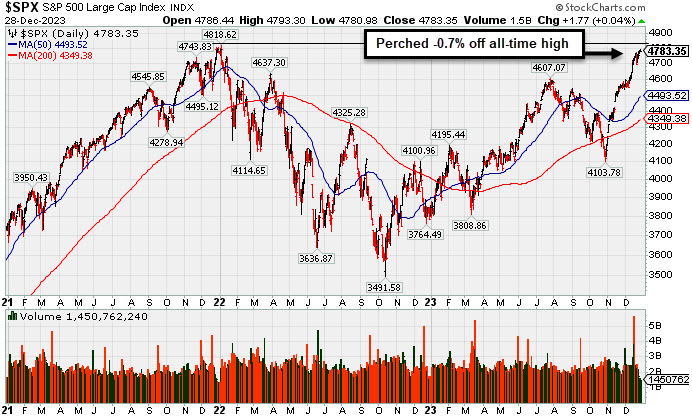
PICTURED: The benchmark S&P 500 Index is perched only -0.7% off its all-time high. Oil prices declined as WTI crude oil futures fell -3.1% to $71.80/bbl. The energy sector declined -1.5% while all other S&P 500 sectors moved less than 0.7% in either direction. The utilities (+0.7%) and real estate (+0.5%) sectors saw the largest gains.
A $40 billion 7-yr note auction met much weaker demand than Wednesday's upsized 5-yr note sale. The 2-yr note yield climbed six basis points to 4.29% and the 10-yr note yield jumped six basis points to 3.85% |
 Kenneth J. Gruneisen started out as a licensed stockbroker in August 1987, a couple of months prior to the historic stock market crash that took the Dow Jones Industrial Average down -22.6% in a single day. He has published daily fact-based fundamental and technical analysis on high-ranked stocks online for two decades. Through FACTBASEDINVESTING.COM, Kenneth provides educational articles, news, market commentary, and other information regarding proven investment systems that work in good times and bad.
Comments contained in the body of this report are technical opinions only and are not necessarily those of Gruneisen Growth Corp. The material herein has been obtained from sources believed to be reliable and accurate, however, its accuracy and completeness cannot be guaranteed. Our firm, employees, and customers may effect transactions, including transactions contrary to any recommendation herein, or have positions in the securities mentioned herein or options with respect thereto. Any recommendation contained in this report may not be suitable for all investors and it is not to be deemed an offer or solicitation on our part with respect to the purchase or sale of any securities. |
|
 |
Commodity-Linked Groups Led Decliners
Kenneth J. Gruneisen - Passed the CAN SLIM® Master's Exam
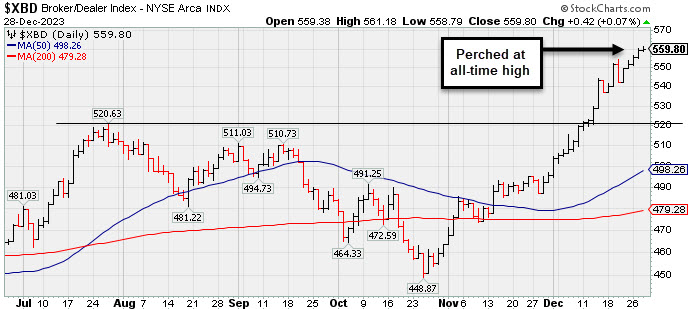
The Bank Index ($BKX +0.22%) inched higher while the Broker/Dealer Index ($XBD +0.07%) and the Retail Index ($RLX +0.02%) both finished flat. The Networking Index ($NWX +0.51%) led the tech sector while the Biotech Index ($BTK -0.06%) and the Semiconductor Index ($SOX -0.14%) each ended slightly in the red. Meanwhile, commodity-linked groups had a negative bias as the Integrated Oil Index ($XOI -1.81%), Oil Services Index ($OSX -1.43%), and the Gold & Silver Index ($XAU -2.35%) each lost ground.
PICTURED: The Broker/Dealer Index ($XBD +0.07%) is perched at its all-time high.
| Oil Services |
$OSX |
84.84 |
-1.23 |
-1.43% |
+1.17% |
| Integrated Oil |
$XOI |
1,863.26 |
-34.40 |
-1.81% |
+4.25% |
| Semiconductor |
$SOX |
4,208.68 |
-5.91 |
-0.14% |
+66.21% |
| Networking |
$NWX |
841.03 |
+4.24 |
+0.51% |
+7.37% |
| Broker/Dealer |
$XBD |
559.80 |
+0.42 |
+0.07% |
+24.64% |
| Retail |
$RLX |
3,910.75 |
+0.61 |
+0.02% |
+42.00% |
| Gold & Silver |
$XAU |
126.54 |
-3.04 |
-2.35% |
+4.70% |
| Bank |
$BKX |
96.68 |
+0.21 |
+0.22% |
-4.14% |
| Biotech |
$BTK |
5,432.52 |
-3.42 |
-0.06% |
+2.87% |
|
|
|
 |
Featured Stocks
Kenneth J. Gruneisen - Passed the CAN SLIM® Master's Exam
|
|
|
Color Codes Explained :
Y - Better candidates highlighted by our
staff of experts.
G - Previously featured
in past reports as yellow but may no longer be buyable under the
guidelines.
***Last / Change / Volume data in this table is the closing quote data***
Symbol/Exchange
Company Name
Industry Group |
PRICE |
CHANGE
(%Change) |
Day High |
Volume
(% DAV)
(% 50 day avg vol) |
52 Wk Hi
% From Hi |
Featured
Date |
Price
Featured |
Pivot Featured |
|
Max Buy |
 ANET
-
NYSE
ANET
-
NYSE
Arista Networks
Computer-Networking
|
$236.97
|
-0.76
-0.32% |
$237.85
|
716,728
33.31% of 50 DAV
50 DAV is 2,152,000
|
$240.68
-1.54%
|
10/31/2023
|
$188.84
|
PP = $198.80
|
|
MB = $208.74
|
Most Recent Note - 12/26/2023 8:38:00 PM
G - Hovering near its all-time high, extended from any sound base. Its 50 DMA line ($212) defines near-term support above the prior low in the $210 area. Fundamentals remain strong. See the latest FSU analysis for more details and a new annotated graph.
>>> FEATURED STOCK ARTICLE : Extended From Base and Hovering at All-Time High - 12/26/2023 |
View all notes |
Set NEW NOTE alert |
Company Profile |
SEC
News |
Chart |
Request a new note
C
A
S
I |
NVO
-
NYSE
Novo Nordisk ADR
Medical-Ethical Drugs
|
$103.47
|
-0.21
-0.20% |
$104.99
|
2,379,588
57.28% of 50 DAV
50 DAV is 4,154,000
|
$105.69
-2.10%
|
11/2/2023
|
$100.97
|
PP = $104.10
|
|
MB = $109.31
|
 Most Recent Note - 12/28/2023 6:21:31 PM
Y - There was a "negative reversal" after an early gain today as, with light volume, it closed at the session low. Recently wedged above its 50 DMA line ($99.75) toward its high with gains lacking great volume conviction. Its 50 DMA line defines initial support above the recent low ($94.73 on 12/11/23) on pullbacks.
>>> FEATURED STOCK ARTICLE : Managed a "Positive Reversal" but Still Below 50-Day Moving Average - 12/11/2023 |
View all notes |
Set NEW NOTE alert |
Company Profile |
SEC
News |
Chart |
Request a new note
C
A
S
I |
QLYS
-
NASDAQ
Qualys
Computer Sftwr-Security
|
$198.29
|
-3.33
-1.65% |
$201.60
|
278,462
76.08% of 50 DAV
50 DAV is 366,000
|
$206.35
-3.91%
|
11/3/2023
|
$167.50
|
PP = $165.03
|
|
MB = $173.28
|
Most Recent Note - 12/27/2023 5:35:13 PM
G - Pulled back today for a 2nd loss with light volume, consolidating after a streak of 10 consecutive gains for new all-time highs. It is very extended from any sound base. Its 50 DMA line ($177.60) defines initial support to watch.
>>> FEATURED STOCK ARTICLE : Extended From Base Following Big Breakout - 12/12/2023 |
View all notes |
Set NEW NOTE alert |
Company Profile |
SEC
News |
Chart |
Request a new note
C
A
S
I |
AXON
-
NASDAQ
Axon Enterprise
Security/Sfty
|
$258.80
|
-0.28
-0.11% |
$259.88
|
257,882
57.95% of 50 DAV
50 DAV is 445,000
|
$260.69
-0.72%
|
11/8/2023
|
$127.84
|
PP = $223.30
|
|
MB = $234.47
|
Most Recent Note - 12/28/2023 6:17:58 PM
G - Volume totals have been cooling while stubbornly holding its ground near its all-time high. On pullbacks, the prior highs in the $229-231 area define near-term support to watch coinciding with its 50-day moving average (DMA) line ($229).
>>> FEATURED STOCK ARTICLE : Axon Enterprise Hits New High With 6th Straight Gain - 12/13/2023 |
View all notes |
Set NEW NOTE alert |
Company Profile |
SEC
News |
Chart |
Request a new note
C
A
S
I |
TDG
-
NYSE
TransDigm Group
Aerospace/Defense
|
$1,012.79
|
+4.80
0.48% |
$1,014.31
|
118,896
52.61% of 50 DAV
50 DAV is 226,000
|
$1,015.72
-0.29%
|
12/12/2023
|
$1,000.39
|
PP = $1,013.18
|
|
MB = $1,063.84
|
Most Recent Note - 12/26/2023 8:41:22 PM
Y - Posted a 3rd consecutive gain backed by light volume for its second-best ever close. The new pivot point cited was based on its 11/14/23 high plus 10 cents, however, gains above the pivot point were not backed by the +40% above-average volume necessary to trigger a proper new technical buy signal. Fundamentals remain strong. Recent lows in the $950 area define near-term support to watch on pullbacks.
>>> FEATURED STOCK ARTICLE : Volume-Driven Loss Breaks Streak of 6 Straight Gains - 12/14/2023 |
View all notes |
Set NEW NOTE alert |
Company Profile |
SEC
News |
Chart |
Request a new note
C
A
S
I |
Symbol/Exchange
Company Name
Industry Group |
PRICE |
CHANGE
(%Change) |
Day High |
Volume
(% DAV)
(% 50 day avg vol) |
52 Wk Hi
% From Hi |
Featured
Date |
Price
Featured |
Pivot Featured |
|
Max Buy |
PANW
-
NASDAQ
Palo Alto Networks
Computer Sftwr-Security
|
$295.58
|
-1.92
-0.65% |
$297.66
|
1,934,331
44.05% of 50 DAV
50 DAV is 4,391,000
|
$318.00
-7.05%
|
11/13/2023
|
$255.90
|
PP = $266.00
|
|
MB = $279.30
|
Most Recent Note - 12/27/2023 5:19:13 PM
G - Pulled back today with light volume and volume totals have been cooling while still consolidating near its all-time high. Prior highs in the $265 area define important support to watch along with its 50 DMA line ($270). Fundamentals remain strong.
>>> FEATURED STOCK ARTICLE : Consolidating After Volume-Driven Gains for All-Time Highs - 12/15/2023 |
View all notes |
Set NEW NOTE alert |
Company Profile |
SEC
News |
Chart |
Request a new note
C
A
S
I |
URI
-
NYSE
United Rentals
Comml Svcs-Leasing
|
$578.69
|
-0.17
-0.03% |
$581.58
|
268,752
33.18% of 50 DAV
50 DAV is 810,000
|
$585.50
-1.16%
|
12/1/2023
|
$499.51
|
PP = $488.73
|
|
MB = $513.17
|
Most Recent Note - 12/28/2023 6:23:40 PM
G - Sputtered today but recovered to end in the upper third of its intra-day range with a small loss on below-average volume, perched very near its all-time high. On pullbacks, the prior highs define near-term support to watch above its 50 DMA line ($478).
>>> FEATURED STOCK ARTICLE : Perched Near All-Time High Following Volume-Driven Gains - 12/19/2023 |
View all notes |
Set NEW NOTE alert |
Company Profile |
SEC
News |
Chart |
Request a new note
C
A
S
I |
AMPH
-
NASDAQ
Amphastar Pharm
Medical-Biomed/Biotech
|
$62.19
|
-0.74
-1.18% |
$63.15
|
342,679
81.20% of 50 DAV
50 DAV is 422,000
|
$67.66
-8.08%
|
12/4/2023
|
$60.84
|
PP = $58.35
|
|
MB = $61.27
|
Most Recent Note - 12/28/2023 6:16:08 PM
G - Color code is changed to green after Tuesday's volume-driven gain triggered a technical buy signal and it rose above its "max buy" level. Little resistance remains due to overhead supply. Fundamentals remain strong.
>>> FEATURED STOCK ARTICLE : Consolidating Above Pivot Point With Volume Cooling - 12/21/2023 |
View all notes |
Set NEW NOTE alert |
Company Profile |
SEC
News |
Chart |
Request a new note
C
A
S
I |
TBBK
-
NASDAQ
The Bancorp
Banks-Northeast
|
$39.79
|
-0.06
-0.15% |
$40.02
|
255,902
58.43% of 50 DAV
50 DAV is 438,000
|
$42.46
-6.29%
|
12/4/2023
|
$39.88
|
PP = $41.62
|
|
MB = $43.70
|
Most Recent Note - 12/28/2023 6:25:53 PM
Y - Volume totals have been cooling while consolidating near its all-time high after a noted "negative reversal" and it is sputtering below its pivot point. Subsequent gains and a strong close above the pivot point backed by at least +40% above average volume may trigger a proper technical buy signal.
>>> FEATURED STOCK ARTICLE : Negative Reversals are Signs of Distributional Pressure - 12/22/2023 |
View all notes |
Set NEW NOTE alert |
Company Profile |
SEC
News |
Chart |
Request a new note
C
A
S
I |
LULU
-
NASDAQ
lululemon athletica
Retail-Apparel/Shoes/Acc
|
$509.22
|
+0.41
0.08% |
$512.48
|
688,622
31.60% of 50 DAV
50 DAV is 2,179,000
|
$513.50
-0.83%
|
12/8/2023
|
$490.61
|
PP = $485.93
|
|
MB = $510.23
|
Most Recent Note - 12/27/2023 5:33:17 PM
Y - Hovering near its all-time high but still below its "max buy" level with volume totals cooling. Its 2021 high of $485 defines initial support to watch after its recent breakout from a 2+ year base. See the latest FSU analysis for more details and a new annotated graph.
>>> FEATURED STOCK ARTICLE : Perched at All-Time High With Volume Totals Cooling - 12/27/2023 |
View all notes |
Set NEW NOTE alert |
Company Profile |
SEC
News |
Chart |
Request a new note
C
A
S
I |
Symbol/Exchange
Company Name
Industry Group |
PRICE |
CHANGE
(%Change) |
Day High |
Volume
(% DAV)
(% 50 day avg vol) |
52 Wk Hi
% From Hi |
Featured
Date |
Price
Featured |
Pivot Featured |
|
Max Buy |
|
|
|
THESE ARE NOT BUY RECOMMENDATIONS!
Comments contained in the body of this report are technical
opinions only. The material herein has been obtained
from sources believed to be reliable and accurate, however,
its accuracy and completeness cannot be guaranteed.
This site is not an investment advisor, hence it does
not endorse or recommend any securities or other investments.
Any recommendation contained in this report may not
be suitable for all investors and it is not to be deemed
an offer or solicitation on our part with respect to
the purchase or sale of any securities. All trademarks,
service marks and trade names appearing in this report
are the property of their respective owners, and are
likewise used for identification purposes only.
This report is a service available
only to active Paid Premium Members.
You may opt-out of receiving report notifications
at any time. Questions or comments may be submitted
by writing to Premium Membership Services 665 S.E. 10 Street, Suite 201 Deerfield Beach, FL 33441-5634 or by calling 1-800-965-8307
or 954-785-1121.
|
|
|