You are not logged in.
This means you
CAN ONLY VIEW reports that were published prior to Monday, April 28, 2025.
You
MUST UPGRADE YOUR MEMBERSHIP if you want to see any current reports.
AFTER MARKET UPDATE - MONDAY, NOVEMBER 27TH, 2023
Previous After Market Report Next After Market Report >>>
|
|
|
|
DOW |
-56.68 |
35,333.47 |
-0.16% |
|
Volume |
848,268,753 |
+126% |
|
Volume |
4,227,244,800 |
+66% |
|
NASDAQ |
-9.83 |
14,241.02 |
-0.07% |
|
Advancers |
1,189 |
42% |
|
Advancers |
1,646 |
37% |
|
S&P 500 |
-8.91 |
4,550.43 |
-0.20% |
|
Decliners |
1,642 |
58% |
|
Decliners |
2,762 |
63% |
|
Russell 2000 |
-6.35 |
1,801.15 |
-0.35% |
|
52 Wk Highs |
94 |
|
|
52 Wk Highs |
95 |
|
|
S&P 600 |
-3.76 |
1,170.05 |
-0.32% |
|
52 Wk Lows |
24 |
|
|
52 Wk Lows |
130 |
|
|
 |
Major Indices Showed More Indecisive Action
Kenneth J. Gruneisen - Passed the CAN SLIM® Master's Exam
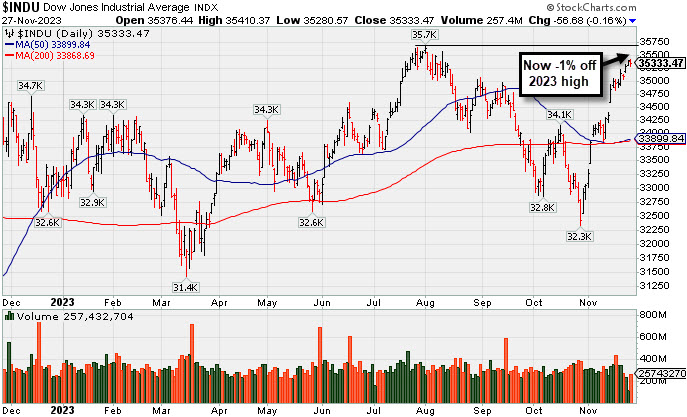
The major indices remained indecisive on Monday's session. Volume was clearly higher than the prior shortened session on the NYSE and on the Nasdaq exchange. Breadth was negative as advancers led decliners by about a 4-3 margin on the NYSE and by a 7-4 margin on the Nasdaq exchange. There were 67 high-ranked companies from the Leaders List that hit new 52-week highs and were listed on the BreakOuts Page, versus the total of 75 on the prior session. New 52-week highs outnumbered new 52-week lows on the NYSE but new lows outnumbered new highs on the Nasdaq exchange. The major indices are in a confirmed uptrend (M criteria). New buying efforts should be only made in stocks fitting all key criteria of the fact-based investment system.
PICTURED: The Dow Jones Industrial Average is perched -1% off its 2023 high. Mega-cap names Amazon.com (AMZN +0.67%), NVIDIA (NVDA +0.98%), Tesla (TSLA +0.27%), and Microsoft (MSFT +0.31%) each had a slightly positive bias. For the S&P 500 sectors the biggest gainer was the real estate sector (+0.4%) and the biggest loser was the health care sector (-0.6%). This Cyber Monday saw the retail stocks deliver a lackluster performance. The SPDR S&P Retail ETF (XRT) declined -0.6%.
Treasury yields took a lower turn after a weaker-than-expected October New Home Sales Report. Soft demand was seen at the $54 billion 2-yr note auction. The 2-yr note yield fell eight basis points to 4.87% and the 10-yr note yield dropped eight basis points to 4.39%.
|
 Kenneth J. Gruneisen started out as a licensed stockbroker in August 1987, a couple of months prior to the historic stock market crash that took the Dow Jones Industrial Average down -22.6% in a single day. He has published daily fact-based fundamental and technical analysis on high-ranked stocks online for two decades. Through FACTBASEDINVESTING.COM, Kenneth provides educational articles, news, market commentary, and other information regarding proven investment systems that work in good times and bad.
Comments contained in the body of this report are technical opinions only and are not necessarily those of Gruneisen Growth Corp. The material herein has been obtained from sources believed to be reliable and accurate, however, its accuracy and completeness cannot be guaranteed. Our firm, employees, and customers may effect transactions, including transactions contrary to any recommendation herein, or have positions in the securities mentioned herein or options with respect thereto. Any recommendation contained in this report may not be suitable for all investors and it is not to be deemed an offer or solicitation on our part with respect to the purchase or sale of any securities. |
|
 |
Retail and Gold & Silver Indexes Rose: Techs and Finanicals Fell
Kenneth J. Gruneisen - Passed the CAN SLIM® Master's Exam
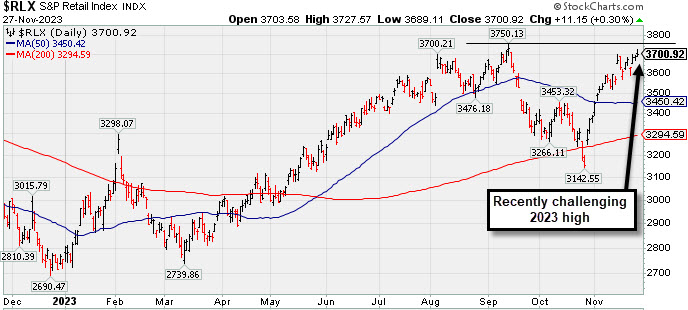
The Retail Index ($RLX +0.30%) posted a small gain on Monday while the Bank Index ($BKX -0.55%) and Broker/Dealer Index ($XBD -0.43%) both ended slightly lower. The tech sector had a slightly negative bias as the Networking Index ($NWX -1.20%) outpaced the Biotech Index ($BTK -0.98%) and the Semiconductor Index ($SOX -0.23%) to the downside. The Integrated Oil Index ($XOI -0.36%) and Oil Services Index ($OSX -0.70%) both lost ground while the Gold & Silver Index ($XAU +1.63%) posted a solid gain.
PICTURED: The Retail Index ($RLX +0.30%) has recently been challenging its 2023 high.
| Oil Services |
$OSX |
82.98 |
-0.58 |
-0.70% |
-1.05% |
| Integrated Oil |
$XOI |
1,845.04 |
-6.59 |
-0.36% |
+3.23% |
| Semiconductor |
$SOX |
3,739.31 |
-8.61 |
-0.23% |
+47.68% |
| Networking |
$NWX |
719.75 |
-8.74 |
-1.20% |
-8.11% |
| Broker/Dealer |
$XBD |
493.18 |
-2.13 |
-0.43% |
+9.81% |
| Retail |
$RLX |
3,700.92 |
+11.15 |
+0.30% |
+34.38% |
| Gold & Silver |
$XAU |
118.57 |
+1.90 |
+1.63% |
-1.89% |
| Bank |
$BKX |
82.23 |
-0.45 |
-0.55% |
-18.47% |
| Biotech |
$BTK |
4,792.43 |
-47.43 |
-0.98% |
-9.25% |
|
|
|
 |
Featured Stocks
Kenneth J. Gruneisen - Passed the CAN SLIM® Master's Exam
Symbol/Exchange
Company Name
Industry Group | PRICE | CHANGE
(%Change) | Day High | Volume
(% DAV)
(% 50 day avg vol) | 52 Wk Hi
% From Hi | Featured
Date | Price
Featured | Pivot Featured | | Max Buy |  ANET - NYSE ANET - NYSE
Arista Networks
Computer-Networking | $218.67 | +0.28
0.13% | $221.27 | 1,413,315
65.74% of 50 DAV
50 DAV is 2,150,000 | $221.41
-1.24%
| 10/31/2023 | $188.84 | PP = $198.80 | | MB = $208.74 |  Most Recent Note - 11/27/2023 5:00:48 PM Most Recent Note - 11/27/2023 5:00:48 PM
G - Managed a best-ever close with today''s 3rd consecutive small gain backed by below-average volume. Prior highs in the $198 area define near-term support above its 50 DMA line ($196). Fundamentals remain strong.
>>> FEATURED STOCK ARTICLE : Powerful Gain Following Earnings Report for Arista Networks - 10/31/2023 | View all notes | Set NEW NOTE alert | Company Profile | SEC News | Chart | Request a new note C A S I | NVO - NYSE
Novo Nordisk ADR
Medical-Ethical Drugs | $103.87 | -1.58
-1.50% | $105.44 | 4,736,320
97.66% of 50 DAV
50 DAV is 4,850,000 | $105.69
-1.72%
| 11/2/2023 | $100.97 | PP = $104.10 | | MB = $109.31 | Most Recent Note - 11/27/2023 5:04:22 PM
Y - Pulled back from its 52-week high with today''s loss on average volume. Found prompt support at its 50 DMA line ($97) when recently consolidating. It has been repeatedly noted - "Subsequent gains for new highs backed by at least +40% above average volume are needed to trigger a technical buy signal."
>>> FEATURED STOCK ARTICLE : Approaching Prior High With Strong Fundamentals - 11/2/2023 | View all notes | Set NEW NOTE alert | Company Profile | SEC News | Chart | Request a new note C A S I | QLYS - NASDAQ
Qualys
Computer Sftwr-Security | $181.46 | +0.99
0.55% | $182.00 | 215,226
62.75% of 50 DAV
50 DAV is 343,000 | $183.49
-1.11%
| 11/3/2023 | $167.50 | PP = $165.03 | | MB = $173.28 | Most Recent Note - 11/27/2023 5:07:23 PM
G - Posted another small gain today with light volume for a best-ever close. Prior high ($165) defines initial support to watch on pullbacks.
>>> FEATURED STOCK ARTICLE : Powerful Breakout for Qualys - 11/3/2023 | View all notes | Set NEW NOTE alert | Company Profile | SEC News | Chart | Request a new note C A S I | AXON - NASDAQ
Axon Enterprise
Security/Sfty | $228.16 | -0.26
-0.11% | $230.06 | 292,261
62.45% of 50 DAV
50 DAV is 468,000 | $231.71
-1.53%
| 11/8/2023 | $127.84 | PP = $223.30 | | MB = $234.47 | Most Recent Note - 11/27/2023 5:03:21 PM
Y - Volume totals have been cooling while hovering near its all-time high, above its pivot point and below its "max buy" level. The recent low ($212.89 on 11/09/23) defines near-term support above its 50 DMA line ($210.76).
>>> FEATURED STOCK ARTICLE : Breakout for Axon as it Returns to Featured Stocks List - 11/8/2023 | View all notes | Set NEW NOTE alert | Company Profile | SEC News | Chart | Request a new note C A S I | TDG - NYSE
TransDigm Group
Aerospace/Defense | $976.58 | +5.85
0.60% | $980.00 | 166,992
65.23% of 50 DAV
50 DAV is 256,000 | $1,013.08
-3.60%
| 11/9/2023 | $982.68 | PP = $940.10 | | MB = $987.11 | Most Recent Note - 11/27/2023 5:08:35 PM
G - Volume totals have been cooling while consolidating after briefly trading above the $1,000 threshold. Fundamentals remain strong. Prior high ($940) defines initial support to watch on pullbacks.
>>> FEATURED STOCK ARTICLE : TransDigm''s Big Gap Up Gain Triggered Technical Buy Signal - 11/9/2023 | View all notes | Set NEW NOTE alert | Company Profile | SEC News | Chart | Request a new note C A S I | Symbol/Exchange
Company Name
Industry Group | PRICE | CHANGE
(%Change) | Day High | Volume
(% DAV)
(% 50 day avg vol) | 52 Wk Hi
% From Hi | Featured
Date | Price
Featured | Pivot Featured | | Max Buy | PANW - NASDAQ
Palo Alto Networks
Computer Sftwr-Security | $269.09 | +3.01
1.13% | $269.94 | 3,089,791
85.21% of 50 DAV
50 DAV is 3,626,000 | $268.10
0.37%
| 11/13/2023 | $255.90 | PP = $266.00 | | MB = $279.30 | Most Recent Note - 11/27/2023 5:06:08 PM
Y - Posted a small gain today with light volume for a new all-time high. Subsequent gains above the pivot point backed by at least +40% above average volume may trigger a proper technical buy signal. Recovered quickly above its 50 DMA line after testing the prior low ($233.81 on 11/06/23) last week. Fundamentals remain strong after it reported Oct '23 quarterly earnings +66% on +20% sales revenues versus the year-ago period.
>>> FEATURED STOCK ARTICLE : Earnings New Due While Perched Near Prior High - 11/13/2023 | View all notes | Set NEW NOTE alert | Company Profile | SEC News | Chart | Request a new note C A S I |
|
|
|
Color Codes Explained :
Y - Better candidates highlighted by our
staff of experts.
G - Previously featured
in past reports as yellow but may no longer be buyable under the
guidelines.
***Last / Change / Volume data in this table is the closing quote data***
Symbol/Exchange
Company Name
Industry Group |
PRICE |
CHANGE
(%Change) |
Day High |
Volume
(% DAV)
(% 50 day avg vol) |
52 Wk Hi
% From Hi |
Featured
Date |
Price
Featured |
Pivot Featured |
|
Max Buy |
 ANET
-
NYSE
ANET
-
NYSE
Arista Networks
Computer-Networking
|
$218.62
|
+0.23
0.11% |
$219.27
|
162,615
7.56% of 50 DAV
50 DAV is 2,150,000
|
$221.41
-1.26%
|
10/31/2023
|
$188.84
|
PP = $198.80
|
|
MB = $208.74
|
Most Recent Note - 11/22/2023 5:01:27 PM
G - Hit a new all-time high with a gain today backed by below-average volume. Prior highs in the $198 area define near-term support above its 50 DMA line ($195). Fundamentals remain strong.
>>> FEATURED STOCK ARTICLE : Powerful Gain Following Earnings Report for Arista Networks - 10/31/2023 |
View all notes |
Set NEW NOTE alert |
Company Profile |
SEC
News |
Chart |
Request a new note
C
A
S
I |
NVO
-
NYSE
Novo Nordisk ADR
Medical-Ethical Drugs
|
$105.07
|
-0.38
-0.36% |
$105.44
|
1,327,255
27.37% of 50 DAV
50 DAV is 4,850,000
|
$105.69
-0.59%
|
11/2/2023
|
$100.97
|
PP = $104.10
|
|
MB = $109.31
|
Most Recent Note - 11/24/2023 12:21:06 PM
Y - Hitting a new 52-week high with today's gain. Found prompt support last week at its 50 DMA line ($96.77). It has been repeatedly noted - "Subsequent gains for new highs backed by at least +40% above average volume are needed to trigger a technical buy signal."
>>> FEATURED STOCK ARTICLE : Approaching Prior High With Strong Fundamentals - 11/2/2023 |
View all notes |
Set NEW NOTE alert |
Company Profile |
SEC
News |
Chart |
Request a new note
C
A
S
I |
QLYS
-
NASDAQ
Qualys
Computer Sftwr-Security
|
$180.97
|
+0.50
0.28% |
$181.56
|
27,494
8.02% of 50 DAV
50 DAV is 343,000
|
$183.49
-1.37%
|
11/3/2023
|
$167.50
|
PP = $165.03
|
|
MB = $173.28
|
Most Recent Note - 11/22/2023 5:06:23 PM
G - There was a "negative reversal" today after hitting another new all-time high and it closed near the session low. Prior high ($165) defines initial support to watch on pullbacks.
>>> FEATURED STOCK ARTICLE : Powerful Breakout for Qualys - 11/3/2023 |
View all notes |
Set NEW NOTE alert |
Company Profile |
SEC
News |
Chart |
Request a new note
C
A
S
I |
AXON
-
NASDAQ
Axon Enterprise
Security/Sfty
|
$228.64
|
+0.22
0.10% |
$229.68
|
31,084
6.64% of 50 DAV
50 DAV is 468,000
|
$231.71
-1.32%
|
11/8/2023
|
$127.84
|
PP = $223.30
|
|
MB = $234.47
|
Most Recent Note - 11/22/2023 5:02:36 PM
Y - Paused today following 4 consecutive small gains backed by light volume as it inched back above the pivot point. More damaging losses below the recent low ($212.89 on 11/09/23) would raise greater concerns.
>>> FEATURED STOCK ARTICLE : Breakout for Axon as it Returns to Featured Stocks List - 11/8/2023 |
View all notes |
Set NEW NOTE alert |
Company Profile |
SEC
News |
Chart |
Request a new note
C
A
S
I |
TDG
-
NYSE
TransDigm Group
Aerospace/Defense
|
$974.08
|
+3.35
0.35% |
$975.50
|
13,661
5.34% of 50 DAV
50 DAV is 256,000
|
$1,013.08
-3.85%
|
11/9/2023
|
$982.68
|
PP = $940.10
|
|
MB = $987.11
|
Most Recent Note - 11/22/2023 5:07:01 PM
G - It stalled after briefly trading above the $1,000 threshold last week. Fundamentals remain strong. Prior high ($940) defines initial support to watch on pullbacks.
>>> FEATURED STOCK ARTICLE : TransDigm's Big Gap Up Gain Triggered Technical Buy Signal - 11/9/2023 |
View all notes |
Set NEW NOTE alert |
Company Profile |
SEC
News |
Chart |
Request a new note
C
A
S
I |
Symbol/Exchange
Company Name
Industry Group |
PRICE |
CHANGE
(%Change) |
Day High |
Volume
(% DAV)
(% 50 day avg vol) |
52 Wk Hi
% From Hi |
Featured
Date |
Price
Featured |
Pivot Featured |
|
Max Buy |
PANW
-
NASDAQ
Palo Alto Networks
Computer Sftwr-Security
|
$266.70
|
+0.62
0.23% |
$268.07
|
477,076
13.16% of 50 DAV
50 DAV is 3,626,000
|
$268.10
-0.52%
|
11/13/2023
|
$255.90
|
PP = $266.00
|
|
MB = $279.30
|
Most Recent Note - 11/22/2023 5:05:01 PM
Y - There was a "negative reversal" today after touching a new all-time high following 3 consecutive gains. Subsequent gains above the pivot point backed by at least +40% above average volume may trigger a technical buy signal. Recovered quickly above its 50 DMA line after testing the prior low ($233.81 on 11/06/23) last week. Fundamentals remain strong after it reported Oct '23 quarterly earnings +66% on +20% sales revenues versus the year-ago period.
>>> FEATURED STOCK ARTICLE : Earnings New Due While Perched Near Prior High - 11/13/2023 |
View all notes |
Set NEW NOTE alert |
Company Profile |
SEC
News |
Chart |
Request a new note
C
A
S
I |
|
|
|
THESE ARE NOT BUY RECOMMENDATIONS!
Comments contained in the body of this report are technical
opinions only. The material herein has been obtained
from sources believed to be reliable and accurate, however,
its accuracy and completeness cannot be guaranteed.
This site is not an investment advisor, hence it does
not endorse or recommend any securities or other investments.
Any recommendation contained in this report may not
be suitable for all investors and it is not to be deemed
an offer or solicitation on our part with respect to
the purchase or sale of any securities. All trademarks,
service marks and trade names appearing in this report
are the property of their respective owners, and are
likewise used for identification purposes only.
This report is a service available
only to active Paid Premium Members.
You may opt-out of receiving report notifications
at any time. Questions or comments may be submitted
by writing to Premium Membership Services 665 S.E. 10 Street, Suite 201 Deerfield Beach, FL 33441-5634 or by calling 1-800-965-8307
or 954-785-1121.
|
|
|