You are not logged in.
This means you
CAN ONLY VIEW reports that were published prior to Friday, April 18, 2025.
You
MUST UPGRADE YOUR MEMBERSHIP if you want to see any current reports.
AFTER MARKET UPDATE - THURSDAY, SEPTEMBER 17TH, 2015
Previous After Market Report Next After Market Report >>>
|
|
|
|
DOW |
-65.21 |
16,674.74 |
-0.39% |
|
Volume |
978,130,910 |
+13% |
|
Volume |
1,732,038,690 |
+13% |
|
NASDAQ |
+4.71 |
4,893.95 |
+0.10% |
|
Advancers |
1,884 |
61% |
|
Advancers |
1,615 |
56% |
|
S&P 500 |
-5.11 |
1,990.20 |
-0.26% |
|
Decliners |
1,205 |
39% |
|
Decliners |
1,257 |
44% |
|
Russell 2000 |
+5.49 |
1,180.69 |
+0.47% |
|
52 Wk Highs |
46 |
|
|
52 Wk Highs |
67 |
|
|
S&P 600 |
+1.13 |
682.98 |
+0.17% |
|
52 Wk Lows |
32 |
|
|
52 Wk Lows |
31 |
|
|
 |
Leadership Improved While Major Indices Ended Mixed
Kenneth J. Gruneisen - Passed the CAN SLIM® Master's Exam
Stocks finished mixed on Thursday. The Dow lost 5 points to 16674. The S&P 500 was slipped 5 points to 1990. The NASDAQ climbed 4 points to 4893. The volume totals were reported higher than the prior session totals on the NYSE and on the Nasdaq exchange. Breadth was positive as advancers led decliners by a 3-2 margin on the NYSE and by 4-3 on the Nasdaq exchange. Leadership improved as there were 27 stocks that made it onto the BreakOuts Page, up from 15 high-ranked companies from the Leaders List that made a new 52-week high on the prior session. The total number of new 52-week highs improved and outnumbered new 52-week lows on the NYSE and on the Nasdaq exchange. There were gains for 2 of the 5 high-ranked companies currently on the Featured Stocks Page.
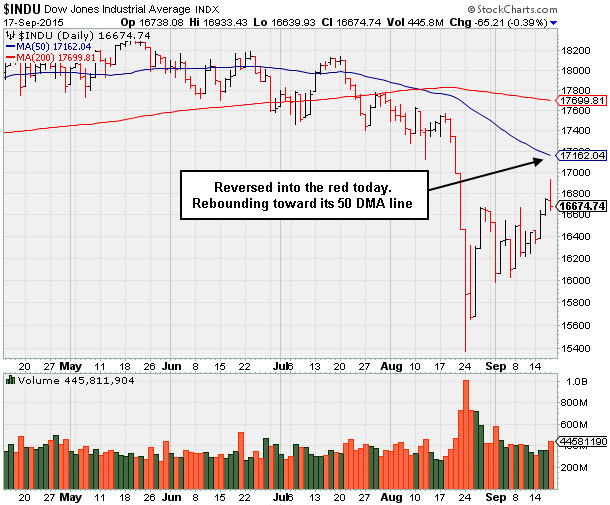
PICTURED: The Dow Jones Industrial Average reversed into the red today for a loss on higher volume. It faces near-term resistance at its prior lows and its 50-day moving average line. Repeatedly, members have been reminded that at least 2 of the 3 major indices should be trading above their respective 200-day moving average (DMA) lines in order for a market environment to be considered technically "healthy". A lot of recovery work must be done to get the indices back into healthy shape, and that improvement could require some considerable time and patience.
New buying efforts may only be considered in stocks meeting all key criteria of the fact-based investment system. Disciplined investors always limit losses by selling any stock that falls more than -7% from their purchase price.
The major averages retreated somewhat after the Federal Reserve decided to leave interest rates unchanged in their September FOMC meeting. Fed Chairman Janet Yellen cited a lack of inflation and international uncertainty as the reasons for delaying a rate hike. In other economic news, housing numbers were mixed, initial jobs claims were lower and the Philly Fed business outlook gauge disappointed.
Six out of the ten sectors in the S&P 500 declined on the session. Inaction from the Fed sent financials lower while utilities stocks were the relative outperformer.
M&A was back on the scene as Cablevision (CVC +13.91%) rose after agreeing to a $17.7 billion offer from Atlice. In earnings, Oracle (ORCL -4.00%) fell after missing revenue projections and guiding lower. Rite Aid (RAD -10.83%) fell after missing profit estimates and trimming guidance.
Treasuries moved firmly higher after the Fed announcement. The benchmark U.S. 10-year note was up 28/32 to yield 2.19% while the 30-year bond climbed 1 & 12/32 to yield 3.01%
Commodities were mostly lower. WTI crude slid 0.3% to $46.84/barrel. COMEX gold rebounded to gain 1.1% to $1130.80/ounce. In FOREX, the dollar index sold off after the Fed news, losing over 1% with weakness against the yen and euro.
The number of stocks listed to the Featured Stocks Page waned during deteriorating market conditions. The most current notes with headline links help members have access to more detailed letter-by-letter analysis including price/volume graphs annotated by our experts. See the Premium Member Homepage for archives to all prior pay reports.
|
 Kenneth J. Gruneisen started out as a licensed stockbroker in August 1987, a couple of months prior to the historic stock market crash that took the Dow Jones Industrial Average down -22.6% in a single day. He has published daily fact-based fundamental and technical analysis on high-ranked stocks online for two decades. Through FACTBASEDINVESTING.COM, Kenneth provides educational articles, news, market commentary, and other information regarding proven investment systems that work in good times and bad.
Comments contained in the body of this report are technical opinions only and are not necessarily those of Gruneisen Growth Corp. The material herein has been obtained from sources believed to be reliable and accurate, however, its accuracy and completeness cannot be guaranteed. Our firm, employees, and customers may effect transactions, including transactions contrary to any recommendation herein, or have positions in the securities mentioned herein or options with respect thereto. Any recommendation contained in this report may not be suitable for all investors and it is not to be deemed an offer or solicitation on our part with respect to the purchase or sale of any securities. |
|
 |
Financials Fell and Gold & Silver Index Rose
Kenneth J. Gruneisen - Passed the CAN SLIM® Master's Exam
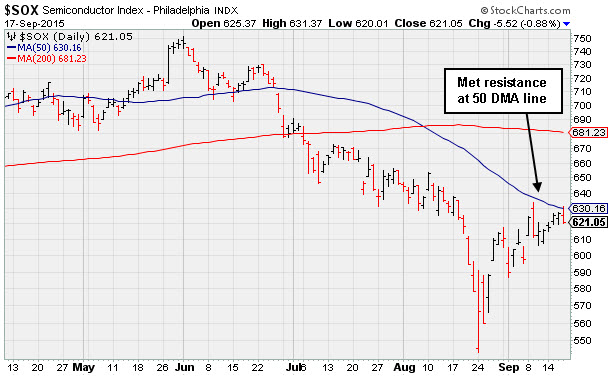
The Gold & Silver Index ($XAU +2.45%) was a standout gainer. Financial shares had a negative influence on the major averages on Thursday as the Broker/Dealer Index ($XBD -1.67%) and the Bank Index ($BKX -2.29%) both lost ground. The Oil Services Index ($OSX -0.60%) suffered a small loss and the Integrated Oil Index ($XOI -0.01%) finished flat, The Retail Index ($RLX +0.45%) rose. The tech sector was mixed as the Networking Index ($NWX +0.04%) finished flat the Semiconductor Index ($SOX -0.88%) fell and the Biotechnology Index ($BTK +1.80%) posted a solid gain.
PICTURED: The Semiconductor Index ($SOX -0.88%) met resistance at its 50-day moving average (DMA) line recently. Subsequent gains above that important short-term average would be a reassuring sign for the tech sector.
| Oil Services |
$OSX |
176.98 |
-1.06 |
-0.60% |
-16.07% |
| Integrated Oil |
$XOI |
1,114.19 |
-0.10 |
-0.01% |
-17.35% |
| Semiconductor |
$SOX |
621.05 |
-5.52 |
-0.88% |
-9.58% |
| Networking |
$NWX |
372.22 |
+0.14 |
+0.04% |
+3.99% |
| Broker/Dealer |
$XBD |
173.24 |
-2.94 |
-1.67% |
-6.17% |
| Retail |
$RLX |
1,215.51 |
+5.52 |
+0.46% |
+17.70% |
| Gold & Silver |
$XAU |
48.47 |
+1.16 |
+2.45% |
-29.53% |
| Bank |
$BKX |
71.20 |
-1.67 |
-2.29% |
-4.12% |
| Biotech |
$BTK |
4,065.43 |
+71.96 |
+1.80% |
+18.21% |
|
|
|
 |
Review a Previously Featured Stock Now Facing Overhead Supply
Kenneth J. Gruneisen - Passed the CAN SLIM® Master's Exam
Leadership has improved. However, very few stocks are currently included on the Featured Stocks list, and none of the companies listed are in great need of additional review in detail with new annotated graphs. At times like these we have an opportunity in this Featured Stock Update section to look back and review previously featured stocks which were dropped. They can serve as great educational examples of the investment system's tactics. They also serve as vivid reminders that high-ranked leaders eventually do fall out of favor, so it is critical for investors to recognize sell signals and react properly. If you wish to request for a specific stock to receive more detailed coverage in this section please use the inquiry form to submit your request. Thank you!
Skyworks Solutions Inc (SWKS) was first featured highlighted in yellow in the May 1, 2015 mid-day report (read here). Subsequent gains into new high territory were noted for falling below the minimum volume guideline to trigger a proper technical buy signal under the fact-based investment system's guidelines. It made limited headway in the weeks that followed. Poor action in early July raised concerns and it was noted as it triggered technical sell signals and dropped from the Featured Stocks list on 7/09/15. Then, its 50-day moving average (DMA) line acted as a resistance level while trying to rebound. Ultimately, more worrisome action was noted as it violated the prior lows. It even slumped below its 200 DMA line during a very weak market environment (M criteria).
Recently it has been trying to rebound above the 50 and 200 DMA lines which have nearly converged. However, the overhead supply created by several months of trading at higher prices is likely to be a hindrance that prevents SWKS from being a standout gainer in the coming weeks. Historic studies have proven that during market rallies stocks without overhead supply are more likely to be the best gainers.
Below is a list of the notes made in the past concerning SWKS:
7/24/2015 1:07:17 PM - Gapped up today but reversed into the red, and it is still meeting resistance at its 50 DMA line when trying to rebound. Gains above the 50 DMA line are needed for its outlook to improve, and it faces resistance due to overhead supply up through the $112 area. Reported earnings +61% on +38% sales revenues for the Jun '15 quarter, continuing its record of strong earnings increases above the +25% minimum guideline (C criteria). Halted its slide after damaging volume-driven losses were noted as they triggered technical sell signals and on 7/09/15 it was dropped from the Featured Stocks list.
7/22/2015 1:10:47 PM - A rebound above its 50 DMA line is needed to help its outlook improve. Due to report earnings on 7/23/15, and volume and volatility often increase near earnings news. Gapped down today, slumping after meeting resistance at its 50 DMA line when recently trying to rebound. Damaging volume-driven losses were noted as they triggered technical sell signals and on 7/09/15 it was dropped from the Featured Stocks list.
7/9/2015 6:23:03 PM - Suffered a 3rd consecutive loss today marked by above average volume as it slumped further below its 50 DMA line. Damaging volume-driven losses were noted as they triggered technical sell signals and it will be dropped from the Featured Stocks list tonight..
7/8/2015 8:39:17 PM - G - Color code is changed to green after violating its 50 DMA line and undercutting prior lows with damaging volume-driven losses triggering a technical a sell signal.
|
|
|
Color Codes Explained :
Y - Better candidates highlighted by our
staff of experts.
G - Previously featured
in past reports as yellow but may no longer be buyable under the
guidelines.
***Last / Change / Volume data in this table is the closing quote data***
Symbol/Exchange
Company Name
Industry Group |
PRICE |
CHANGE
(%Change) |
Day High |
Volume
(% DAV)
(% 50 day avg vol) |
52 Wk Hi
% From Hi |
Featured
Date |
Price
Featured |
Pivot Featured |
|
Max Buy |
BOFI
-
NASDAQ
B O F I Holding Inc
BANKING - Savings andamp; Loans
|
$122.24
|
-0.84
-0.68% |
$125.00
|
267,443
89.75% of 50 DAV
50 DAV is 298,000
|
$134.79
-9.31%
|
6/10/2015
|
$101.47
|
PP = $97.78
|
|
MB = $102.67
|
Most Recent Note - 9/14/2015 5:37:59 PM
G - Quietly rebounded above its 50 DMA line helping its outlook to improve, however it has not formed a sound base.
>>> FEATURED STOCK ARTICLE : Quiet Gain to Finish Above 50 Day Moving Average - 9/11/2015 |
View all notes |
Set NEW NOTE alert |
Company Profile |
SEC
News |
Chart |
Request a new note
C
A
S
I |
AHS
-
NYSE
A M N Healthcare Svcs
DIVERSIFIED SERVICES - Staffing and Outsourcing Service
|
$35.81
|
+0.51
1.44% |
$36.29
|
782,772
112.63% of 50 DAV
50 DAV is 695,000
|
$37.25
-3.87%
|
8/5/2015
|
$34.50
|
PP = $32.53
|
|
MB = $34.16
|
Most Recent Note - 9/14/2015 5:36:27 PM
G - Still perched within striking distance of its 52-week high, consolidating above its 50 DMA line and prior highs defining important near term support. See the latest FSU analysis for more details and a new annotated graph.
>>> FEATURED STOCK ARTICLE : Found Support Above 50-Day Moving Average - 9/14/2015 |
View all notes |
Set NEW NOTE alert |
Company Profile |
SEC
News |
Chart |
Request a new note
C
A
S
I |
ULTA
-
NASDAQ
Ulta Salon Cosm & Frag
SPECIALTY RETAIL - Specialty Retail, Other
|
$168.14
|
+3.42
2.08% |
$169.25
|
1,040,525
110.46% of 50 DAV
50 DAV is 942,000
|
$176.77
-4.88%
|
5/29/2015
|
$155.03
|
PP = $159.95
|
|
MB = $167.95
|
Most Recent Note - 9/15/2015 5:40:10 PM
G - Posted a gain on light volume today while trading near its 50 DMA line ($164.75). It has not formed a sound base following the deep shakeout on 8/24/15.
>>> FEATURED STOCK ARTICLE : Rebound Near 50-Day Moving Average Following Deep Shakeout - 9/10/2015 |
View all notes |
Set NEW NOTE alert |
Company Profile |
SEC
News |
Chart |
Request a new note
C
A
S
I |
LXFT
-
NYSE
Luxoft Holding Inc Cl A
Comp Sftwr-Spec Enterprs
|
$66.76
|
-1.66
-2.43% |
$68.85
|
324,711
128.34% of 50 DAV
50 DAV is 253,000
|
$68.52
-2.56%
|
5/26/2015
|
$51.90
|
PP = $57.40
|
|
MB = $60.27
|
Most Recent Note - 9/16/2015 5:57:55 PM
G - Hit a new high today and no resistance remains due to overhead supply. It did not form a sound base but it found prompt support after violating its 50 DMA line.
>>> FEATURED STOCK ARTICLE : Quiet Gain For Second Best Close Ever - 9/15/2015 |
View all notes |
Set NEW NOTE alert |
Company Profile |
SEC
News |
Chart |
Request a new note
C
A
S
I |
INGN
-
NASDAQ
Inogen Inc
HEALTH SERVICES - Medical Instruments and Supplies
|
$54.81
|
-0.04
-0.07% |
$55.48
|
279,761
104.00% of 50 DAV
50 DAV is 269,000
|
$55.98
-2.09%
|
8/12/2015
|
$49.01
|
PP = $45.85
|
|
MB = $48.14
|
Most Recent Note - 9/16/2015 5:55:55 PM
G - Finished at a best-ever close with lighter volume behind today's gain, getting more extended from its prior base. Its 50 DMA line and prior highs define near-term support to watch on pullbacks. See the latest FSU analysis for more details and a new annotated graph.
>>> FEATURED STOCK ARTICLE : Another New High Close For Medical Products Firm - 9/16/2015 |
View all notes |
Set NEW NOTE alert |
Company Profile |
SEC
News |
Chart |
Request a new note
C
A
S
I |
Symbol/Exchange
Company Name
Industry Group |
PRICE |
CHANGE
(%Change) |
Day High |
Volume
(% DAV)
(% 50 day avg vol) |
52 Wk Hi
% From Hi |
Featured
Date |
Price
Featured |
Pivot Featured |
|
Max Buy |
|
|
|
THESE ARE NOT BUY RECOMMENDATIONS!
Comments contained in the body of this report are technical
opinions only. The material herein has been obtained
from sources believed to be reliable and accurate, however,
its accuracy and completeness cannot be guaranteed.
This site is not an investment advisor, hence it does
not endorse or recommend any securities or other investments.
Any recommendation contained in this report may not
be suitable for all investors and it is not to be deemed
an offer or solicitation on our part with respect to
the purchase or sale of any securities. All trademarks,
service marks and trade names appearing in this report
are the property of their respective owners, and are
likewise used for identification purposes only.
This report is a service available
only to active Paid Premium Members.
You may opt-out of receiving report notifications
at any time. Questions or comments may be submitted
by writing to Premium Membership Services 665 S.E. 10 Street, Suite 201 Deerfield Beach, FL 33441-5634 or by calling 1-800-965-8307
or 954-785-1121.
|
|
|