You are not logged in.
This means you
CAN ONLY VIEW reports that were published prior to Friday, April 4, 2025.
You
MUST UPGRADE YOUR MEMBERSHIP if you want to see any current reports.
AFTER MARKET UPDATE - THURSDAY, SEPTEMBER 3RD, 2015
Previous After Market Report Next After Market Report >>>
|
|
|
|
DOW |
+23.38 |
16,374.76 |
+0.14% |
|
Volume |
865,693,340 |
-17% |
|
Volume |
1,663,254,770 |
-7% |
|
NASDAQ |
-16.48 |
4,733.50 |
-0.35% |
|
Advancers |
1,985 |
65% |
|
Advancers |
1,485 |
52% |
|
S&P 500 |
+2.27 |
1,951.13 |
+0.12% |
|
Decliners |
1,077 |
35% |
|
Decliners |
1,377 |
48% |
|
Russell 2000 |
-0.87 |
1,145.15 |
-0.08% |
|
52 Wk Highs |
8 |
|
|
52 Wk Highs |
27 |
|
|
S&P 600 |
+1.43 |
666.77 |
+0.21% |
|
52 Wk Lows |
30 |
|
|
52 Wk Lows |
36 |
|
|
 |
Indices Ended Mixed After Early Gains Faded
Kenneth J. Gruneisen - Passed the CAN SLIM® Master's Exam
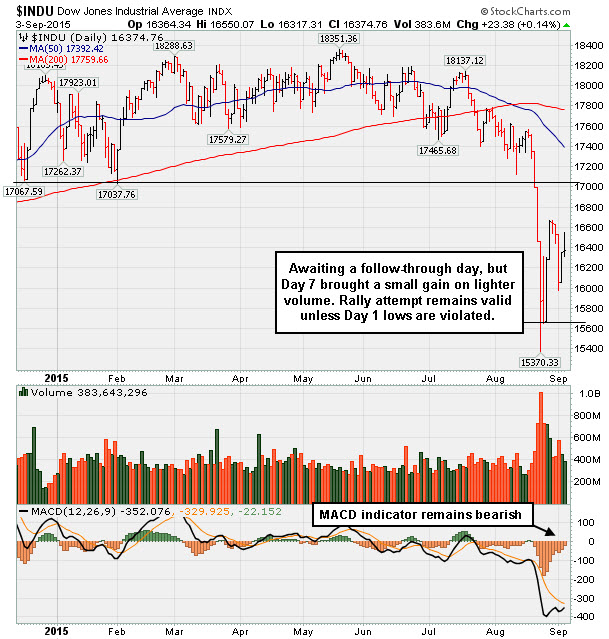
Stocks were mixed on Thursday. The Dow was up 23 points to 16374. The S&P 500 advanced 2 points to 1951. The NASDAQ ebbed 16 points to 4733. The volume totals were reported lighter than the prior session on the NYSE and on the Nasdaq exchange. Breadth was positive as advancers led decliners by nearly a 2-1 margin on the NYSE, but advancers only led decliners by a very narrow margin on the Nasdaq exchange. Leadership remained thin as there were only 6 stocks that made it onto the BreakOuts Page, up from 3 high-ranked companies from the Leaders List that made a new 52-week high on the prior session. There were gains for all of the 5 high-ranked companies currently on the Featured Stocks Page, a list that was trimmed during recent weakness. The total number of new 52-week lows still outnumbered new 52-week highs on both exchanges.PICTURED: The Dow Jones Industrial Average remains below its 50-day and 200-day moving average (DMA) lines which recently crossed, and both averages are now sloping downward. The MACD indicator remains bearish. Thursday's session marked Day 7 of a new rally attempt. Provided that the Day 1 session lows are not violated, investors may be looking for a valid follow-through day to possibly signal a new "confirmed rally" at some point. Follow-through days require at least one of the major averages to post a solid gain of +1.4% or more on higher volume, and the gain must be coupled with an expansion in leadership (stocks hitting new 52-week highs).
Keep in mind, for a market environment to be considered technically "healthy" at least 2 of the 3 major indices should be trading above their respective 200-day moving average (DMA) lines. The market correction (M criteria) grew worrisome as all of the major indices dove below their respective 200-day moving average (DMA) lines. A lot of recovery work must be done to get the indices back into "healthy" shape, and that improvement could require some considerable time and patience.
Disciplined investors always limit losses by selling any stock that falls more than -7% from their purchase price. This is precisely how the fact-based investment system prompts investors to reduce exposure in weak markets, preserving cash until another confirmed rally marked by solid leadership.
U.S. equities pared earlier gains ahead of Friday’s highly-anticipated non-farm payroll release. The report marks the last major data point ahead of the Fed’s September interest rate decision. International uncertainty was muted as Chinese markets were closed for a WWII observance. Shares in Europe spiked after ECB President Mario Draghi announced an expanded quantitative easing program. On our shores, Markit PMI data showed better-than-expected growth in the services sector. In earnings news, Campbell Soup Co (CPB +1.59%) was higher after matching analyst estimates. Joy Global (JOY -14.60%) fell after disappointing revenue numbers and muted forward guidance. Five Below (FIVE -9.26%) retreated after lackluster comp growth. Eight of the ten sectors in the S&P 500 finished higher on the session. Telecom and consumer staples were the best-performing sectors. Frontier Communications (FTR +5.95%) was higher after positive analyst comments. Healthcare stocks were once again the relative underperformer. Treasuries experienced mild strength. The benchmark 10-year note finished up 06/32 to yield 2.16%. Commodities were mixed. NYMEX WTI crude climbed 1.4% to $46.88/barrel. COMEX gold was off 0.8% to $1124.10/ounce. In FOREX, the dollar index moved 0.5% higher with strength against the euro. The number of stocks currently listed to the Featured Stocks Page has waned based on deteriorating market conditions. The most current notes with headline links help members have access to more detailed letter-by-letter analysis including price/volume graphs annotated by our experts. See the Premium Member Homepage for archives to all prior pay reports.
|
 Kenneth J. Gruneisen started out as a licensed stockbroker in August 1987, a couple of months prior to the historic stock market crash that took the Dow Jones Industrial Average down -22.6% in a single day. He has published daily fact-based fundamental and technical analysis on high-ranked stocks online for two decades. Through FACTBASEDINVESTING.COM, Kenneth provides educational articles, news, market commentary, and other information regarding proven investment systems that work in good times and bad.
Comments contained in the body of this report are technical opinions only and are not necessarily those of Gruneisen Growth Corp. The material herein has been obtained from sources believed to be reliable and accurate, however, its accuracy and completeness cannot be guaranteed. Our firm, employees, and customers may effect transactions, including transactions contrary to any recommendation herein, or have positions in the securities mentioned herein or options with respect thereto. Any recommendation contained in this report may not be suitable for all investors and it is not to be deemed an offer or solicitation on our part with respect to the purchase or sale of any securities. |
|
 |
Bank, Networking, Semiconductor. and Oil Services Indexes Rose
Kenneth J. Gruneisen - Passed the CAN SLIM® Master's Exam
The Retail Index ($RLX -0.27%) and the Broker/Dealer Index ($XBD -0.21%) were negative influences on the major averages while the Bank Index ($BKX +0.88%) worked to offset the weakness. While the Semiconductor Index ($SOX +0.80%) and the Networking Index ($NWX +0.60%) both posted modest gains the Biotechnology Index ($BTK -1.85%) slumped and created a drag on the tech sector. The Oil Services Index ($OSX +1.16%) posted a decent gain and the Integrated Oil Index ($XOI +0.12%) inched higher. The Gold & Silver Index ($XAU -1.31%) was a laggard as it slumped again.
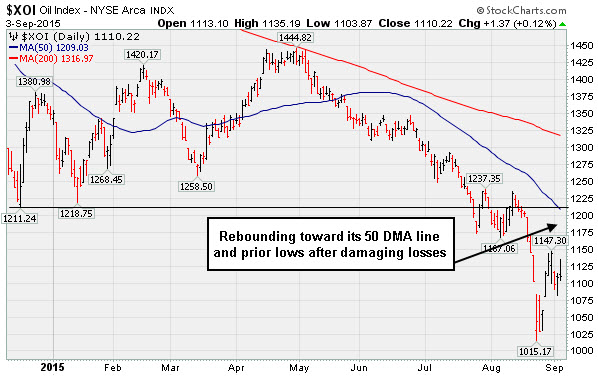
PICTURED: The Integrated Oil Index ($XOI +0.12%) suffered damaging losses in recent months. It has been rebounding toward its 50-day moving average (DMA) line and prior lows.
| Oil Services |
$OSX |
180.06 |
+2.07 |
+1.16% |
-14.61% |
| Integrated Oil |
$XOI |
1,110.22 |
+1.37 |
+0.12% |
-17.65% |
| Semiconductor |
$SOX |
608.58 |
+4.80 |
+0.79% |
-11.40% |
| Networking |
$NWX |
370.86 |
+2.20 |
+0.60% |
+3.61% |
| Broker/Dealer |
$XBD |
172.18 |
-0.36 |
-0.21% |
-6.75% |
| Retail |
$RLX |
1,179.68 |
-3.21 |
-0.27% |
+14.23% |
| Gold & Silver |
$XAU |
45.62 |
-0.61 |
-1.32% |
-33.67% |
| Bank |
$BKX |
71.25 |
+0.62 |
+0.88% |
-4.05% |
| Biotech |
$BTK |
3,757.06 |
-70.88 |
-1.85% |
+9.25% |
|
|
|
 |
Review of Ambarella's Rally and Technical Breakdown
Kenneth J. Gruneisen - Passed the CAN SLIM® Master's Exam
Market conditions (the M criteria) are challenging at times. There are few stocks included on the Featured Stocks list and none of the companies need additional review in detail with annotated graphs. At times like these we have an opportunity to look back and review. Previously featured stocks which were dropped can serve as educational examples of the investment system's tactics. It is also a reminder that high-ranked leaders eventually fall out of favor. If you wish to request for a specific stock to receive more detailed coverage in this section please use the inquiry form to submit your request. Thank you!
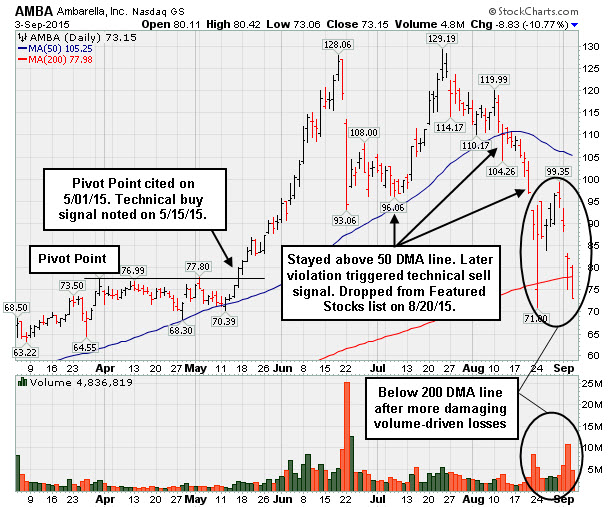
Ambarella Corporation (AMBA -$8.83 or -10.77% to $73.15) has suffered damaging losses with above average volume since dropped from the Featured Stocks list 2 weeks ago. For investors with problems recognizing technical sell signals, this may be a good time to review how it ended up in such bad shape. It had tallied gains of +66% within a month of the technical breakout members saw highlighted in mid-May. Among the factors which contributed to the stock's great volatility was its small supply of only 31.3 million shares (S criteria) outstanding, giving ivestors all the more reason for disciplined entries and exits. Keep in mind, the fact-based investment system discourages speculating on stocks that are badly beaten down in price, which applies in this case now.
While basing, on 5/01/15 a new pivot point was cited based on its 3/31/15 high plus 10 cents. Members were reminded that volume-driven gains above the pivot point cited were still needed to trigger a new (or add-on) technical buy signal. Then, on 5/15/2015 it was noted - "Today's big gain above its pivot point backed by +73% above average volume triggered a new (or add-on) technical buy signal. Finished near the session high and no overhead supply remains to act as resistance."
After an impressive rally it suffered a sharp pullback. It was noted 6/22/2015 11:29:55 AM - "Abruptly retreating for a 2nd consecutive loss with heavy volume. This is why members were reminded to avoid buying stocks that are very extended from a sound base pattern. While it may go on to produce more climatic gains, when a previously strong leader suffers its largest loss on the highest volume it has seen throughout its advance, such negative action may be considered a technical sell signal.
AMBA managed a remarkable rebound in the following weeks, but it barely made it to a new 52-week high before stalling again. Members were cautioned on 8/11/2015 3:07:31 PM - "Slumping near prior lows and its 50 DMA line defining important support in the $109-110 area. Damaging losses leading to violations would trigger technical sell signals."
It remained included on the Featured Stocks list, but members were cautioned once again on 8/18/2015 1:51:36 PM - "Still sputtering below its 50 DMA line. Outlook gets worse the longer it lingers below that important short-term average. Damaging losses below recent lows ($104.26 on 8/12/15) would raise greater concerns and trigger a more worrisome technical sell signal."
And after additional damage it was given a final note on 8/20/2015 3:51:13 PM "Slumping further below its 50 DMA line and near prior lows in the $93 area defining the next important support level. Only a rebound above its 50 DMA line would help its outlook. Will be dropped from the Featured Stocks list tonight due to technical deterioration."
|
|
|
Color Codes Explained :
Y - Better candidates highlighted by our
staff of experts.
G - Previously featured
in past reports as yellow but may no longer be buyable under the
guidelines.
***Last / Change / Volume data in this table is the closing quote data***
Symbol/Exchange
Company Name
Industry Group |
PRICE |
CHANGE
(%Change) |
Day High |
Volume
(% DAV)
(% 50 day avg vol) |
52 Wk Hi
% From Hi |
Featured
Date |
Price
Featured |
Pivot Featured |
|
Max Buy |
BOFI
-
NASDAQ
B O F I Holding Inc
BANKING - Savings andamp; Loans
|
$108.84
|
+1.07
0.99% |
$110.95
|
514,834
180.01% of 50 DAV
50 DAV is 286,000
|
$134.79
-19.25%
|
6/10/2015
|
$101.47
|
PP = $97.78
|
|
MB = $102.67
|
Most Recent Note - 9/2/2015 7:20:31 PM
G - Down again today with above average volume. Violated its 50 DMA line triggering a technical sell signal during its streak of damaging volume-driven losses. A prompt rebound above the 50 DMA line is needed for its outlook to improve. See the latest FSU analysis for more details and a new annotated graph.
>>> FEATURED STOCK ARTICLE : Damaging Losses Triggered Technical Sell Signal - 9/2/2015 |
View all notes |
Set NEW NOTE alert |
Company Profile |
SEC
News |
Chart |
Request a new note
C
A
S
I |
AHS
-
NYSE
A M N Healthcare Svcs
DIVERSIFIED SERVICES - Staffing and Outsourcing Service
|
$34.24
|
+0.42
1.24% |
$34.58
|
659,693
85.56% of 50 DAV
50 DAV is 771,000
|
$37.25
-8.08%
|
8/5/2015
|
$34.50
|
PP = $32.53
|
|
MB = $34.16
|
Most Recent Note - 9/1/2015 12:31:42 PM
G - Pulling back near its 50 DMA line ($32.09) with today's 3rd consecutive loss. More damaging losses would raise greater concerns, especially if slumping to a close back in the prior base.
>>> FEATURED STOCK ARTICLE : Testing Support Amid Broad Market Weakness - 8/25/2015 |
View all notes |
Set NEW NOTE alert |
Company Profile |
SEC
News |
Chart |
Request a new note
C
A
S
I |
ULTA
-
NASDAQ
Ulta Salon Cosm & Frag
SPECIALTY RETAIL - Specialty Retail, Other
|
$158.93
|
+0.42
0.26% |
$160.87
|
948,771
103.02% of 50 DAV
50 DAV is 921,000
|
$176.77
-10.09%
|
5/29/2015
|
$155.03
|
PP = $159.95
|
|
MB = $167.95
|
Most Recent Note - 9/1/2015 1:41:42 PM
G - Still sputtering below its 50 DMA line ($163.59) which recently acted as resistance. A rebound above the 50 DMA line is needed for its outlook to improve. Found prompt support after undercutting its 200 DMA line on 8/24/15 amid broad market (M criteria) weakness.
>>> FEATURED STOCK ARTICLE : Needs Rebound Above 50-Day Average For Outlook to Improve - 9/1/2015 |
View all notes |
Set NEW NOTE alert |
Company Profile |
SEC
News |
Chart |
Request a new note
C
A
S
I |
LXFT
-
NYSE
Luxoft Holding Inc Cl A
Comp Sftwr-Spec Enterprs
|
$62.89
|
+1.40
2.28% |
$63.15
|
255,378
90.56% of 50 DAV
50 DAV is 282,000
|
$68.16
-7.73%
|
5/26/2015
|
$51.90
|
PP = $57.40
|
|
MB = $60.27
|
 Most Recent Note - 9/3/2015 3:57:03 PM
G - Found prompt support near its 50 DMA line ($61.09). More damaging losses would raise greater concerns.
>>> FEATURED STOCK ARTICLE : After Shakeout a Prompt Rebound Above 50-Day Moving Average - 8/27/2015 |
View all notes |
Set NEW NOTE alert |
Company Profile |
SEC
News |
Chart |
Request a new note
C
A
S
I |
INGN
-
NASDAQ
Inogen Inc
HEALTH SERVICES - Medical Instruments and Supplies
|
$51.99
|
+1.26
2.48% |
$53.15
|
395,448
143.28% of 50 DAV
50 DAV is 276,000
|
$51.86
0.25%
|
8/12/2015
|
$49.01
|
PP = $45.85
|
|
MB = $48.14
|
Most Recent Note - 9/3/2015 3:53:28 PM
G - Hitting a new high today, getting more extended from its prior base. Disciplined investors avoid chasing stocks more than +5% above prior highs or the pivot point. Found prompt support near its 50 DMA line and prior highs.
>>> FEATURED STOCK ARTICLE : Found Support at 50-day Average Following Breakout - 8/31/2015 |
View all notes |
Set NEW NOTE alert |
Company Profile |
SEC
News |
Chart |
Request a new note
C
A
S
I |
Symbol/Exchange
Company Name
Industry Group |
PRICE |
CHANGE
(%Change) |
Day High |
Volume
(% DAV)
(% 50 day avg vol) |
52 Wk Hi
% From Hi |
Featured
Date |
Price
Featured |
Pivot Featured |
|
Max Buy |
|
|
|
THESE ARE NOT BUY RECOMMENDATIONS!
Comments contained in the body of this report are technical
opinions only. The material herein has been obtained
from sources believed to be reliable and accurate, however,
its accuracy and completeness cannot be guaranteed.
This site is not an investment advisor, hence it does
not endorse or recommend any securities or other investments.
Any recommendation contained in this report may not
be suitable for all investors and it is not to be deemed
an offer or solicitation on our part with respect to
the purchase or sale of any securities. All trademarks,
service marks and trade names appearing in this report
are the property of their respective owners, and are
likewise used for identification purposes only.
This report is a service available
only to active Paid Premium Members.
You may opt-out of receiving report notifications
at any time. Questions or comments may be submitted
by writing to Premium Membership Services 665 S.E. 10 Street, Suite 201 Deerfield Beach, FL 33441-5634 or by calling 1-800-965-8307
or 954-785-1121.
|
|
|