You are not logged in.
This means you
CAN ONLY VIEW reports that were published prior to Monday, March 24, 2025.
You
MUST UPGRADE YOUR MEMBERSHIP if you want to see any current reports.
AFTER MARKET UPDATE - WEDNESDAY, AUGUST 24TH, 2022
Previous After Market Report Next After Market Report >>>
|
|
|
|
DOW |
+59.64 |
32,969.23 |
+0.18% |
|
Volume |
728,587,030 |
-3% |
|
Volume |
3,863,303,300 |
+2% |
|
NASDAQ |
+50.23 |
12,431.53 |
+0.41% |
|
Advancers |
1,946 |
62% |
|
Advancers |
2,637 |
58% |
|
S&P 500 |
+12.04 |
4,140.77 |
+0.29% |
|
Decliners |
1,182 |
38% |
|
Decliners |
1,886 |
42% |
|
Russell 2000 |
+16.14 |
1,935.29 |
+0.84% |
|
52 Wk Highs |
38 |
|
|
52 Wk Highs |
54 |
|
|
S&P 600 |
+3.87 |
1,242.20 |
+0.31% |
|
52 Wk Lows |
75 |
|
|
52 Wk Lows |
144 |
|
|
 |
Major Indices Edged Higher With Better Breadth and Leadership
Kenneth J. Gruneisen - Passed the CAN SLIM® Master's Exam
The S&P 500 rose 0.3%, while the Dow added 59 points. The Nasdaq Composite gained 0.4% amid strength in mega-cap tech shares. The volume totals reported were mixed, lighter than the prior session on the NYSE and higher on the Nasdaq exchange. Breadth was positive as advancers led decliners by more than a 3-2 margin on the NYSE and 5-4 on the Nasdaq exchange. There were 13 high-ranked companies from the Leaders List that hit new 52-week highs and were listed on the BreakOuts Page, versus the total of 8 on the prior session. New 52-week lows totals easily outnumbered new 52-week highs on the NYSE and on the Nasdaq exchange. The market is in a confirmed uptrend (M criteria). Any sustainable rally requires a healthy crop of leading stocks hitting new highs.
Chart courtesy of www.stockcharts.com%20on%20Tuesday.%20Yesterday,%20the%20broad%20benchmark%20eclipsed%20the%204,300%20level%20for%20the%20first%20time%20since%20late%20April.%20The%20Nasdaq%20Composite%20fell%201.3%%20amid%20weakness%20in%20mega-cap%20tech%20shares.%20The%20volume%20totals%20reported%20were%20mixed,%20lighter%20than%20the%20prior%20session%20on%20the%20NYSE%20and%20higher%20on%20the%20Nasdaq%20exchange.%20Decliners%20led%20advancers%20by%20a%204-1%20margin%20on%20the%20NYSE%20ad%20by%20a%203-1%20margin%20on%20the%20Nasdaq%20exchange.%20There%20were%2017%20high-ranked%20companies%20from%20the%20Leaders%20List%20that%20hit%20new%2052-week%20highs%20and%20were%20listed%20on%20the%20BreakOuts%20Page,%20down%20from%20the%20total%20of%2045%20on%20the%20prior%20session.%20New%2052-week%20highs%20outnumbered%20new%2052-week%20lows%20on%20the%20NYSE,%20but%20new%20lows%20outnumbered%20new%20highs%20on%20the%20Nasdaq%20exchange.%20The%20market%20is%20in%20a%20confirmed%20uptrend%20(M%20criteria).%20Any%20sustainable%20rally%20requires%20a%20healthy%20crop%20of%20leading%20stocks%20hitting%20new%20highs,%20so%20the%20recent%20improvement%20in%20leadership%20was%20a%20reassuring%20sign.) 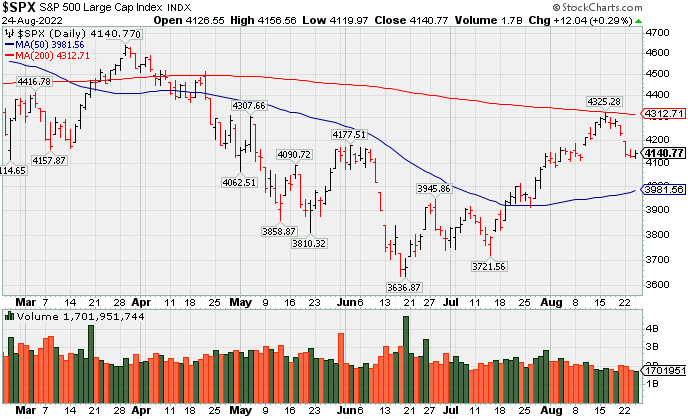 PICTURED: The S&P 500 Index posted a small gain following 3 consecutive losses. It met resistance recently at its downward sloping 200-day moving average (DMA) line.
U.S. stocks finished higher on Wednesday, with the major averages finding their footing following a three-session decline. Still, some cautiousness remained ahead of the Federal Reserve’s (Fed) Jackson Hole central bank forum later this week. Fed Chair Jerome Powell’s speech on Friday will be in the spotlight, with investors bracing for more hawkish remarks that would reiterate the need for additional rate hikes to fight inflation despite weakening economic data. Treasuries retreated, sending yields higher as market participants expect further monetary policy tightening. The yield on the 10-year note advanced five basis points (0.05%) to 3.11%, its highest level in two months.
On the data front, preliminary updates showed durable goods orders were unchanged in July, ending a four-month stretch of gains, while capital goods orders rose 0.4% over the period. Separately, pending home sales slipped 1% during the same month to the lowest level since the onset of the pandemic. In commodities, West Texas Intermediate crude gained 1.6% to $95.24/barrel following a larger-than-forecasted drawdown in weekly domestic stockpiles.
In earnings, Nordstrom Inc. (JWN -19.96%) gapped down after a sharp cut to its full-year guidance as the retailer grapples with elevated inventories and dwindling foot traffic. Elsewhere, Advance Auto Parts Inc. (AAP -9.62%) fell on disappointing results that included a reduction to its own outlook. In other corporate news, Peloton Interactive Inc. (PTON +20.36%) rose on plans to partner with Amazon.com Inc. (AMZN +0.13%) to sell its equipment and apparel on the e-commerce giant’s platform. |
 Kenneth J. Gruneisen started out as a licensed stockbroker in August 1987, a couple of months prior to the historic stock market crash that took the Dow Jones Industrial Average down -22.6% in a single day. He has published daily fact-based fundamental and technical analysis on high-ranked stocks online for two decades. Through FACTBASEDINVESTING.COM, Kenneth provides educational articles, news, market commentary, and other information regarding proven investment systems that work in good times and bad.
Comments contained in the body of this report are technical opinions only and are not necessarily those of Gruneisen Growth Corp. The material herein has been obtained from sources believed to be reliable and accurate, however, its accuracy and completeness cannot be guaranteed. Our firm, employees, and customers may effect transactions, including transactions contrary to any recommendation herein, or have positions in the securities mentioned herein or options with respect thereto. Any recommendation contained in this report may not be suitable for all investors and it is not to be deemed an offer or solicitation on our part with respect to the purchase or sale of any securities. |
|
 |
Biotech, Broker/Dealer, and Commodity-Linked Indexes Led Gainers
Kenneth J. Gruneisen - Passed the CAN SLIM® Master's Exam
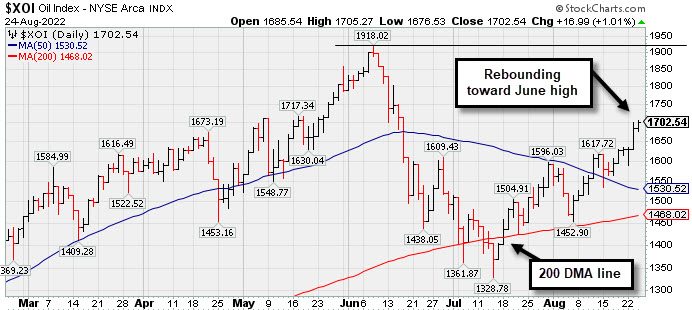
Commodity-linked groups had a positive bias as the Oil Services Index ($OSX +2.46%), Integrated Oil Index ($XOI +1.01%), and Gold & Silver Index ($XAU +1.46%) each posted a solid gain. The Biotech Index ($BTK +1.53%) led the tech sector while the Networking Index ($NWX +0.33%) edged higher but the Semiconductor Index ($SOX +0.07%) finished flat. The Broker/Dealer Index ($XBD +1.00%) posted a modest gain as the Bank Index ($BKX +0.17%) and Retail Index ($RLX +0.15%) both inched higher. PICTURED: The Integrated Oil Index ($XOI +1.01%) has been rebounding toward its June high. It found support near its 200-day moving average (DMA) line.
| Oil Services |
$OSX |
73.06 |
+1.76 |
+2.46% |
+38.58% |
| Integrated Oil |
$XOI |
1,702.54 |
+16.99 |
+1.01% |
+44.50% |
| Semiconductor |
$SOX |
2,866.18 |
+1.87 |
+0.07% |
-27.37% |
| Networking |
$NWX |
824.42 |
+2.75 |
+0.33% |
-15.10% |
| Broker/Dealer |
$XBD |
453.10 |
+4.49 |
+1.00% |
-6.93% |
| Retail |
$RLX |
3,395.15 |
+5.06 |
+0.15% |
-19.67% |
| Gold & Silver |
$XAU |
107.77 |
+1.55 |
+1.46% |
-18.63% |
| Bank |
$BKX |
109.50 |
+0.18 |
+0.17% |
-17.18% |
| Biotech |
$BTK |
4,872.68 |
+73.61 |
+1.53% |
-11.70% |
|
|
|
 |
Failed to Rebound After 50-Day Moving Average Violation
Kenneth J. Gruneisen - Passed the CAN SLIM® Master's Exam
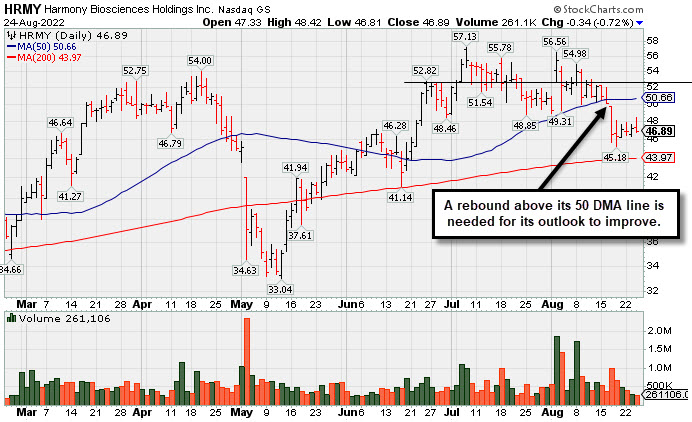
Harmony Biosciences Hldg (HRMY -$0.34 or -0.72% to $46.89) closed near the low of the session with a small loss. Volume totals have cooled after damaging losses, meanwhile it has failed to rebound after violating its 50-day moving average (DMA) line and prior low ($48.85) triggering technical sell signals. It will be dropped from the Featured Stocks list tonight. A rebound above the 50 DMA line ($50.67) is needed for its to outlook improve. It met stubborn resistance in the $57 area.
Jun '22 quarterly earnings rose +54% on +45% sales revenues versus the year ago period and prior quarterly comparisons were strong, well above the +25% minimum earnings guideline (C criteria). It hails from the Medical-Biomed/Biotech industry group, currently ranked 3rd on the 197 Industry Groups list (L criteria). Its annual earnings history (A criteria) is limited. It has an 80 Earnings Per Share Rating.
HRMY completed its $24 IPO on 8/19/20. Its small supply of only 23.7 million shares (S criteria) in the public float can contribute to greater price volatility in the event of institutional buying or selling. The number of top-rated funds owning its shares rose from 208 in Sep '21 to 408 in Jun '22, a reassuring sign concerning the I criteria. Its current Up/Down Volume Ratio of 1.2 is an unbiased indication its shares have been under accumulation over the past 50 days.
|
|
|
Color Codes Explained :
Y - Better candidates highlighted by our
staff of experts.
G - Previously featured
in past reports as yellow but may no longer be buyable under the
guidelines.
***Last / Change / Volume data in this table is the closing quote data***
Symbol/Exchange
Company Name
Industry Group |
PRICE |
CHANGE
(%Change) |
Day High |
Volume
(% DAV)
(% 50 day avg vol) |
52 Wk Hi
% From Hi |
Featured
Date |
Price
Featured |
Pivot Featured |
|
Max Buy |
 IMXI
-
NASDAQ
IMXI
-
NASDAQ
International Money Exp
Financial Svcs-Specialty
|
$24.60
|
+0.01
0.04% |
$24.78
|
324,321
61.54% of 50 DAV
50 DAV is 527,000
|
$26.23
-6.21%
|
7/1/2022
|
$21.27
|
PP = $21.38
|
|
MB = $22.45
|
Most Recent Note - 8/23/2022 5:25:29 PM
G - Down today for 3rd consecutive small loss on lighter volume, retreating from its all-time high. Prior highs in the $22 area and its 50 DMA line ($22.44) define important near-term support to watch. Reported Jun '22 quarterly earnings +21% on +17% sales revenues versus the year ago period, below the +25% minimum earnings guideline (C criteria), raising fundamental concerns. See the latest FSU analysis for more details and a new annotated graph.
>>> FEATURED STOCK ARTICLE : June Quarter Was Below +25% Minimum Earnings Guideline - 8/23/2022 |
View all notes |
Set NEW NOTE alert |
Company Profile |
SEC
News |
Chart |
Request a new note
C
A
S
I |
HRMY
-
NASDAQ
Harmony Biosciences Holdings
Medical-Biomed/Biotech
|
$46.89
|
-0.34
-0.72% |
$48.42
|
261,426
44.00% of 50 DAV
50 DAV is 594,200
|
$57.13
-17.92%
|
7/6/2022
|
$54.12
|
PP = $52.85
|
|
MB = $55.49
|
 Most Recent Note - 8/24/2022 4:48:52 PM
Closed near the low of the session today with a small loss. Volume totals have cooled after damaging losses, meanwhile it has failed to rebound after violating its 50-day moving average (DMA) line and prior low ($48.85) triggering technical sell signals. It will be dropped from the Featured Stocks list tonight. A rebound above the 50 DMA line ($50.67) is needed for its to outlook improve. See the latest FSU analysis for more details and a new annotated graph.
>>> FEATURED STOCK ARTICLE : Failed to Rebound After 50-Day Moving Average Violation - 8/24/2022 |
View all notes |
Set NEW NOTE alert |
Company Profile |
SEC
News |
Chart |
Request a new note
C
A
S
I |
CI
-
NYSE
Cigna Corp
Medical-Managed Care
|
$288.76
|
+2.43
0.85% |
$289.60
|
1,808,305
89.48% of 50 DAV
50 DAV is 2,021,000
|
$293.96
-1.77%
|
7/7/2022
|
$276.55
|
PP = $273.68
|
|
MB = $287.36
|
Most Recent Note - 8/22/2022 6:06:40 PM
G - Volume totals have been cooling while hovering at its all-time high holding its ground after rising above its "max buy" level. Reported earnings for the Jun '22 quarter rose +19% on +5% sales revenues versus the year ago period, breaking a streak of 3 quarterly earnings increases above the +25% minimum guideline (C criteria), raising concerns. Near-term support to watch is at its 50 DMA line ($271.67).
>>> FEATURED STOCK ARTICLE : Wedging Higher With Lighter Volume Behind Gain for New High - 8/9/2022 |
View all notes |
Set NEW NOTE alert |
Company Profile |
SEC
News |
Chart |
Request a new note
C
A
S
I |
AN
-
NYSE
Autonation Inc
SPECIALTY RETAIL - Auto Dealerships
|
$126.08
|
+1.26
1.01% |
$126.29
|
649,505
92.13% of 50 DAV
50 DAV is 705,000
|
$135.57
-7.00%
|
7/20/2022
|
$122.03
|
PP = $126.49
|
|
MB = $132.81
|
Most Recent Note - 8/22/2022 6:08:53 PM
Y - Fell today with near average volume for a 4th consecutive small loss, but raised concerns while undercutting prior highs in the $126 area which were noted as initial support to watch. Faces no resistance due to overhead supply. Reported Jun '22 quarterly earnings +34% on -2% sales revenues versus the year ago period.
>>> FEATURED STOCK ARTICLE : Autonation Hovering Near Stubborn Resistance - 8/11/2022 |
View all notes |
Set NEW NOTE alert |
Company Profile |
SEC
News |
Chart |
Request a new note
C
A
S
I |
ESQ
-
NASDAQ
Esquire Financial Hldgs
Finance-Commercial Loans
|
$38.82
|
-0.25
-0.64% |
$39.03
|
14,541
24.24% of 50 DAV
50 DAV is 60,000
|
$41.68
-6.86%
|
7/26/2022
|
$37.74
|
PP = $39.19
|
|
MB = $41.15
|
Most Recent Note - 8/22/2022 6:03:30 PM
Y - Pulled back today with lighter than average volume. Wedged above resistance in the $39 area with recent gains lacking volume conviction. Confirming gains above the pivot point backed by at least +40% above average volume may help clinch a proper technical buy signal. Its 50 DMA line ($35.74) defines important near-term support.
>>> FEATURED STOCK ARTICLE : Closed at Session High With Gain for New All-Time High - 8/12/2022 |
View all notes |
Set NEW NOTE alert |
Company Profile |
SEC
News |
Chart |
Request a new note
C
A
S
I |
Symbol/Exchange
Company Name
Industry Group |
PRICE |
CHANGE
(%Change) |
Day High |
Volume
(% DAV)
(% 50 day avg vol) |
52 Wk Hi
% From Hi |
Featured
Date |
Price
Featured |
Pivot Featured |
|
Max Buy |
GPK
-
NYSE
Graphic Packaging Hldg
CONSUMER NON-DURABLES - Packaging and Containers
|
$23.28
|
-0.06
-0.26% |
$23.49
|
2,076,139
68.75% of 50 DAV
50 DAV is 3,020,000
|
$23.71
-1.81%
|
7/26/2022
|
$22.63
|
PP = $23.09
|
|
MB = $24.24
|
Most Recent Note - 8/23/2022 5:28:38 PM
Y - Posted a small gain today with light volume. Churned heavy volume but made limited progress since its 8/10/22 breakout, action indicative of distributional pressure.
>>> FEATURED STOCK ARTICLE : Churned Heavy Volume Perched at High After 6 Straight Gains - 8/15/2022 |
View all notes |
Set NEW NOTE alert |
Company Profile |
SEC
News |
Chart |
Request a new note
C
A
S
I |
CSL
-
NYSE
Carlisle Cos Inc
Diversified Operations
|
$309.44
|
+1.96
0.64% |
$310.20
|
407,727
99.69% of 50 DAV
50 DAV is 409,000
|
$318.71
-2.91%
|
7/28/2022
|
$282.31
|
PP = $275.23
|
|
MB = $288.99
|
Most Recent Note - 8/22/2022 6:01:33 PM
G - Pulled back today for a 2nd consecutive loss, retreating from its all-time high after getting very extended from the previously noted base. Prior highs in the $275 area define initial support to watch along with its 50 DMA line ($269). See the latest FSU analysis for more details and a new annotated graph.
>>> FEATURED STOCK ARTICLE : Pulling Back From All-Time High After Volume-Driven Gains - 8/22/2022 |
View all notes |
Set NEW NOTE alert |
Company Profile |
SEC
News |
Chart |
Request a new note
C
A
S
I |
ENPH
-
NASDAQ
Enphase Energy Inc
Energy-Solar
|
$293.09
|
+7.68
2.69% |
$297.65
|
1,983,729
59.15% of 50 DAV
50 DAV is 3,354,000
|
$308.88
-5.11%
|
7/28/2022
|
$276.66
|
PP = $282.55
|
|
MB = $296.68
|
Most Recent Note - 8/24/2022 5:09:56 PM
Y - Posted a 2nd consecutive small gain today with light volume. Hovering near its all-time high in recent weeks with volume totals cooling. The prior high in the $282 area has been noted as initial support to watch on pullbacks. Fundamentals remain strong.
>>> FEATURED STOCK ARTICLE : Enphase Energy Consolidating After Rallying to New Highs - 8/19/2022 |
View all notes |
Set NEW NOTE alert |
Company Profile |
SEC
News |
Chart |
Request a new note
C
A
S
I |
PWR
-
NYSE
Quanta Services Inc
MATERIALS and CONSTRUCTION - General Contractors
|
$145.11
|
+3.89
2.75% |
$145.52
|
727,116
59.89% of 50 DAV
50 DAV is 1,214,000
|
$146.84
-1.18%
|
7/28/2022
|
$141.83
|
PP = $140.14
|
|
MB = $147.15
|
Most Recent Note - 8/24/2022 5:12:25 PM
Y - Posted a small gain today with light volume for its 2nd best ever close. Volume totals have been below average while recently wedging back above its pivot point since encountering some distributional pressure. Confirming volume-driven gains for new highs would be a reassuring sign of serious institutional buying demand. Its 50 DMA line ($132.22) defines important near-term support to watch. Fundamentals remain strong.
>>> FEATURED STOCK ARTICLE : Stalled After Breakout But Still Quietly Hovering Near High - 8/16/2022 |
View all notes |
Set NEW NOTE alert |
Company Profile |
SEC
News |
Chart |
Request a new note
C
A
S
I |
CLFD
-
NASDAQ
Clearfield Inc
TELECOMMUNICATIONS - Cables / Satalite Equipment
|
$127.28
|
+2.06
1.65% |
$128.86
|
263,156
78.09% of 50 DAV
50 DAV is 337,000
|
$126.57
0.56%
|
7/29/2022
|
$94.10
|
PP = $86.81
|
|
MB = $91.15
|
Most Recent Note - 8/23/2022 5:27:41 PM
G - Posted a gain today with average volume for a new all-time high, getting very extended from any sound base. Prior high in the $86 area defines initial support to watch above its 50 DMA line. Fundamentals remain strong.
>>> FEATURED STOCK ARTICLE : Clearfield Showed Resilience After Considerable Rally - 8/17/2022 |
View all notes |
Set NEW NOTE alert |
Company Profile |
SEC
News |
Chart |
Request a new note
C
A
S
I |
Symbol/Exchange
Company Name
Industry Group |
PRICE |
CHANGE
(%Change) |
Day High |
Volume
(% DAV)
(% 50 day avg vol) |
52 Wk Hi
% From Hi |
Featured
Date |
Price
Featured |
Pivot Featured |
|
Max Buy |
GFF
-
NYSE
Griffon Corporation
MATERIALS and CONSTRUCTION - General Building Materials
|
$33.10
|
+0.17
0.52% |
$33.20
|
420,451
91.40% of 50 DAV
50 DAV is 460,000
|
$34.35
-3.64%
|
8/8/2022
|
$32.46
|
PP = $31.12
|
|
MB = $32.68
|
Most Recent Note - 8/22/2022 6:04:21 PM
G - Posted a solid gain today backed by above average volume, hovering near its 52-week high. Prior highs in the $31 area define initial support to watch on pullbacks.
>>> FEATURED STOCK ARTICLE : Breakout for New High Backed by +52% Above Average Volume - 8/8/2022 |
View all notes |
Set NEW NOTE alert |
Company Profile |
SEC
News |
Chart |
Request a new note
C
A
S
I |
CLH
-
NYSE
Clean Harbors Inc
Pollution Control
|
$122.28
|
+4.96
4.23% |
$122.82
|
642,143
201.93% of 50 DAV
50 DAV is 318,000
|
$118.92
2.83%
|
8/10/2022
|
$111.78
|
PP = $115.10
|
|
MB = $120.86
|
Most Recent Note - 8/24/2022 12:23:36 PM
G - Hitting a new all-time high with today's gain, rising above its "max buy" level and its color code is changed to green. Posted a solid gain on the prior session backed by +20% above average volume. Previously noted gain and strong close above the pivot point backed by +116% above average volume on 8/12/22 triggered a technical buy signal. No resistance remains due to overhead supply. Fundamentals remain strong. Prior high in the $115 area defines important near-term support to watch on pullbacks.
>>> FEATURED STOCK ARTICLE : Pollution Control Firm Perched Near Prior High - 8/10/2022 |
View all notes |
Set NEW NOTE alert |
Company Profile |
SEC
News |
Chart |
Request a new note
C
A
S
I |
SNPS
-
NASDAQ
Synopsys Inc
COMPUTER SOFTWARE and SERVICES - Technical and System Software
|
$358.75
|
-0.25
-0.07% |
$360.62
|
694,597
72.13% of 50 DAV
50 DAV is 963,000
|
$391.17
-8.29%
|
8/17/2022
|
$381.37
|
PP = $377.70
|
|
MB = $396.59
|
Most Recent Note - 8/24/2022 5:13:55 PM
G - Halted its slide this week after encountering distributional pressure since reaching a new all-time high. Reported Jul '22 quarterly earnings +16% on +18% sales revenues versus the year ago period, below the +25% minimum earnings guideline (C criteria), raising fundamental concerns. Renewed strength and subsequent gains above the pivot point backed by at least +40% above average volume are needed to clinch a technical buy signal.
>>> FEATURED STOCK ARTICLE : Earnings Report Below +25% Minimum and Encountering Distributional Pressure - 8/18/2022 |
View all notes |
Set NEW NOTE alert |
Company Profile |
SEC
News |
Chart |
Request a new note
C
A
S
I |
|
|
|
THESE ARE NOT BUY RECOMMENDATIONS!
Comments contained in the body of this report are technical
opinions only. The material herein has been obtained
from sources believed to be reliable and accurate, however,
its accuracy and completeness cannot be guaranteed.
This site is not an investment advisor, hence it does
not endorse or recommend any securities or other investments.
Any recommendation contained in this report may not
be suitable for all investors and it is not to be deemed
an offer or solicitation on our part with respect to
the purchase or sale of any securities. All trademarks,
service marks and trade names appearing in this report
are the property of their respective owners, and are
likewise used for identification purposes only.
This report is a service available
only to active Paid Premium Members.
You may opt-out of receiving report notifications
at any time. Questions or comments may be submitted
by writing to Premium Membership Services 665 S.E. 10 Street, Suite 201 Deerfield Beach, FL 33441-5634 or by calling 1-800-965-8307
or 954-785-1121.
|
|
|