You are not logged in.
This means you
CAN ONLY VIEW reports that were published prior to Monday, March 24, 2025.
You
MUST UPGRADE YOUR MEMBERSHIP if you want to see any current reports.
AFTER MARKET UPDATE - THURSDAY, JULY 28TH, 2022
Previous After Market Report Next After Market Report >>>
|
|
|
|
DOW |
+332.04 |
32,529.63 |
+1.03% |
|
Volume |
890,810,882 |
-0% |
|
Volume |
4,858,447,800 |
+7% |
|
NASDAQ |
+130.17 |
12,162.59 |
+1.08% |
|
Advancers |
2,378 |
76% |
|
Advancers |
2,639 |
60% |
|
S&P 500 |
+48.82 |
4,072.43 |
+1.21% |
|
Decliners |
754 |
24% |
|
Decliners |
1,770 |
40% |
|
Russell 2000 |
+24.69 |
1,873.03 |
+1.34% |
|
52 Wk Highs |
44 |
|
|
52 Wk Highs |
85 |
|
|
S&P 600 |
+15.39 |
1,229.61 |
+1.27% |
|
52 Wk Lows |
50 |
|
|
52 Wk Lows |
131 |
|
|
 |
Major Averages Rose With Leadership Expanding
Kenneth J. Gruneisen - Passed the CAN SLIM® Master's Exam
The S&P 500 climbed 1.2%, on course for its best month since November 2020 (+7.6%). The Dow added 332 points, while the Nasdaq Composite rose 1.1%. The volume totals reported were mixed, slightly lower than the prior session on the NYSE and higher on the Nasdaq exchange. Breadth was positive as advancers led decliners by a 3-1 margin on the NYSE and about a 5-3 margin on the Nasdaq exchange. Leadership improved as there were 29 high-ranked companies from the Leaders List that hit new 52-week highs and were listed on the BreakOuts Page, up from the total of 18 on the prior session. New 52-week lows totals still outnumbered new 52-week highs on the NYSE and on the Nasdaq exchange. The market uptrend has been under some pressure (M criteria). Any sustainable rally requires a healthy crop of leading stocks hitting new highs, so the improvement in leadership was a reassuring sign.
Chart courtesy of www.stockcharts.com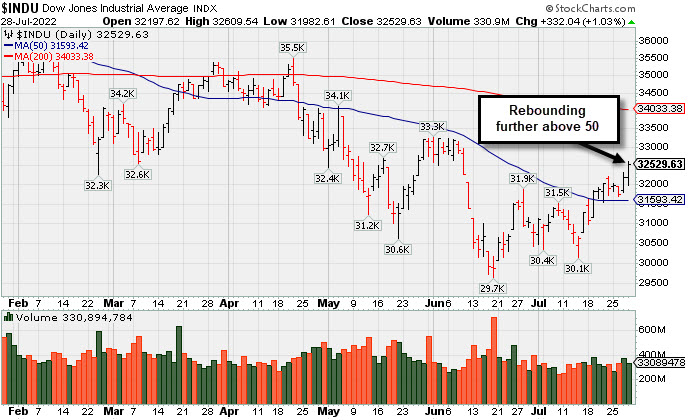 PICTURED: The Dow Jones Industrial Average rebounded further above its 50-day moving average (DMA) line. It remains well below its 200 DMA line.
U.S. stocks rallied for a second day on Thursday to hit a seven-week high as investors weighed the likely path of central bank policy tightening in the wake of a downbeat economic report. An advance reading of second-quarter U.S. GDP (Gross Domestic Product) showed the economy unexpectedly contracted at an annualized 0.9% pace during the April-June period following the first-quarter’s -1.6% annualized print. The back-to-back negative readings are flagging the possibility of a technical recession, or two consecutive quarters of economic contraction.
Ten of 11 S&P 500 sectors closed in positive territory, with Communication Services being the lone laggard. Elsewhere, Treasuries rallied as market participants pared back expectations of aggressive Federal Reserve (Fed) rate hikes. The yield on the 10-year note slid 13 basis points (0.13%) to 2.67%, its lowest level since April.
In earnings, Meta Platforms Inc. (META -5.22%) fell after posting its first-ever revenue decline amid a pullback in digital advertising. Elsewhere, Ford Motor Co. (F +6.14%) rose following a top and bottom line beat and boost to its dividend. In other corporate news, Spirit Airlines Inc. (SAVE +5.60%) after agreeing to be acquired by JetBlue Airways Corp. (JBLU -0.36%) in a cash deal worth approximately $3.8 billion.
In other news, weekly initial jobless claims came in at 256,000, while the prior figure was upwardly revised to 261,000. Rounding out the docket, an update from the Kansas City Fed showed manufacturing activity in the region posted a surprise improvement in July.
|
 Kenneth J. Gruneisen started out as a licensed stockbroker in August 1987, a couple of months prior to the historic stock market crash that took the Dow Jones Industrial Average down -22.6% in a single day. He has published daily fact-based fundamental and technical analysis on high-ranked stocks online for two decades. Through FACTBASEDINVESTING.COM, Kenneth provides educational articles, news, market commentary, and other information regarding proven investment systems that work in good times and bad.
Comments contained in the body of this report are technical opinions only and are not necessarily those of Gruneisen Growth Corp. The material herein has been obtained from sources believed to be reliable and accurate, however, its accuracy and completeness cannot be guaranteed. Our firm, employees, and customers may effect transactions, including transactions contrary to any recommendation herein, or have positions in the securities mentioned herein or options with respect thereto. Any recommendation contained in this report may not be suitable for all investors and it is not to be deemed an offer or solicitation on our part with respect to the purchase or sale of any securities. |
|
 |
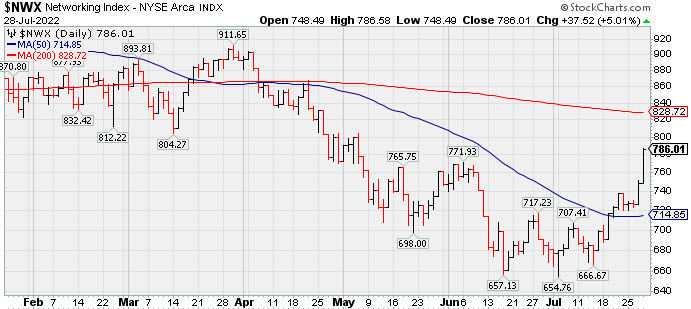
Retail, Broker/Dealer, Gold & Silver, and Tech Indexes Rose
Kenneth J. Gruneisen - Passed the CAN SLIM® Master's Exam
The Retail Index ($RLX +1.13%) and Broker/Dealer Index ($XBD +2.26%) posted gains while the Bank Index ($BKX -0.30%) edged lower. The Networking Index ($NWX +5.01%) led the tech sector higher while the Semiconductor Index ($SOX +1.15%) posted a smaller gain and the Biotech Index ($BTK +0.04%) finished flat. The Gold & Silver Index ($XAU +2.72%) posted a solid gain while the Integrated Oil Index ($XOI +0.12%) was little changed and the Oil Services Index ($OSX -0.83%) lost ground. PICTURED: The Networking Index ($NWX +5.01%) posted a solid gain rebounding further above its 50-day moving average (DMA) line and above its June high.
| Oil Services |
$OSX |
65.45 |
-0.55 |
-0.83% |
+24.15% |
| Integrated Oil |
$XOI |
1,535.46 |
+1.82 |
+0.12% |
+30.32% |
| Semiconductor |
$SOX |
2,944.50 |
+33.50 |
+1.15% |
-25.38% |
| Networking |
$NWX |
786.01 |
+37.52 |
+5.01% |
-19.06% |
| Broker/Dealer |
$XBD |
426.17 |
+9.40 |
+2.26% |
-12.47% |
| Retail |
$RLX |
3,187.54 |
+35.54 |
+1.13% |
-24.58% |
| Gold & Silver |
$XAU |
107.02 |
+2.84 |
+2.72% |
-19.20% |
| Bank |
$BKX |
106.98 |
-0.33 |
-0.30% |
-19.09% |
| Biotech |
$BTK |
4,777.89 |
+1.85 |
+0.04% |
-13.42% |
|
|
|
 |
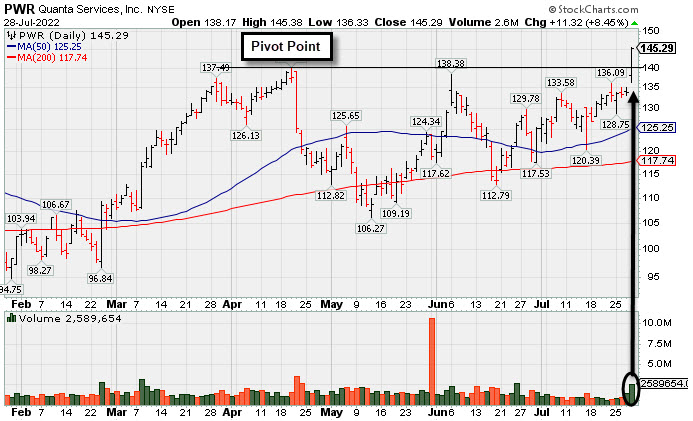
Volume-Driven Breakout for Quanta Services
Kenneth J. Gruneisen - Passed the CAN SLIM® Master's Exam
Quanta Services Inc (PWR +$11.32 or +8.45% to $145.29) finished near the session high after highlighter in yellow with pivot point cited based on its 4/20/22 high plus 10 cents in the earlier mid-day report (read here). It gapped up today hitting a new all-time high with a big gain and strong close above the pivot point backed by +71% above average volume clinching a technical buy signal. It found support near its 200 DMA line in recent months while consolidating.
Keep in mind it is due to report Jun '22 quarterly results on 8/04/22. Volume and volatility often increase near earnings news. It has a 97 Earnings Per Share Rating. Mar '22 quarterly earnings rose +65% on +47% sales revenues versus the year ago period, its 3rd quarterly comparison above the +25% minimum earnings guideline (C criteria). Annual earnings (A criteria) growth has been strong and steady.
The company hails from the Building - Heavy Construction industry group which is currently ranked 49th on the 197 Industry Groups list with a Group Relative Strength Rating of A-. The number of top-rated funds owning its shares rose from 1,202 in Sep '21 to 1,379 in Jun '22, a reassuring sign concerning the I criteria. It has 143.7 million shares outstanding (S criteria).
|
|
|
Color Codes Explained :
Y - Better candidates highlighted by our
staff of experts.
G - Previously featured
in past reports as yellow but may no longer be buyable under the
guidelines.
***Last / Change / Volume data in this table is the closing quote data***
Symbol/Exchange
Company Name
Industry Group |
PRICE |
CHANGE
(%Change) |
Day High |
Volume
(% DAV)
(% 50 day avg vol) |
52 Wk Hi
% From Hi |
Featured
Date |
Price
Featured |
Pivot Featured |
|
Max Buy |
 LLY
-
NYSE
LLY
-
NYSE
Eli Lilly & Co
Medical-Diversified
|
$330.80
|
+1.86
0.57% |
$333.59
|
2,345,255
81.94% of 50 DAV
50 DAV is 2,862,000
|
$335.33
-1.35%
|
5/16/2022
|
$302.46
|
PP = $314.10
|
|
MB = $329.81
|
 Most Recent Note - 7/28/2022 5:48:17 PM
G - Posted a gain with light volume today and its color code is changed to green after rising back above its "max buy" level. Its 50 DMA line ($314.10) defines near-term support to watch.
>>> FEATURED STOCK ARTICLE : Hovering Near "Max Buy" Level With Volume Totals Cooling - 7/22/2022 |
View all notes |
Set NEW NOTE alert |
Company Profile |
SEC
News |
Chart |
Request a new note
C
A
S
I |
IMXI
-
NASDAQ
International Money Exp
Financial Svcs-Specialty
|
$24.19
|
+0.55
2.33% |
$24.28
|
506,014
119.63% of 50 DAV
50 DAV is 423,000
|
$23.73
1.94%
|
7/1/2022
|
$21.27
|
PP = $21.38
|
|
MB = $22.45
|
Most Recent Note - 7/28/2022 5:46:44 PM
G - Posted another gain today with above average volume hitting a new 52-week high, rising further above its "max buy" level. Its 50 DMA line ($20.86) defines important near-term support to watch on pullbacks. Due to report Jun '22 quarterly results on 8/03/22.
>>> FEATURED STOCK ARTICLE : Stalled Since Clearing Double Bottom Base - 7/15/2022 |
View all notes |
Set NEW NOTE alert |
Company Profile |
SEC
News |
Chart |
Request a new note
C
A
S
I |
HRMY
-
NASDAQ
Harmony Biosciences Hldg
Medical-Biomed/Biotech
|
$50.33
|
-0.93
-1.81% |
$51.88
|
474,159
102.41% of 50 DAV
50 DAV is 463,000
|
$57.13
-11.90%
|
7/6/2022
|
$54.12
|
PP = $52.85
|
|
MB = $55.49
|
Most Recent Note - 7/28/2022 5:45:44 PM
Y - Pulled back again today with higher (near average) volume. Prior losses raised concerns while slumping back into the prior base. The next important near-term support to watch is its 50 DMA line ($47.98).
>>> FEATURED STOCK ARTICLE : Harmony Has Been Encountering Distributional Pressure - 7/18/2022 |
View all notes |
Set NEW NOTE alert |
Company Profile |
SEC
News |
Chart |
Request a new note
C
A
S
I |
CI
-
NYSE
Cigna Corp
Medical-Managed Care
|
$273.22
|
-1.51
-0.55% |
$275.75
|
1,400,348
72.22% of 50 DAV
50 DAV is 1,939,000
|
$282.33
-3.23%
|
7/7/2022
|
$276.55
|
PP = $273.68
|
|
MB = $287.36
|
Most Recent Note - 7/28/2022 5:38:48 PM
Y - Pulled back with lighter than average volume for a 2nd consecutive session today. Tested support at its 50 DMA line ($264) twice following a recent technical breakout. More damaging losses would raise greater concerns.
>>> FEATURED STOCK ARTICLE : Pulled Back and Tested Support at 50-Day Moving Average - 7/19/2022 |
View all notes |
Set NEW NOTE alert |
Company Profile |
SEC
News |
Chart |
Request a new note
C
A
S
I |
AN
-
NYSE
Autonation Inc
SPECIALTY RETAIL - Auto Dealerships
|
$117.40
|
+4.79
4.25% |
$117.96
|
953,322
126.62% of 50 DAV
50 DAV is 752,900
|
$133.48
-12.05%
|
7/20/2022
|
$122.03
|
PP = $126.49
|
|
MB = $132.81
|
Most Recent Note - 7/28/2022 5:37:44 PM
Y - Posted a 2nd consecutive gain today with above average volume, rebounding above its 200 DMA line and its 50 DMA line ($115.51) helping its outlook to improve, and its color code is changed to yellow. Subsequent volume-driven gains above the pivot point may trigger a technical buy signal. Reported Jun '22 quarterly earnings +34% on -2% sales revenues versus the year ago period. Faces some resistance due to overhead supply up to the $133 level.
>>> FEATURED STOCK ARTICLE : Autonation Earnings Due While Perched Near Pivot Point - 7/20/2022 |
View all notes |
Set NEW NOTE alert |
Company Profile |
SEC
News |
Chart |
Request a new note
C
A
S
I |
Symbol/Exchange
Company Name
Industry Group |
PRICE |
CHANGE
(%Change) |
Day High |
Volume
(% DAV)
(% 50 day avg vol) |
52 Wk Hi
% From Hi |
Featured
Date |
Price
Featured |
Pivot Featured |
|
Max Buy |
ESQ
-
NASDAQ
Esquire Financial Hldgs
Finance-Commercial Loans
|
$36.32
|
-1.08
-2.89% |
$37.31
|
12,619
20.69% of 50 DAV
50 DAV is 61,000
|
$39.09
-7.09%
|
7/26/2022
|
$37.74
|
PP = $39.19
|
|
MB = $41.15
|
Most Recent Note - 7/28/2022 5:42:31 PM
Y - Pulled back today with lighter volume following a streak of 4 consecutive gains with higher volume. It was highlighted in yellow with pivot point cited based on its 4/25/22 high plus 10 cents in the 7/26/22 mid-day report. Subsequent gains above the pivot point backed by at least +40% above average volume may trigger a technical buy signal. Its 50 DMA line ($35.16) defines initial support above its 200 DMA line ($33.91).
>>> FEATURED STOCK ARTICLE : Volume Driven Gains Approaching Prior High - 7/26/2022 |
View all notes |
Set NEW NOTE alert |
Company Profile |
SEC
News |
Chart |
Request a new note
C
A
S
I |
GPK
-
NYSE
Graphic Packaging Hldg
CONSUMER NON-DURABLES - Packaging and Containers
|
$22.48
|
+0.13
0.58% |
$22.51
|
3,166,277
110.94% of 50 DAV
50 DAV is 2,854,000
|
$22.99
-2.22%
|
7/26/2022
|
$22.63
|
PP = $23.09
|
|
MB = $24.24
|
Most Recent Note - 7/28/2022 5:43:45 PM
Y - Posted a small gain today with average volume and it remains perched near its 52-week high. Highlighted in yellow in the 7/26/22 mid-day report with pivot point cited based on its 6/06/22 high plus 10 cents. Subsequent gains above the pivot point backed by at least +40% above average volume are needed to trigger a proper technical buy signal. See the latest FSU analysis for more details and an annotated graph.
>>> FEATURED STOCK ARTICLE : Negative Reversal After Matching 52-Week High - 7/27/2022 |
View all notes |
Set NEW NOTE alert |
Company Profile |
SEC
News |
Chart |
Request a new note
C
A
S
I |
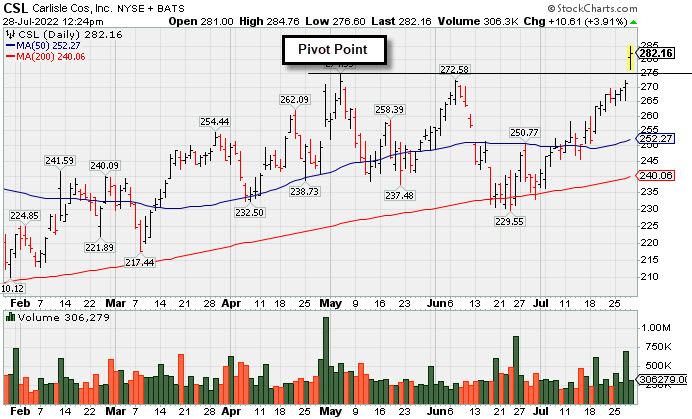
CSL
-
NYSE
Carlisle Cos Inc
Diversified Operations
|
$287.60
|
+16.05
5.91% |
$290.74
|
892,294
271.21% of 50 DAV
50 DAV is 329,000
|
$275.13
4.53%
|
7/28/2022
|
$282.31
|
PP = $275.23
|
|
MB = $288.99
|
Most Recent Note - 7/28/2022 5:40:08 PM
Y - Finished strong today after highlighted in yellow with pivot point cited based on its 5/04/22 high plus 10 cents in the earlier mid-day report. Gapped up hitting a new all-time high with its 4th consecutive volume-driven gain. Found support in recent weeks at its 200 DMA line ($240). Reported Jun '22 quarterly earnings +185% on +57% sales revenues versus the year ago period, its 4th very strong quarter well above the +25% minimum earnings guideline (C criteria). Annual earnings (A criteria) history included a downturn in FY '20.
 There are no Featured Stock Updates™ available for this stock at this time. You may request one by clicking the Request a New Note link below |
View all notes |
Set NEW NOTE alert |
Company Profile |
SEC
News |
Chart |
Request a new note
C
A
S
I
There are no Featured Stock Updates™ available for this stock at this time. You may request one by clicking the Request a New Note link below |
View all notes |
Set NEW NOTE alert |
Company Profile |
SEC
News |
Chart |
Request a new note
C
A
S
I |
ENPH
-
NASDAQ
Enphase Energy Inc
Energy-Solar
|
$274.18
|
+19.41
7.62% |
$285.00
|
9,406,037
333.07% of 50 DAV
50 DAV is 2,824,000
|
$282.46
-2.93%
|
7/28/2022
|
$276.66
|
PP = $282.55
|
|
MB = $296.68
|
Most Recent Note - 7/28/2022 5:41:17 PM
Y - Color code was changed to yellow with pivot point cited based on its 11/22/21 high plus 10 cents in the earlier mid-day report. Gapped up for a 2nd consecutive considerable volume-driven gain and touched a new all-time high. Faces no resistance due to overhead supply. Subsequent gains and a strong close above the pivot point may clinch a technical buy signal. Fundamentals remain strong after reporting solid Jun '22 quarterly results, continuing its strong earnings history. Went through a choppy consolidation since dropped from the Featured Stocks list on 12/14/21.
>>> FEATURED STOCK ARTICLE : Pullback Testing Near Prior High - 12/2/2021 |
View all notes |
Set NEW NOTE alert |
Company Profile |
SEC
News |
Chart |
Request a new note
C
A
S
I |
PWR
-
NYSE
Quanta Services Inc
MATERIALS and CONSTRUCTION - General Contractors
|
$145.29
|
+11.32
8.45% |
$145.38
|
2,589,646
172.18% of 50 DAV
50 DAV is 1,504,000
|
$140.04
3.75%
|
7/28/2022
|
$141.83
|
PP = $140.14
|
|
MB = $147.15
|
Most Recent Note - 7/28/2022 5:51:14 PM
Y - Color code was changed to yellow with pivot point cited based on its 4/20/22 high plus 10 cents. Gapped up today hitting a new all-time high with a big volume-driven gain above the pivot point clinching a technical buy signal. Found support near its 200 DMA line in recent months while consolidating. Due to report Jun '22 quarterly results on 8/04/22. Reported Mar '22 quarterly earnings +65% versus the year ago period, its 3rd quarterly comparison above the +25% minimum earnings guideline (C criteria). Annual earnings (A criteria) growth has been strong and steady. See the latest FSU analysis for more details and a new annotated graph.
>>> FEATURED STOCK ARTICLE : Volume-Driven Breakout for Quanta Services - 7/28/2022 |
View all notes |
Set NEW NOTE alert |
Company Profile |
SEC
News |
Chart |
Request a new note
C
A
S
I |
Symbol/Exchange
Company Name
Industry Group |
PRICE |
CHANGE
(%Change) |
Day High |
Volume
(% DAV)
(% 50 day avg vol) |
52 Wk Hi
% From Hi |
Featured
Date |
Price
Featured |
Pivot Featured |
|
Max Buy |
|
|
|
THESE ARE NOT BUY RECOMMENDATIONS!
Comments contained in the body of this report are technical
opinions only. The material herein has been obtained
from sources believed to be reliable and accurate, however,
its accuracy and completeness cannot be guaranteed.
This site is not an investment advisor, hence it does
not endorse or recommend any securities or other investments.
Any recommendation contained in this report may not
be suitable for all investors and it is not to be deemed
an offer or solicitation on our part with respect to
the purchase or sale of any securities. All trademarks,
service marks and trade names appearing in this report
are the property of their respective owners, and are
likewise used for identification purposes only.
This report is a service available
only to active Paid Premium Members.
You may opt-out of receiving report notifications
at any time. Questions or comments may be submitted
by writing to Premium Membership Services 665 S.E. 10 Street, Suite 201 Deerfield Beach, FL 33441-5634 or by calling 1-800-965-8307
or 954-785-1121.
|
|
|