You are not logged in.
This means you
CAN ONLY VIEW reports that were published prior to Thursday, April 17, 2025.
You
MUST UPGRADE YOUR MEMBERSHIP if you want to see any current reports.
AFTER MARKET UPDATE - THURSDAY, MARCH 23RD, 2023
Previous After Market Report Next After Market Report >>>
|
|
|
|
DOW |
+75.14 |
32,105.25 |
+0.23% |
|
Volume |
1,076,631,972 |
+7% |
|
Volume |
4,891,678,100 |
-1% |
|
NASDAQ |
+117.44 |
11,787.40 |
+1.01% |
|
Advancers |
999 |
35% |
|
Advancers |
2,081 |
47% |
|
S&P 500 |
+11.75 |
3,948.72 |
+0.30% |
|
Decliners |
1,831 |
65% |
|
Decliners |
2,332 |
53% |
|
Russell 2000 |
-7.07 |
1,720.29 |
-0.41% |
|
52 Wk Highs |
31 |
|
|
52 Wk Highs |
57 |
|
|
S&P 600 |
-9.73 |
1,128.16 |
-0.86% |
|
52 Wk Lows |
212 |
|
|
52 Wk Lows |
315 |
|
|
Recent commentaries have noted an ongoing "market correction". No new buying efforts are to be made based on the (M criteria) of the fact-based investment system. Disciplined investors know to reduce market exposure by selling any weakening stocks on a case-by-case basis.
|
 |
Major Averages Inched Higher Without Conviction
Kenneth J. Gruneisen - Passed the CAN SLIM® Master's Exam
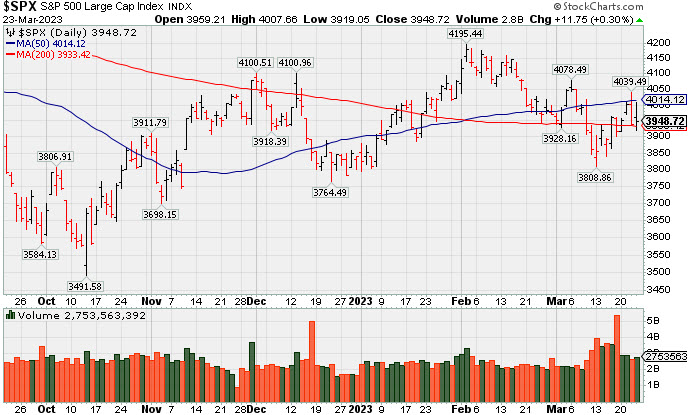
The Dow added 75 points (0.2%), while the Nasdaq Composite climbed 1%. The S&P 500 advanced 0.3%. Volume totals reported were mixed, slightly higher than the prior session on the NYSE and lower on the Nasdaq exchange. Breadth was negative as decliners led advancers by a 9-5 margin on the NYSE while the mix was closer to even on the Nasdaq exchange. There were 15 high-ranked companies from theLeaders Listthat hit a new 52-week high and were listed on the BreakOuts Page, versus the total of 16 on the prior session. New 52-week lows totals rose and outnumbered new 52-week highs totals on the NYSE and on the Nasdaq exchange. The major indices are in a market correction (M criteria). Disciplined investors know that in a market correction it is best to avoid new buying efforts and raise safe cash.
PICTURED: The S&P 500 Index posted a small gain on what was Day 6 of its latest rally attempt. Disciplined investors are watching for a solid follow-through day to confirm a new uptrend.
U.S. equities finished higher in volatile trading Thursday as investors continued to assess the Federal Reserve’s (Fed) monetary policy decision and the latest developments in the banking sector. Yesterday, the Fed raised interest rates by 25 basis points (0.25%). Fed Chair Jerome Powell noted the path down to the 2% inflation target will be bumpy, but he was more dovish in his delivery, saying “some policy firming may be appropriate.” This afternoon, Treasury Secretary Janet Yellen indicated the U.S. government is prepared to take additional action to shore up the financial system if needed. The comments come after she said yesterday she has not considered the possibility of expanding federal insurance to cover all U.S. bank deposits.
On the data front, initial jobless claims unexpectedly ticked lower, coming in at 191,000 in the week ended March 18, suggesting the labor market remains tight despite the Fed’s monetary policy. Meanwhile, new home sales climbed 1.1% month-over-month in February versus estimates of a 3.1% monthly decline. Treasuries were mixed, with the yield on the 10-year note down three basis points (0.03%) to 3.40% while the 30-year bond yield climbed two basis points (0.02%) to 3.67%. The yield on the two-year note fell by 12 basis points (0.12%) to 3.80%. In commodities, West Texas Intermediate (WTI) crude shed 2.3% to $69.30/barrel amid renewed concerns over the economic outlook. The Energy Information Agency’s (EIA) weekly report showed crude stockpiles unexpectedly rose to their highest since May 2021 in the week ended March 17.
|
 Kenneth J. Gruneisen started out as a licensed stockbroker in August 1987, a couple of months prior to the historic stock market crash that took the Dow Jones Industrial Average down -22.6% in a single day. He has published daily fact-based fundamental and technical analysis on high-ranked stocks online for two decades. Through FACTBASEDINVESTING.COM, Kenneth provides educational articles, news, market commentary, and other information regarding proven investment systems that work in good times and bad.
Comments contained in the body of this report are technical opinions only and are not necessarily those of Gruneisen Growth Corp. The material herein has been obtained from sources believed to be reliable and accurate, however, its accuracy and completeness cannot be guaranteed. Our firm, employees, and customers may effect transactions, including transactions contrary to any recommendation herein, or have positions in the securities mentioned herein or options with respect thereto. Any recommendation contained in this report may not be suitable for all investors and it is not to be deemed an offer or solicitation on our part with respect to the purchase or sale of any securities. |
|
 |
Financial and Energy-Linked Indexes Led Decliners
Kenneth J. Gruneisen - Passed the CAN SLIM® Master's Exam
Financials created a drag on the major averages as the Bank Index ($BKX -1.73%) and Broker/Dealer Index ($XBD -1.00%) both lost ground. The Semiconductor Index ($SOX +2.67%) led the tech sector while the Biotech Index ($BTK +0.38%) edged higher and the Networking Index ($NWX -0.01%) finished flat. Commodity-linked groups were mixed as the Oil Services Index ($OSX -2.51%) and Integrated Oil Index ($XOI -1.25%) both slumped while the Gold & Silver Index ($XAU +1.90%) notched a solid gain.
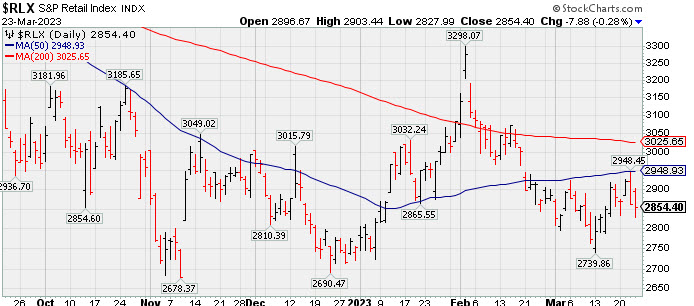
PICTURED: The Retail Index ($RLX -0.28%) edged lower. It met resistance at its 50-day moving average when recently trying to rebound. The recent low defines near-term support to watch above its late 2022 lows.
| Oil Services |
$OSX |
72.97 |
-1.88 |
-2.51% |
-12.98% |
| Integrated Oil |
$XOI |
1,625.17 |
-20.59 |
-1.25% |
-9.07% |
| Semiconductor |
$SOX |
3,174.36 |
+82.65 |
+2.67% |
+25.36% |
| Networking |
$NWX |
814.26 |
-0.04 |
-0.01% |
+3.95% |
| Broker/Dealer |
$XBD |
444.18 |
-4.47 |
-1.00% |
-1.10% |
| Retail |
$RLX |
2,854.40 |
-7.88 |
-0.28% |
+3.65% |
| Gold & Silver |
$XAU |
125.59 |
+2.34 |
+1.90% |
+3.92% |
| Bank |
$BKX |
78.06 |
-1.38 |
-1.73% |
-22.60% |
| Biotech |
$BTK |
5,095.46 |
+19.21 |
+0.38% |
-3.52% |
|
|
|
 |
Featured Stocks
Kenneth J. Gruneisen - Passed the CAN SLIM® Master's Exam
|
|
|
Color Codes Explained :
Y - Better candidates highlighted by our
staff of experts.
G - Previously featured
in past reports as yellow but may no longer be buyable under the
guidelines.
***Last / Change / Volume data in this table is the closing quote data***
Symbol/Exchange
Company Name
Industry Group |
PRICE |
CHANGE
(%Change) |
Day High |
Volume
(% DAV)
(% 50 day avg vol) |
52 Wk Hi
% From Hi |
Featured
Date |
Price
Featured |
Pivot Featured |
|
Max Buy |
 GPK
-
NYSE
GPK
-
NYSE
Graphic Packaging
CONSUMER NON-DURABLES - Packaging and Containers
|
$24.01
|
+0.23
0.97% |
$24.42
|
4,232,304
129.19% of 50 DAV
50 DAV is 3,276,000
|
$25.17
-4.61%
|
10/25/2022
|
$22.75
|
PP = $24.17
|
|
MB = $25.38
|
 Most Recent Note - 3/23/2023 5:27:11 PM
Y - Posted a gain today with above-average volume but ended in the lower half of its intraday range and it is still sputtering below the noted pivot point. Its 50 DMA line ($23.50) and recent low ($22.99 on 3/16/23) define important near-term support to watch. More damaging losses would raise greater concerns and trigger a technical sell signal. See the latest FSU analysis for more details and a new annotated graph.
>>> FEATURED STOCK ARTICLE : Found Encouraging Support Near 50-Day Moving Average Line - 3/21/2023 |
View all notes |
Set NEW NOTE alert |
Company Profile |
SEC
News |
Chart |
Request a new note
C
A
S
I |
STRL
-
NASDAQ
Sterling Infrastructure
MATERIALS and; CONSTRUCTION - Heavy Construction
|
$37.90
|
-0.17
-0.45% |
$38.90
|
173,052
60.51% of 50 DAV
50 DAV is 286,000
|
$42.00
-9.76%
|
12/14/2022
|
$32.41
|
PP = $33.72
|
|
MB = $35.41
|
Most Recent Note - 3/23/2023 5:23:52 PM
G - Pulled back today for a 2nd consecutive loss with below-average volume. Its 50 DMA line ($36.79) defines important near-term support to watch.
>>> FEATURED STOCK ARTICLE : Posting Quiet Gains Just Above 50-Day Moving Average Line - 3/20/2023 |
View all notes |
Set NEW NOTE alert |
Company Profile |
SEC
News |
Chart |
Request a new note
C
A
S
I |
PERI
-
NASDAQ
Perion Network
Comml Svcs-Advertising
|
$38.21
|
+0.96
2.58% |
$39.53
|
1,062,139
138.66% of 50 DAV
50 DAV is 766,000
|
$38.83
-1.60%
|
1/25/2023
|
$31.79
|
PP = $33.19
|
|
MB = $34.85
|
Most Recent Note - 3/23/2023 12:34:03 PM
G - Hitting yet another new all-time high with today's 3rd consecutive gain. Found support when recently consolidating above its 50 DMA line ($33.32) and the prior high ($33) which define important near-term support.
>>> FEATURED STOCK ARTICLE : Consolidating in an Orderly Manner Above Old High and 50 DMA Line - 3/15/2023 |
View all notes |
Set NEW NOTE alert |
Company Profile |
SEC
News |
Chart |
Request a new note
C
A
S
I |
ALGM
-
NASDAQ
Allegro MicroSystems
Elec-Semiconductor Mfg
|
$47.37
|
+1.61
3.52% |
$48.30
|
2,001,076
119.75% of 50 DAV
50 DAV is 1,671,000
|
$47.68
-0.65%
|
1/31/2023
|
$37.80
|
PP = $38.38
|
|
MB = $40.30
|
Most Recent Note - 3/23/2023 5:29:25 PM
G - Posted a gain today with +20% above average volume for a new all-time high. Wedging higher and getting more extended from the previously noted base. Its 50 DMA line ($41.24) defines initial support above the prior high in the $38 area. See the latest FSU analysis for more details and an annotated graph.
>>> FEATURED STOCK ARTICLE : Extended From Prior Base and Perched Near All-Time High - 3/22/2023 |
View all notes |
Set NEW NOTE alert |
Company Profile |
SEC
News |
Chart |
Request a new note
C
A
S
I |
FIX
-
NYSE
Comfort Systems USA
MATERIALS and CONSTRUCTION - General Contractors
|
$135.69
|
-4.28
-3.06% |
$141.20
|
199,606
79.21% of 50 DAV
50 DAV is 252,000
|
$152.13
-10.81%
|
2/23/2023
|
$136.52
|
PP = $128.78
|
|
MB = $135.22
|
Most Recent Note - 3/23/2023 5:30:58 PM
G - Consolidating well above its 50 DMA line ($130) and the prior high in the $128 area defining important support to watch. Fundamentals remain strong.
>>> FEATURED STOCK ARTICLE : Consolidating Above Support at Prior High and 50-Day Moving Average - 3/16/2023 |
View all notes |
Set NEW NOTE alert |
Company Profile |
SEC
News |
Chart |
Request a new note
C
A
S
I |
Symbol/Exchange
Company Name
Industry Group |
PRICE |
CHANGE
(%Change) |
Day High |
Volume
(% DAV)
(% 50 day avg vol) |
52 Wk Hi
% From Hi |
Featured
Date |
Price
Featured |
Pivot Featured |
|
Max Buy |
KOF
-
NYSE
Coca-Cola Femsa ADR
FOOD and BEVERAGE - Beverages - Soft Drinks
|
$76.95
|
-0.31
-0.40% |
$77.82
|
300,137
176.55% of 50 DAV
50 DAV is 170,000
|
$79.16
-2.79%
|
3/7/2023
|
$76.63
|
PP = $77.11
|
|
MB = $80.97
|
Most Recent Note - 3/22/2023 5:04:56 PM
Y - Posted a small gain today with very light volume for its second-best-ever close. Highlighted in yellow with pivot point cited based on its 1/24/23 high plus 10 cents in the 3/07/23 mid-day report. Gains above the pivot point must be backed by at least +40% above average volume to trigger a proper technical buy signal.
>>> FEATURED STOCK ARTICLE : Mexican Coke Bottler Hits New Multi-Year High - 3/7/2023 |
View all notes |
Set NEW NOTE alert |
Company Profile |
SEC
News |
Chart |
Request a new note
C
A
S
I |
ANET
-
NYSE
Arista Networks
Computer-Networking
|
$169.39
|
+3.33
2.01% |
$171.44
|
2,988,557
117.98% of 50 DAV
50 DAV is 2,533,000
|
$170.14
-0.44%
|
3/8/2023
|
$147.59
|
PP = $148.67
|
|
MB = $156.10
|
Most Recent Note - 3/23/2023 5:30:22 PM
G - Hit another new all-time high today. Very extended from any sound base after an impressive spurt of volume-driven gains. Prior highs in the $148-145 area define initial support to watch above its 50 DMA line ($136.91). Broader market weakness (M criteria) has been noted as a "correction" that has raised concerns.
>>> FEATURED STOCK ARTICLE : Arista Challenging All-Time High - 3/8/2023 |
View all notes |
Set NEW NOTE alert |
Company Profile |
SEC
News |
Chart |
Request a new note
C
A
S
I |
CLH
-
NYSE
Clean Harbors
Pollution Control
|
$132.72
|
-0.91
-0.68% |
$136.00
|
298,391
74.78% of 50 DAV
50 DAV is 399,000
|
$140.69
-5.66%
|
3/10/2023
|
$136.89
|
PP = $136.74
|
|
MB = $143.58
|
Most Recent Note - 3/22/2023 5:02:06 PM
Y - Pulled back today for a loss with +20% above average volume. Fundamentals remain strong. Its 50 DMA line ($131.18) defines important near-term support to watch.
>>> FEATURED STOCK ARTICLE : Pullback to Support Marked Secondary Buy Point; Market Concerns Rose - 3/10/2023 |
View all notes |
Set NEW NOTE alert |
Company Profile |
SEC
News |
Chart |
Request a new note
C
A
S
I |
|
|
|
THESE ARE NOT BUY RECOMMENDATIONS!
Comments contained in the body of this report are technical
opinions only. The material herein has been obtained
from sources believed to be reliable and accurate, however,
its accuracy and completeness cannot be guaranteed.
This site is not an investment advisor, hence it does
not endorse or recommend any securities or other investments.
Any recommendation contained in this report may not
be suitable for all investors and it is not to be deemed
an offer or solicitation on our part with respect to
the purchase or sale of any securities. All trademarks,
service marks and trade names appearing in this report
are the property of their respective owners, and are
likewise used for identification purposes only.
This report is a service available
only to active Paid Premium Members.
You may opt-out of receiving report notifications
at any time. Questions or comments may be submitted
by writing to Premium Membership Services 665 S.E. 10 Street, Suite 201 Deerfield Beach, FL 33441-5634 or by calling 1-800-965-8307
or 954-785-1121.
|
|
|