You are not logged in.
This means you
CAN ONLY VIEW reports that were published prior to Monday, February 17, 2025.
You
MUST UPGRADE YOUR MEMBERSHIP if you want to see any current reports.
AFTER MARKET UPDATE - MONDAY, MARCH 8TH, 2021
Previous After Market Report Next After Market Report >>>
|
|
|
|
DOW |
+306.14 |
31,802.44 |
+0.97% |
|
Volume |
1,207,969,606 |
-13% |
|
Volume |
5,924,344,000 |
-23% |
|
NASDAQ |
-310.99 |
12,609.16 |
-2.41% |
|
Advancers |
1,925 |
61% |
|
Advancers |
1,956 |
50% |
|
S&P 500 |
-20.59 |
3,821.35 |
-0.54% |
|
Decliners |
1,251 |
39% |
|
Decliners |
1,947 |
50% |
|
Russell 2000 |
+10.77 |
2,202.98 |
+0.49% |
|
52 Wk Highs |
461 |
|
|
52 Wk Highs |
474 |
|
|
S&P 600 |
+25.70 |
1,327.82 |
+1.97% |
|
52 Wk Lows |
15 |
|
|
52 Wk Lows |
35 |
|
|
Weak action was recently noted as a "correction", however, technical strength noted in the Dow Jones Industrial Average today has helped the uptrend resume - a quick positive shift concerning the M criteria.
|
 |
Leadership Improves and Dow Industrials Resume the Rally
Kenneth J. Gruneisen - Passed the CAN SLIM® Master's Exam
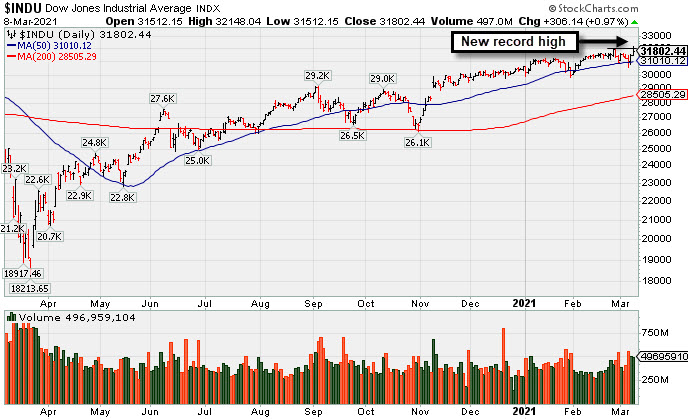
The Dow climbed 306 points to notch a fresh all-time high during intraday trading. The S&P 500 erased a 1% gain to end the session down 0.5%, while the Nasdaq Composite slumped 2.4%. The volume was lighter than the prior session totals on the NYSE and on the Nasdaq exchange. Advancers led decliners by a 3-2 margin on the NYSE while the mix was nearly even on the Nasdaq exchange. Leadership improved as there were 132 high-ranked companies from the Leaders List that hit new 52-week highs and were listed on the BreakOuts Page, up from the total of 63 on the prior session. New 52-week highs totals expanded and easily outnumbered shrinking new 52-week lows totals on the NYSE and on the Nasdaq exchange. As the Dow Jones Industrial Average posted a 2nd consecutive big gain and hit a new record high, technically, it ended the recently noted "correction", resuming the market uptrend (M criteria). Investors are reminded to always make buying and selling decisions on a case-by-case basis under the strict criteria and rules of the fact-based investment system.
PICTURED: The Dow Jones Industrial Average posted a 2nd consecutive big gain and hit a new record high, technically ending the recently noted "correction" and resuming the market uptrend (M criteria). It found prompt support after undercutting its 50-day moving average (DMA) line last week.
U.S. stocks finished mixed on Monday as investors continued to rotate out of Tech and other high growth sectors and into more cyclical-oriented pockets of the equity market. Progress on fiscal stimulus was also in focus, with the U.S. Senate having passed the latest $1.9 trillion coronavirus relief package over the weekend. The measure could come to a vote in the U.S. House of Representatives as soon as Tuesday.
The yield on the benchmark 10-year note was up four basis points to 1.60%, with government bonds extending losses into a sixth consecutive week. In commodities, WTI crude erased earlier gains of more than 2%, instead falling 2.2% to $64.65/barrel. Oil prices had jumped overnight amid reports of an attack on a Saudi Arabian production facility. In FOREX trading, a gauge of the U.S. dollar strengthened to its highest point since late November.
Seven of 11 S&P 500 sectors closed in positive territory, with Technology dropping 2.5%. In corporate news, General Electric (GE +4.19%) rose on reports the company is close to a $30 billion deal to combine its aircraft leasing segment with Ireland’s AerCap Holdings Nv (AER +13.25%) . Also in the M&A space, retirement services company Athene Holdings Ltd (ATH +5.97%) rose after agreeing to be purchased by private-equity firm Apollo Global. Elsewhere, Walt Disney (DIS +6.28%) rallied as a rollback of COVID-19 restrictions in California would permit the reopening of Disneyland in April. |
 Kenneth J. Gruneisen started out as a licensed stockbroker in August 1987, a couple of months prior to the historic stock market crash that took the Dow Jones Industrial Average down -22.6% in a single day. He has published daily fact-based fundamental and technical analysis on high-ranked stocks online for two decades. Through FACTBASEDINVESTING.COM, Kenneth provides educational articles, news, market commentary, and other information regarding proven investment systems that work in good times and bad.
Comments contained in the body of this report are technical opinions only and are not necessarily those of Gruneisen Growth Corp. The material herein has been obtained from sources believed to be reliable and accurate, however, its accuracy and completeness cannot be guaranteed. Our firm, employees, and customers may effect transactions, including transactions contrary to any recommendation herein, or have positions in the securities mentioned herein or options with respect thereto. Any recommendation contained in this report may not be suitable for all investors and it is not to be deemed an offer or solicitation on our part with respect to the purchase or sale of any securities. |
|
 |
Financial, Retail, and Oil Services Indexes Led Group Gainers
Kenneth J. Gruneisen - Passed the CAN SLIM® Master's Exam
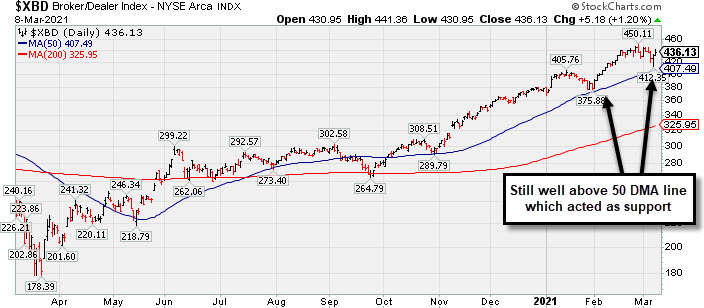
Gains from the Broker/Dealer Index ($XBD +1.20%) and Bank Index ($BKX +2.06%) had a positive influence on the major indices and the Retail Index ($RLX +0.20%) also inched higher. The Semiconductor Index ($SOX -5.41%) led the tech sector lower while the Biotech Index ($BTK -2.02%) also slumped, meanwhile, the Networking Index ($NWX +0.66%) edged higher. The Oil Services Index ($OSX +1.90%) posted a gain while the Integrated Oil Index ($XOI -0.38%) edged lower and the Gold & Silver Index ($XAU -1.41%) suffered a larger loss.
PICTURED: The Broker/Dealer Index ($XBD +1.20%) graph shows that it found support well above its 50-day moving average line.
| Oil Services |
$OSX |
63.03 |
+1.17 |
+1.90% |
+42.17% |
| Integrated Oil |
$XOI |
1,082.05 |
-4.17 |
-0.38% |
+36.54% |
| Semiconductor |
$SOX |
2,762.75 |
-158.00 |
-5.41% |
-1.17% |
| Networking |
$NWX |
753.58 |
+4.94 |
+0.66% |
+5.08% |
| Broker/Dealer |
$XBD |
436.13 |
+5.18 |
+1.20% |
+15.50% |
| Retail |
$RLX |
3,407.81 |
+6.73 |
+0.20% |
-4.36% |
| Gold & Silver |
$XAU |
131.71 |
-1.88 |
-1.41% |
-8.66% |
| Bank |
$BKX |
120.75 |
+2.44 |
+2.06% |
+23.33% |
| Biotech |
$BTK |
5,424.79 |
-111.76 |
-2.02% |
-5.48% |
|
|
|
 |
Featured Stocks
Kenneth J. Gruneisen - Passed the CAN SLIM® Master's Exam
|
|
|
Color Codes Explained :
Y - Better candidates highlighted by our
staff of experts.
G - Previously featured
in past reports as yellow but may no longer be buyable under the
guidelines.
***Last / Change / Volume data in this table is the closing quote data***
Symbol/Exchange
Company Name
Industry Group |
PRICE |
CHANGE
(%Change) |
Day High |
Volume
(% DAV)
(% 50 day avg vol) |
52 Wk Hi
% From Hi |
Featured
Date |
Price
Featured |
Pivot Featured |
|
Max Buy |
 FBC
-
NYSE
FBC
-
NYSE
Flagstar Bancorp Inc
BANKING - Savings and Loans
|
$44.84
|
+1.07
2.44% |
$46.08
|
598,320
95.15% of 50 DAV
50 DAV is 628,800
|
$49.15
-8.77%
|
3/4/2021
|
$47.26
|
PP = $48.02
|
|
MB = $50.42
|
 Most Recent Note - 3/8/2021 5:25:26 PM
Y - After a "negative reversal" at its 52-week high it undercut its 50 DMA line and found prompt support. Featured in yellow with pivot point cited based on its 1/26/21 high plus 10 cents in the 3/04/21 mid-day report and repeatedly noted - "Subsequent gains and a strong close above the pivot point backed by at least +40% above average volume are needed to trigger a proper technical buy signal."
>>> FEATURED STOCK ARTICLE : Negative Reversal When Poised For Technical Breakout - 3/4/2021 |
View all notes |
Set NEW NOTE alert |
Company Profile |
SEC
News |
Chart |
Request a new note
C
A
S
I |
CRL
-
NYSE
Charles River Labs Intl
DRUGS - Biotechnology
|
$270.97
|
-2.85
-1.04% |
$278.91
|
233,405
73.86% of 50 DAV
50 DAV is 316,000
|
$303.79
-10.80%
|
12/17/2020
|
$247.06
|
PP = $257.98
|
|
MB = $270.88
|
Most Recent Note - 3/8/2021 5:21:56 PM
G - After briefly rebounding it slumped back below its 50 DMA line ($272) with a loss today with below average volume. Its Relative Strength Rating has slumped to 75. Recently reported Dec '20 quarterly earnings +19% on +14% sales revenues versus the year ago period, below the +25% minimum earnings guideline (C criteria), raising concerns.
>>> FEATURED STOCK ARTICLE : CRL Still Hovering Near Record High - 3/1/2021 |
View all notes |
Set NEW NOTE alert |
Company Profile |
SEC
News |
Chart |
Request a new note
C
A
S
I |
OPY
-
NYSE
Oppenheimer Holdings Inc
FINANCIAL SERVICES - Investment Brokerage - Regiona
|
$41.22
|
+1.67
4.22% |
$41.71
|
125,760
103.08% of 50 DAV
50 DAV is 122,000
|
$40.84
0.93%
|
2/25/2021
|
$38.95
|
PP = $38.11
|
|
MB = $40.02
|
Most Recent Note - 3/8/2021 5:28:02 PM
G - Closed strong today as it hit another new all-time high with a big gain backed by average volume. Disciplined investors avoid chasing stocks extended more than +5% above their pivot point.
>>> FEATURED STOCK ARTICLE : Rose From "3-weeks Tight" Base But Ended Near Session Low - 2/25/2021 |
View all notes |
Set NEW NOTE alert |
Company Profile |
SEC
News |
Chart |
Request a new note
C
A
S
I |
CLFD
-
NASDAQ
Clearfield Inc
TELECOMMUNICATIONS - Cables / Satalite Equipment
|
$29.96
|
-0.19
-0.63% |
$30.88
|
146,329
92.03% of 50 DAV
50 DAV is 159,000
|
$38.75
-22.68%
|
1/20/2021
|
$31.38
|
PP = $28.42
|
|
MB = $29.84
|
Most Recent Note - 3/8/2021 5:19:19 PM
G - Slumped further below its 50 DMA line ($30.96) raising concerns and triggering a technical sell signal during a streak of 5 consecutive losses. Prior highs in the $28 area define the next near-term support to watch. Fundamentals remain strong.
>>> FEATURED STOCK ARTICLE : Consolidating Well Above 50-Day Moving Average Line - 2/24/2021 |
View all notes |
Set NEW NOTE alert |
Company Profile |
SEC
News |
Chart |
Request a new note
C
A
S
I |
SMPL
-
NASDAQ
Simply Good Foods Co
Food-Confectionery
|
$30.50
|
+0.17
0.56% |
$31.06
|
351,130
30.88% of 50 DAV
50 DAV is 1,137,000
|
$32.03
-4.78%
|
12/28/2020
|
$30.40
|
PP = $31.44
|
|
MB = $33.01
|
Most Recent Note - 3/8/2021 5:29:33 PM
Y - Posted a 3rd consecutive gain today with below average volume. Its 50 DMA line ($29.16) recently acted as support. Its Relative Strength Rating is 80, right at the minimum guideline for buy candidates. Its prior low ($26.78) defines the next important near term support to watch. See the latest FSU analysis for more details and an annotated graph.
>>> FEATURED STOCK ARTICLE : Found Support at 50-Day Moving Average; Relative Strength Improved - 3/5/2021 |
View all notes |
Set NEW NOTE alert |
Company Profile |
SEC
News |
Chart |
Request a new note
C
A
S
I |
Symbol/Exchange
Company Name
Industry Group |
PRICE |
CHANGE
(%Change) |
Day High |
Volume
(% DAV)
(% 50 day avg vol) |
52 Wk Hi
% From Hi |
Featured
Date |
Price
Featured |
Pivot Featured |
|
Max Buy |
DT
-
NYSE
Dynatrace Inc
Computer Sftwr-Enterprse
|
$47.88
|
-2.05
-4.11% |
$51.19
|
1,990,210
78.14% of 50 DAV
50 DAV is 2,547,000
|
$56.77
-15.66%
|
2/4/2021
|
$51.39
|
PP = $48.95
|
|
MB = $51.40
|
Most Recent Note - 3/8/2021 5:23:16 PM
G - Pulled back with below average volume today, testing prior highs in the $48 area and its 50 DMA line ($47.12). More damaging losses would raise serious concerns. Its Relative Strength Rating has slumped to 71. Fundamentals remain strong after it reported Dec '20 earnings +70% on +28% sales revenues versus the year ago period.
>>> FEATURED STOCK ARTICLE : Consolidating Above Prior Highs and 50-Day Moving Average - 3/3/2021 |
View all notes |
Set NEW NOTE alert |
Company Profile |
SEC
News |
Chart |
Request a new note
C
A
S
I |
MRBK
-
NASDAQ
Meridian Corp
Banks-Northeast
|
$26.47
|
+0.35
1.34% |
$26.54
|
29,484
105.30% of 50 DAV
50 DAV is 28,000
|
$26.94
-1.74%
|
2/22/2021
|
$25.58
|
PP = $26.10
|
|
MB = $27.41
|
Most Recent Note - 3/8/2021 5:26:35 PM
Y - Posted a 4th consecutive gain today with near average volume, rising above the pivot point and challenging its 52-week high. Pivot point cited was based on its 12/18/21 high plus 10 cents. Repeatedly noted - "Subsequent gains and a strong close above its pivot point backed by at least +40% above average volume may help clinch a convincing technical buy signal. Fundamentals are strong.
>>> FEATURED STOCK ARTICLE : Negative Reversal When Poised to Convincingly Breakout - 2/22/2021 |
View all notes |
Set NEW NOTE alert |
Company Profile |
SEC
News |
Chart |
Request a new note
C
A
S
I |
|
|
|
THESE ARE NOT BUY RECOMMENDATIONS!
Comments contained in the body of this report are technical
opinions only. The material herein has been obtained
from sources believed to be reliable and accurate, however,
its accuracy and completeness cannot be guaranteed.
This site is not an investment advisor, hence it does
not endorse or recommend any securities or other investments.
Any recommendation contained in this report may not
be suitable for all investors and it is not to be deemed
an offer or solicitation on our part with respect to
the purchase or sale of any securities. All trademarks,
service marks and trade names appearing in this report
are the property of their respective owners, and are
likewise used for identification purposes only.
This report is a service available
only to active Paid Premium Members.
You may opt-out of receiving report notifications
at any time. Questions or comments may be submitted
by writing to Premium Membership Services 665 S.E. 10 Street, Suite 201 Deerfield Beach, FL 33441-5634 or by calling 1-800-965-8307
or 954-785-1121.
|
|
|


 2
2