You are not logged in.
This means you
CAN ONLY VIEW reports that were published prior to Friday, April 18, 2025.
You
MUST UPGRADE YOUR MEMBERSHIP if you want to see any current reports.
AFTER MARKET UPDATE - MONDAY, JANUARY 27TH, 2025
Previous After Market Report Next After Market Report >>>
|
|
|
|
DOW |
+289.33 |
44,713.58 |
+0.65% |
|
Volume |
1,147,271,986 |
+21% |
|
Volume |
9,041,202,700 |
+14% |
|
NASDAQ |
-612.47 |
19,341.83 |
-3.07% |
|
Advancers |
1,570 |
57% |
|
Advancers |
1,813 |
41% |
|
S&P 500 |
-88.96 |
6,012.28 |
-1.46% |
|
Decliners |
1,193 |
43% |
|
Decliners |
2,586 |
59% |
|
Russell 2000 |
-23.71 |
2,284.02 |
-1.03% |
|
52 Wk Highs |
80 |
|
|
52 Wk Highs |
89 |
|
|
S&P 600 |
-4.99 |
1,450.31 |
-0.34% |
|
52 Wk Lows |
19 |
|
|
52 Wk Lows |
135 |
|
|
 |
Leadership Waned as NVIDIA Loss Raised Market Concerns
Kenneth J. Gruneisen - Passed the CAN SLIM® Master's Exam
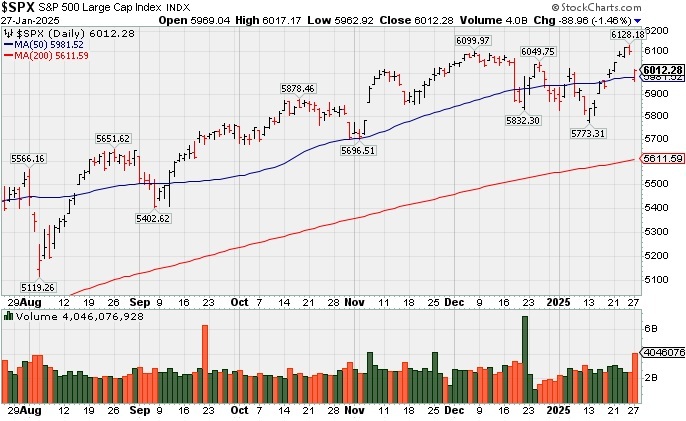
The Nasdaq Composite Index fell -3.07% and the S&P 500 Index fell -1.46%. Meanwhile, the Dow Jones Industrial Average rose +0.7%, with 20 of its 30 components finishing Monday's session in the green. Volume totals reported were higher than the prior session totals on the NYSE and on the Nasdaq exchange. On the NYSE advancing issues led decliners by a 3-to-2 ratio, but decliners outpaced advancers at the Nasdaq by a 3-to-2 margin. There were 24 high-ranked companies from the Leaders List that hit new 52-week highs and were listed on the BreakOuts Page, versus 47 on the prior session. New 52-week highs totals contracted but still outnumbered new 52-week lows on the NYSE, however new lows outnumbered new highs on the Nasdaq exchange. The major indices shook off recent pressure (M criteria) as leadership has improved meaningfully, however healthy leadership remains necessary in order to avoid a more worrisome correction. Disciplined investors know to only buy stocks meeting all key criteria as they emerge from properly formed bases.
PICTURED: The S&P 500 Index abruptly pulled back today testing its 50-day moving average (DMA) line.
Six S&P 500 sectors closed higher while five ended lower. NVIDIA (NVDA -16.97%) suffered its largest single-day loss in market capitalization ever as recent concerns were raised over China’s DeepSeek AI model. Caution was palpable ahead of a busy earnings week during which almost 40% of the S&P 500 by market capitalization will report. That will include two of the three $3 trillion companies Apple (AAPL +3.18%) and Microsoft (MSFT -2.14%).
The 10-year yield dropped ten basis points to 4.53% and the 2-year yield fell eight basis points to 4.19%. A fresh $69 billion 2-yr note sale met tepid demand while a $70 billion 5-yr note offering attracted stronger demand.
|
 Kenneth J. Gruneisen started out as a licensed stockbroker in August 1987, a couple of months prior to the historic stock market crash that took the Dow Jones Industrial Average down -22.6% in a single day. He has published daily fact-based fundamental and technical analysis on high-ranked stocks online for two decades. Through FACTBASEDINVESTING.COM, Kenneth provides educational articles, news, market commentary, and other information regarding proven investment systems that work in good times and bad.
Comments contained in the body of this report are technical opinions only and are not necessarily those of Gruneisen Growth Corp. The material herein has been obtained from sources believed to be reliable and accurate, however, its accuracy and completeness cannot be guaranteed. Our firm, employees, and customers may effect transactions, including transactions contrary to any recommendation herein, or have positions in the securities mentioned herein or options with respect thereto. Any recommendation contained in this report may not be suitable for all investors and it is not to be deemed an offer or solicitation on our part with respect to the purchase or sale of any securities. |
|
 |
Tech Sector Had a Negative Bias as Retail and Bank Indexes Rose
Kenneth J. Gruneisen - Passed the CAN SLIM® Master's Exam
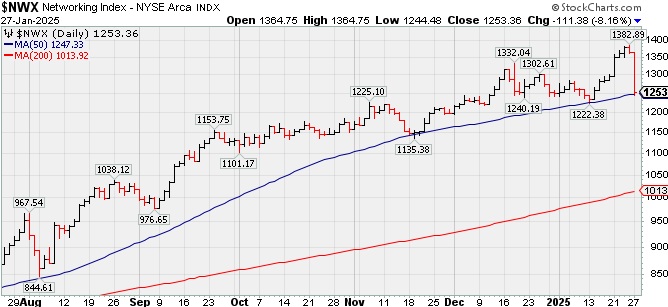
The Retail Index ($RLX +0.77%) and the Bank Index ($BKX +0.42%) both posted small gains but the Broker/Dealer Index ($XBD -1.59%) ended lower. The tech sector saw a clearly negative bias as the Networking Index ($NWX -8.16%) and the Semiconductor Index ($SOX -9.15%) both suffered large losses. The Biotech Index ($BTK +0.31%) eked out a small gain. Commodity-linked groups also had a negative bias as the Gold & Silver Index ($XAU -2.09%) and the Oil Services Index ($OSX -1.75%) both slumped while the Integrated Oil Index ($XOI +0.37%) eked out a small gain.
PICTURED: The Networking Index ($NWX -8.16%) abruptly pulled back to its 50-day moving average (DMA) line with a big loss.
| Oil Services |
$OSX |
74.47 |
-1.32 |
-1.75% |
+2.57% |
| Integrated Oil |
$XOI |
1,887.67 |
+6.87 |
+0.37% |
+7.04% |
| Semiconductor |
$SOX |
4,853.24 |
-488.70 |
-9.15% |
-2.54% |
| Networking |
$NWX |
1,253.36 |
-111.38 |
-8.16% |
+0.38% |
| Broker/Dealer |
$XBD |
881.88 |
-14.28 |
-1.59% |
+9.50% |
| Retail Index |
$RLX |
5,509.61 |
+42.13 |
+0.77% |
+6.48% |
| Gold & Silver |
$XAU |
147.75 |
-3.15 |
-2.09% |
+7.70% |
| Bank |
$BKX |
138.26 |
+0.58 |
+0.42% |
+8.46% |
| Biotech |
$BTK |
6,217.36 |
+19.33 |
+0.31% |
+8.21% |
|
|
|
 |
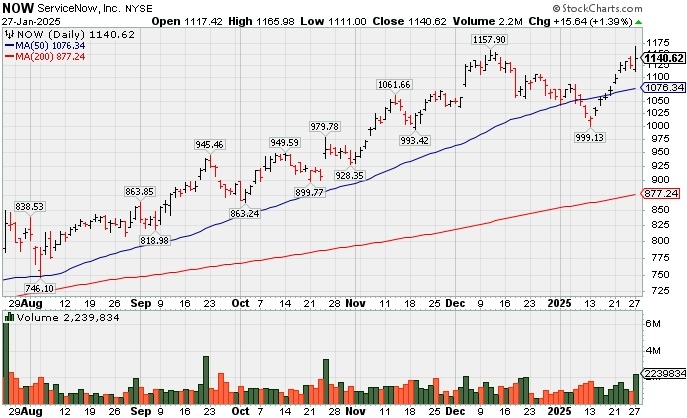
Hit New High but Ended Session Below the New Pivot Point Cited
Kenneth J. Gruneisen - Passed the CAN SLIM® Master's Exam
ServiceNow Inc (NOW +$15.64 or +1.39% to $1,140.62) hit yet another new all-time high with today's gain backed by +84% above average volume, but it ended the session near the middle of its intra-day range and below the new pivot point. Its color code was changed to yellow when highlighted in the earlier mid-day report (read here) with new pivot point cited based on its 12/04/24 high plus 10 cents after a short flat base. NOW found prompt support after briefly undercutting its 50-day moving average (DMA) line ($1,076). A subsequent gain and strong close above the pivot point backed by at least +40% above average volume may clinch a proper new (or add-on) technical buy signal.
It has an Earnings oper Share Rating of 99 and fundamentals remain strong after it reported Sep '24 quarterly earnings +27% on +22% sales revenues versus the year-ago period. Annual earnings growth has been strong and steady. It was last shown in this FSU section on 4/11/24 with an annotated graph under the headline, "Quietly Consolidating Near 50-Day Moving Average Line", and it was dropped from the Featured Stocks list on 4/19/24. It repaired a 200 DMA line violation quickly and gradually rebounded and climbed into new high territory.
The Computer Software - Enterprise group is currently ranked 16th on the 197 Industry Groups list with a Group Relative Strength Rating of A+ (92). The number of top-rated funds owning its shares rose from 3,287 in Mar '23 to 4.327 in Dec '24, a reassuring sign concerning the I criteria. It has a Timeliness Rating of A and a Sponsorship Rating of A. Its current Up/Down Volume Ratio of 1.3 is an unbiased indication its shares have been under slight accumulation over the past 50 days. Charts courtesy www.stockcharts.com
Symbol/Exchange
Company Name
Industry Group | PRICE | CHANGE
(%Change) | Day High | Volume
(% DAV)
(% 50 day avg vol) | 52 Wk Hi
% From Hi | Featured
Date | Price
Featured | Pivot Featured | | Max Buy |  GVA - NYSE GVA - NYSE
Granite Construction
Bldg-Heavy Construction | $86.23 | -5.26
-5.75% | $90.10 | 930,705
177.96% of 50 DAV
50 DAV is 523,000 | $105.20
-18.03%
| 6/11/2024 | $59.76 | PP = $64.33 | | MB = $67.55 |  Most Recent Note - 1/27/2025 6:36:42 PM Most Recent Note - 1/27/2025 6:36:42 PM
It will be dropped from the Featured Stocks list tonight. Volume was above average behind today''s big 4th consecutive loss while slumping well below its 50 DMA line ($93.62), testing near the prior low ($85.56 on 1/13/25) which defines the next important support. A "negative reversal" was noted on 12/05/24 back at its all-time high. Reported Sep ''24 quarterly earnings +19% on +14% sales revenues versus the year-ago period, repeatedly noted as "below the +25% minimum guideline (C criteria) of the fact-based investment system."
>>> FEATURED STOCK ARTICLE : Negative Reversal After Hitting New All-Time High - 12/6/2024 | View all notes | Set NEW NOTE alert | Company Profile | SEC News | Chart | Request a new note C A S I | TXRH - NASDAQ
Texas Roadhouse Inc
LEISURE - Restaurants | $181.19 | +2.64
1.48% | $182.37 | 947,077
134.47% of 50 DAV
50 DAV is 704,300 | $206.04
-12.06%
| 7/26/2024 | $173.08 | PP = $175.82 | | MB = $184.61 | Most Recent Note - 1/27/2025 6:43:10 PM
G - Posted again today with +34% above average volume, finding support above its 200 DMA line ($174.70). Lingering below its 50 DMA line ($188) in recent weeks, a rebound above that important short-term average is needed for its outlook to improve.
>>> FEATURED STOCK ARTICLE : Lingering Below 50-Day Moving Average Line - 1/23/2025 | View all notes | Set NEW NOTE alert | Company Profile | SEC News | Chart | Request a new note C A S I | HWM - NYSE
Howmet Aerospace
Aerospace/Defense | $122.08 | -4.95
-3.90% | $124.72 | 3,447,591
141.29% of 50 DAV
50 DAV is 2,440,000 | $129.10
-5.44%
| 1/8/2025 | $115.05 | PP = $120.81 | | MB = $126.85 | Most Recent Note - 1/27/2025 6:45:41 PM
Y - Gapped down today suffering a big volume-driven loss, retreating from its all-time high. Recent volume-driven gains above the pivot point triggered a new (or add-on) technical buy signal. Near-term support to watch is the prior high ($120.71 on 1/06/25) and its 50 DMA line ($116). Fundamentals remain strong.
>>> FEATURED STOCK ARTICLE : Extended From Prior Base and Perched at High - 12/5/2024 | View all notes | Set NEW NOTE alert | Company Profile | SEC News | Chart | Request a new note C A S I | NGVC - NYSE
Natural Grocers
Retail-Super/Mini Mkts | $41.69 | +0.19
0.46% | $42.60 | 96,937
84.29% of 50 DAV
50 DAV is 115,000 | $47.57
-12.36%
| 11/5/2024 | $30.57 | PP = $30.42 | | MB = $31.94 | Most Recent Note - 1/27/2025 6:54:15 PM
G - Posted a gain today with below average volume, and it has been finding support recently at its 50 DMA line ($40.51). More damaging losses would raise serious concerns and trigger a worrisome technical sell signal. Reported Sep ''24 quarterly earnings +50% on +9% sales revenues versus the year-ago period.
>>> FEATURED STOCK ARTICLE : Consolidating After Considerable Rally to New Highs - 12/16/2024 | View all notes | Set NEW NOTE alert | Company Profile | SEC News | Chart | Request a new note C A S I | CLS - NYSE
Celestica
Elec-Contract Mfg | $87.36 | -34.33
-28.21% | $107.73 | 16,968,609
751.49% of 50 DAV
50 DAV is 2,258,000 | $131.23
-33.43%
| 10/11/2024 | $57.62 | PP = $63.59 | | MB = $66.77 | Most Recent Note - 1/27/2025 6:32:28 PM
G - Gapped down today and abruptly retreated from its all-time high, violating its 50 DMA line ($95) with a damaging loss on heavy volume triggering a technical sell signal.
>>> FEATURED STOCK ARTICLE : New High After 6th Consecutive Gain - 1/22/2025 | View all notes | Set NEW NOTE alert | Company Profile | SEC News | Chart | Request a new note C A S I | Symbol/Exchange
Company Name
Industry Group | PRICE | CHANGE
(%Change) | Day High | Volume
(% DAV)
(% 50 day avg vol) | 52 Wk Hi
% From Hi | Featured
Date | Price
Featured | Pivot Featured | | Max Buy | PAY - NYSE
Paymentus Holdings
Finance-CrdtCard/PmtPr | $29.90 | -0.49
-1.61% | $30.36 | 303,540
56.42% of 50 DAV
50 DAV is 538,000 | $38.94
-23.22%
| 1/3/2025 | $34.21 | PP = $38.94 | | MB = $40.89 | Most Recent Note - 1/27/2025 6:48:18 PM
It will be dropped from the Featured Stocks list tonight. Suffered a 4th consecutive loss today, slumping well below its 50 DMA line toward the prior low ($29.11 on 1/13/25). A rebound above the 50 DMA line is needed for its outlook to improve.
>>> FEATURED STOCK ARTICLE : Losses Below 50-Day Moving Average Hurt Outlook - 1/8/2025 | View all notes | Set NEW NOTE alert | Company Profile | SEC News | Chart | Request a new note C A S I | RMD - NYSE
Resmed Inc
HEALTH SERVICES - Medical Appliances and Equipment | $254.70 | +4.19
1.67% | $258.70 | 1,252,848
162.12% of 50 DAV
50 DAV is 772,800 | $260.49
-2.22%
| 10/25/2024 | $256.64 | PP = $255.28 | | MB = $268.04 | Most Recent Note - 1/27/2025 6:49:51 PM
Y - Posted a solid volume-driven gain today nearly challenging its 52-week high. Faces very little near-term resistance due to overhead supply up to the $260 level. Its Relative Strength Rating is 82, above the 80+ minimum guideline for buy candidates.
>>> FEATURED STOCK ARTICLE : Recent Slump Below 50-Day Moving Average Raised Concerns - 11/18/2024 | View all notes | Set NEW NOTE alert | Company Profile | SEC News | Chart | Request a new note C A S I | ATGE - NYSE
Adtalem Global Education
Consumer Svcs-Education | $97.20 | -2.42
-2.43% | $99.76 | 331,146
88.07% of 50 DAV
50 DAV is 376,000 | $100.54
-3.32%
| 12/31/2024 | $91.50 | PP = $93.03 | | MB = $97.68 | Most Recent Note - 1/27/2025 6:30:50 PM
G - Pulled back today with near average volume, retreating after wedging to new all-time highs above its "max buy" level. It did not produce gains above its pivot point with heavy enough volume to trigger a proper new (or add-on) technical buy signal. Its 50 DMA line ($91.72) defines initial support to watch. Fundamentals remain strong.
>>> FEATURED STOCK ARTICLE : Hovering Near High With Volume Totals Cooling - 12/4/2024 | View all notes | Set NEW NOTE alert | Company Profile | SEC News | Chart | Request a new note C A S I | TW - NASDAQ
Tradeweb Markets
Financial Svcs-Specialty | $128.14 | -2.86
-2.18% | $130.00 | 807,354
94.54% of 50 DAV
50 DAV is 854,000 | $141.69
-9.56%
| 11/19/2024 | $134.41 | PP = $136.23 | | MB = $143.04 | Most Recent Note - 1/27/2025 6:41:16 PM
Gapped down today and it will be dropped from the Featured Stocks list tonight. It has been lingering below its 50 DMA line which has acted as resistance. Its Relative Strength Rating is 80, right at the 80+ minimum guideline for buy candidates. Prior lows in the $125 area define the next very important support level to watch. More damaging losses would raise serious concerns. A rebound above the 50 DMA line ($132) is needed for its outlook to improvE.
>>> FEATURED STOCK ARTICLE : Tradeweb Markets Perched Near High - 11/19/2024 | View all notes | Set NEW NOTE alert | Company Profile | SEC News | Chart | Request a new note C A S I | ATAT - NASDAQ
Atour Lifestyle Hldgs ADR
Leisure-Lodging | $27.09 | -0.22
-0.81% | $27.63 | 859,907
69.52% of 50 DAV
50 DAV is 1,237,000 | $29.90
-9.40%
| 12/9/2024 | $29.34 | PP = $29.25 | | MB = $30.71 | Most Recent Note - 1/24/2025 11:56:09 PM
Y - Color code is changed to yellow after a solid rebound above its 50 DMA line helped its outlook to improve.
>>> FEATURED STOCK ARTICLE : Volume Above Average Behind Breakout Gain - 12/9/2024 | View all notes | Set NEW NOTE alert | Company Profile | SEC News | Chart | Request a new note C A S I | Symbol/Exchange
Company Name
Industry Group | PRICE | CHANGE
(%Change) | Day High | Volume
(% DAV)
(% 50 day avg vol) | 52 Wk Hi
% From Hi | Featured
Date | Price
Featured | Pivot Featured | | Max Buy | CRAI - NASDAQ
CRA International
Comml Svcs-Consulting | $182.96 | -5.50
-2.92% | $187.97 | 31,791
93.50% of 50 DAV
50 DAV is 34,000 | $210.70
-13.17%
| 12/17/2024 | $208.34 | PP = $208.48 | | MB = $218.90 | Most Recent Note - 1/27/2025 6:38:49 PM
Still sputtering below its 50 DMA line which has acted as resistance, and it will be dropped from the Featured Stocks list tonight. A rebound above the 50 DMA line ($189) is needed for its outlook to improve. Its 200 DMA line ($174.74) and prior low define important near-term support. Fundamentals remain strong.
>>> FEATURED STOCK ARTICLE : Volume-Driven Gain for New High Triggered Technical Buy Signal - 12/17/2024 | View all notes | Set NEW NOTE alert | Company Profile | SEC News | Chart | Request a new note C A S I | LRN - NYSE
Stride
Consumer Svcs-Education | $118.91 | -0.47
-0.39% | $120.86 | 960,176
138.75% of 50 DAV
50 DAV is 692,000 | $120.60
-1.40%
| 1/10/2025 | $114.31 | PP = $112.90 | | MB = $118.55 | Most Recent Note - 1/27/2025 6:53:09 PM
G - Color code is changed to green after it pulled back today with +39% above average volume following a streak of 7 consecutive gains with lackluster volume. It wedged above the pivot point cited based on its 12/04/24 high and hitting new all-time highs. Fundamentals remain strong. Prior high ($112.80 on 12/04/24) defines near-term support above its 50 DMA line ($107.73.
>>> FEATURED STOCK ARTICLE : Encountered Distributional Pressure Amid Broader Weakness - 1/10/2025 | View all notes | Set NEW NOTE alert | Company Profile | SEC News | Chart | Request a new note C A S I | HUBS - NYSE
HubSpot
Comp Sftwr-Spec Enterprs | $758.43 | +31.82
4.38% | $779.73 | 892,884
202.47% of 50 DAV
50 DAV is 441,000 | $762.47
-0.53%
| 1/27/2025 | $768.96 | PP = $762.57 | | MB = $800.70 | Most Recent Note - 1/27/2025 1:12:53 PM
Y - Color code is changed to yellow with new pivot point cited based on its 12/04/24 high plus 10 cents. Rallying from support near its 50 DMA line ($716) and hitting a new 52-week high with today's big volume-driven gain. A gain and strong close above the pivot point may clinch a technical buy signal. Fundamentals remain strong. It went through a deep consolidation and rebounded since dropped from the Featured Stocks list when last noted on 5/02/24.
>>> FEATURED STOCK ARTICLE : HUBS Testing 50-day Moving Average Line Again - 4/25/2024 | View all notes | Set NEW NOTE alert | Company Profile | SEC News | Chart | Request a new note C A S I | NOW - NYSE
ServiceNow
Computer Sftwr-Enterprse | $1,140.62 | +15.64
1.39% | $1,165.98 | 2,239,778
184.50% of 50 DAV
50 DAV is 1,214,000 | $1,157.90
-1.49%
| 1/27/2025 | $771.75 | PP = $1,158.00 | | MB = $1,215.90 | Most Recent Note - 1/27/2025 1:25:30 PM
Y - Hitting yet another new all-time high with today's volume-driven gain. Color code is changed to yellow with new pivot point cited based on its 12/04/24 high plus 10 cents after a short flat base. Found prompt support after briefly undercutting its 50 DMA line ($1,076). A gain and strong close above the pivot point backed by at least +40% above average volume may clinch a new (or add-on) technical buy signal. Fundamentals remain strong after it reported Sep '24 quarterly earnings +27% on +22% sales revenues versus the year-ago period. It was dropped from the Featured Stocks list on 4/19/24.
>>> FEATURED STOCK ARTICLE : Hit New High but Ended Session Below the New Pivot Point Cited - 1/27/2025 | View all notes | Set NEW NOTE alert | Company Profile | SEC News | Chart | Request a new note C A S I |
|
|
|
Color Codes Explained :
Y - Better candidates highlighted by our
staff of experts.
G - Previously featured
in past reports as yellow but may no longer be buyable under the
guidelines.
***Last / Change / Volume data in this table is the closing quote data***
Symbol/Exchange
Company Name
Industry Group |
PRICE |
CHANGE
(%Change) |
Day High |
Volume
(% DAV)
(% 50 day avg vol) |
52 Wk Hi
% From Hi |
Featured
Date |
Price
Featured |
Pivot Featured |
|
Max Buy |
 GVA
-
NYSE
GVA
-
NYSE
Granite Construction
Bldg-Heavy Construction
|
$91.49
|
-1.35
-1.45% |
$92.84
|
509,955
96.40% of 50 DAV
50 DAV is 529,000
|
$105.20
-13.03%
|
6/11/2024
|
$59.76
|
PP = $64.33
|
|
MB = $67.55
|
Most Recent Note - 1/21/2025 3:48:20 PM
G - Posting a 6th consecutive gain today rising above its 50 DMA line ($94) helping its outlook to improve. Slumped after a noted "negative reversal" at its all-time high. Reported Sep '24 quarterly earnings +19% on +14% sales revenues versus the year-ago period, repeatedly noted as "below the +25% minimum guideline (C criteria) of the fact-based investment system."
>>> FEATURED STOCK ARTICLE : Negative Reversal After Hitting New All-Time High - 12/6/2024 |
View all notes |
Set NEW NOTE alert |
Company Profile |
SEC
News |
Chart |
Request a new note
C
A
S
I |
TXRH
-
NASDAQ
Texas Roadhouse Inc
LEISURE - Restaurants
|
$178.55
|
-0.58
-0.32% |
$178.86
|
854,820
122.66% of 50 DAV
50 DAV is 696,900
|
$206.04
-13.34%
|
7/26/2024
|
$173.08
|
PP = $175.82
|
|
MB = $184.61
|
Most Recent Note - 1/23/2025 7:22:47 PM
G - Sputtering yet still finding support above its 200 DMA line ($174.40) but lingering below its 50 DMA line ($188.86) in recent weeks. A rebound above the 50 DMA line is still needed for its outlook to improve. See the latest FSU analysis for more details and a new annotated graph.
>>> FEATURED STOCK ARTICLE : Lingering Below 50-Day Moving Average Line - 1/23/2025 |
View all notes |
Set NEW NOTE alert |
Company Profile |
SEC
News |
Chart |
Request a new note
C
A
S
I |
HWM
-
NYSE
Howmet Aerospace
Aerospace/Defense
|
$127.03
|
-0.71
-0.56% |
$127.55
|
2,102,857
86.25% of 50 DAV
50 DAV is 2,438,000
|
$129.10
-1.60%
|
1/8/2025
|
$115.05
|
PP = $120.81
|
|
MB = $126.85
|
Most Recent Note - 1/22/2025 5:07:13 PM
Y - Paused today near its "max buy" level after 6 consecutive gains for new all-time highs. Recent volume-driven gains above the pivot point triggered a new (or add-on) technical buy signal. Found support recently above the prior high ($106.93 on 10/21/24). Fundamentals remain strong.
>>> FEATURED STOCK ARTICLE : Extended From Prior Base and Perched at High - 12/5/2024 |
View all notes |
Set NEW NOTE alert |
Company Profile |
SEC
News |
Chart |
Request a new note
C
A
S
I |
NGVC
-
NYSE
Natural Grocers
Retail-Super/Mini Mkts
|
$41.50
|
-0.04
-0.10% |
$41.90
|
90,740
78.90% of 50 DAV
50 DAV is 115,000
|
$47.57
-12.76%
|
11/5/2024
|
$30.57
|
PP = $30.42
|
|
MB = $31.94
|
Most Recent Note - 1/21/2025 3:49:43 PM
G - Gapped up today but retreated from its early high. Found support at its 50 DMA line ($40). More damaging losses would raise serious concerns and trigger a worrisome technical sell signal. Reported Sep '24 quarterly earnings +50% on +9% sales revenues versus the year-ago period.
>>> FEATURED STOCK ARTICLE : Consolidating After Considerable Rally to New Highs - 12/16/2024 |
View all notes |
Set NEW NOTE alert |
Company Profile |
SEC
News |
Chart |
Request a new note
C
A
S
I |
CLS
-
NYSE
Celestica
Elec-Contract Mfg
|
$121.69
|
-1.23
-1.00% |
$126.01
|
2,410,214
106.88% of 50 DAV
50 DAV is 2,255,000
|
$131.23
-7.27%
|
10/11/2024
|
$57.62
|
PP = $63.59
|
|
MB = $66.77
|
Most Recent Note - 1/22/2025 1:10:38 PM
G - Extended from any sound base and hitting yet another new all-time high with today's 6th consecutive gain. Its 50 DMA line ($94) defines initial support to watch on pullbacks.
>>> FEATURED STOCK ARTICLE : New High After 6th Consecutive Gain - 1/22/2025 |
View all notes |
Set NEW NOTE alert |
Company Profile |
SEC
News |
Chart |
Request a new note
C
A
S
I |
Symbol/Exchange
Company Name
Industry Group |
PRICE |
CHANGE
(%Change) |
Day High |
Volume
(% DAV)
(% 50 day avg vol) |
52 Wk Hi
% From Hi |
Featured
Date |
Price
Featured |
Pivot Featured |
|
Max Buy |
PAY
-
NYSE
Paymentus Holdings
Finance-CrdtCard/PmtPr
|
$30.39
|
-0.23
-0.75% |
$31.01
|
207,244
38.45% of 50 DAV
50 DAV is 539,000
|
$38.94
-21.96%
|
1/3/2025
|
$34.21
|
PP = $38.94
|
|
MB = $40.89
|
Most Recent Note - 1/21/2025 3:43:48 PM
G - Rebounding toward its 50 DMA line with today's big gain after noted losses backed by above average volume. A rebound above the 50 DMA line ($33.37) is needed for its outlook to improve.
>>> FEATURED STOCK ARTICLE : Losses Below 50-Day Moving Average Hurt Outlook - 1/8/2025 |
View all notes |
Set NEW NOTE alert |
Company Profile |
SEC
News |
Chart |
Request a new note
C
A
S
I |
RMD
-
NYSE
ResMed
Medical-Products
|
$250.51
|
+1.63
0.65% |
$250.76
|
778,470
100.45% of 50 DAV
50 DAV is 775,000
|
$260.49
-3.83%
|
10/25/2024
|
$256.64
|
PP = $255.28
|
|
MB = $268.04
|
Most Recent Note - 1/21/2025 3:45:22 PM
Y - Gapped up today rebounding above its 50 DMA line ($239.49) helping its outlook to improve and its color code is changed to yellow. Its Relative Strength Rating is 83, at the 80+ minimum guideline for buy candidates. Faces near-term resistance due to overhead supply up to the $260 level.
>>> FEATURED STOCK ARTICLE : Recent Slump Below 50-Day Moving Average Raised Concerns - 11/18/2024 |
View all notes |
Set NEW NOTE alert |
Company Profile |
SEC
News |
Chart |
Request a new note
C
A
S
I |
ATGE
-
NYSE
Adtalem Global Education
Consumer Svcs-Education
|
$99.62
|
-0.73
-0.73% |
$100.36
|
213,973
55.87% of 50 DAV
50 DAV is 383,000
|
$100.54
-0.92%
|
12/31/2024
|
$91.50
|
PP = $93.03
|
|
MB = $97.68
|
Most Recent Note - 1/17/2025 10:06:48 AM
G - After a noted "positive reversal" today's 4th consecutive gain has it wedging to new all-time highs above its "max buy" level and its color code is changed to green. New pivot point was cited based on its 11/06/24 high plus 10 cents. It did not produce gains above its pivot point with heavy enough volume to trigger a proper new (or add-on) technical buy signal. Its 50 DMA line ($90.34) defines initial support above the prior low ($84.79 on 12/18/24). Fundamentals remain strong.
>>> FEATURED STOCK ARTICLE : Hovering Near High With Volume Totals Cooling - 12/4/2024 |
View all notes |
Set NEW NOTE alert |
Company Profile |
SEC
News |
Chart |
Request a new note
C
A
S
I |
TW
-
NASDAQ
Tradeweb Markets
Financial Svcs-Specialty
|
$131.00
|
+0.00
0.00% |
$132.14
|
866,044
101.77% of 50 DAV
50 DAV is 851,000
|
$141.69
-7.54%
|
11/19/2024
|
$134.41
|
PP = $136.23
|
|
MB = $143.04
|
Most Recent Note - 1/22/2025 5:11:56 PM
G - Its Relative Strength Rating has slumped to 77, below the 80+ minimum guideline for buy candidates while lingering below its 50 DMA line. Prior lows in the $125 area define the next very important support level to watch. More damaging losses would raise serious concerns. A rebound above the 50 DMA line ($132) is needed for its outlook to improve and it must produce a volume-driven gain above the pivot point to trigger a proper technical buy signal. It was highlighted in yellow with pivot point cited based on its 10/15/24 high plus 10 cents.
>>> FEATURED STOCK ARTICLE : Tradeweb Markets Perched Near High - 11/19/2024 |
View all notes |
Set NEW NOTE alert |
Company Profile |
SEC
News |
Chart |
Request a new note
C
A
S
I |
ATAT
-
NASDAQ
Atour Lifestyle Hldgs ADR
Leisure-Lodging
|
$27.31
|
+1.16
4.44% |
$27.58
|
1,148,945
93.26% of 50 DAV
50 DAV is 1,232,000
|
$29.90
-8.66%
|
12/9/2024
|
$29.34
|
PP = $29.25
|
|
MB = $30.71
|
Most Recent Note - 1/24/2025 11:56:09 PM
Y - Color code is changed to yellow after a solid rebound above its 50 DMA line helped its outlook to improve.
>>> FEATURED STOCK ARTICLE : Volume Above Average Behind Breakout Gain - 12/9/2024 |
View all notes |
Set NEW NOTE alert |
Company Profile |
SEC
News |
Chart |
Request a new note
C
A
S
I |
Symbol/Exchange
Company Name
Industry Group |
PRICE |
CHANGE
(%Change) |
Day High |
Volume
(% DAV)
(% 50 day avg vol) |
52 Wk Hi
% From Hi |
Featured
Date |
Price
Featured |
Pivot Featured |
|
Max Buy |
CRAI
-
NASDAQ
CRA International
Comml Svcs-Consulting
|
$188.46
|
+0.56
0.30% |
$188.68
|
31,450
92.50% of 50 DAV
50 DAV is 34,000
|
$210.70
-10.56%
|
12/17/2024
|
$208.34
|
PP = $208.48
|
|
MB = $218.90
|
Most Recent Note - 1/21/2025 3:46:41 PM
G - Today's gain with light volume has it rebounding toward its 50 DMA line which may act as resistance. A rebound above the 50 DMA line ($190) is needed for its outlook to improve. Its 200 DMA line ($174) defines important near-term support. Fundamentals remain strong.
>>> FEATURED STOCK ARTICLE : Volume-Driven Gain for New High Triggered Technical Buy Signal - 12/17/2024 |
View all notes |
Set NEW NOTE alert |
Company Profile |
SEC
News |
Chart |
Request a new note
C
A
S
I |
LRN
-
NYSE
Stride
Consumer Svcs-Education
|
$119.38
|
+0.33
0.28% |
$120.39
|
566,082
80.87% of 50 DAV
50 DAV is 700,000
|
$120.60
-1.01%
|
1/10/2025
|
$114.31
|
PP = $112.90
|
|
MB = $118.55
|
Most Recent Note - 1/22/2025 5:09:46 PM
Y - Posted a 5th consecutive gain today with lackluster volume, wedging above the pivot point cited based on its 12/04/24 high and hitting new all-time highs. Fundamentals remain strong. Recently consolidated in an orderly fashion above its 50 DMA line ($106.66). The 1/10/25 mid-day report noted - "A gain and strong close above the pivot point backed by at least +40% above average volume may clinch a technical buy signal."
>>> FEATURED STOCK ARTICLE : Encountered Distributional Pressure Amid Broader Weakness - 1/10/2025 |
View all notes |
Set NEW NOTE alert |
Company Profile |
SEC
News |
Chart |
Request a new note
C
A
S
I |
|
|
|
THESE ARE NOT BUY RECOMMENDATIONS!
Comments contained in the body of this report are technical
opinions only. The material herein has been obtained
from sources believed to be reliable and accurate, however,
its accuracy and completeness cannot be guaranteed.
This site is not an investment advisor, hence it does
not endorse or recommend any securities or other investments.
Any recommendation contained in this report may not
be suitable for all investors and it is not to be deemed
an offer or solicitation on our part with respect to
the purchase or sale of any securities. All trademarks,
service marks and trade names appearing in this report
are the property of their respective owners, and are
likewise used for identification purposes only.
This report is a service available
only to active Paid Premium Members.
You may opt-out of receiving report notifications
at any time. Questions or comments may be submitted
by writing to Premium Membership Services 665 S.E. 10 Street, Suite 201 Deerfield Beach, FL 33441-5634 or by calling 1-800-965-8307
or 954-785-1121.
|
|
|