You are not logged in.
This means you
CAN ONLY VIEW reports that were published prior to Monday, March 31, 2025.
You
MUST UPGRADE YOUR MEMBERSHIP if you want to see any current reports.
AFTER MARKET UPDATE - MONDAY, DECEMBER 16TH, 2024
Previous After Market Report Next After Market Report >>>
|
|
|
|
DOW |
-110.58 |
43,717.48 |
-0.25% |
|
Volume |
1,102,145,287 |
+25% |
|
Volume |
8,824,999,500 |
+41% |
|
NASDAQ |
+247.17 |
20,173.89 |
+1.24% |
|
Advancers |
1,097 |
40% |
|
Advancers |
2,211 |
51% |
|
S&P 500 |
+23.12 |
6,074.21 |
+0.38% |
|
Decliners |
1,657 |
60% |
|
Decliners |
2,141 |
49% |
|
Russell 2000 |
+15.09 |
2,361.99 |
+0.64% |
|
52 Wk Highs |
82 |
|
|
52 Wk Highs |
207 |
|
|
S&P 600 |
+5.42 |
1,494.05 |
+0.36% |
|
52 Wk Lows |
134 |
|
|
52 Wk Lows |
234 |
|
|
 |
Nasdaq Composite Index Hit New Record High
Kenneth J. Gruneisen - Passed the CAN SLIM® Master's Exam
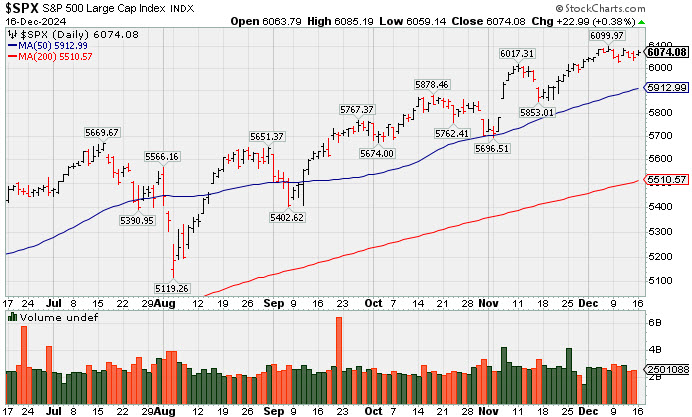
The S&P 500 (+0.4%) and Nasdaq Composite (+1.5%) posted gains but closed off of their session highs, meanwhile, the Dow Jones Industrial Average settled -0.3% lower. Volume was higher than the prior session totals on the NYSE and on the Nasdaq exchange. Decliners led advancers by an 8-5 margin at the NYSE while the mix was even at the Nasdaq exchange. There were 34 high-ranked companies from the Leaders List that hit new 52-week highs and were listed on the BreakOuts Page, versus the total of 18 on the prior session. New 52-week lows outnumbered new 52-week highs on the NYSE and on the Nasdaq exchange. The major indices are in a confirmed uptrend (M criteria). Disciplined investors know that new buying efforts are only to be made in stocks meeting all key criteria of the fact-based investment system.
PICTURED: The S&P 500 Index has been consolidating near its all-time high.
Broadcom (AVGO +11.21%), Alphabet (GOOG +3.54%), and Tesla (TSLA +6.14%) all reached fresh 52-week highs. The communication services (+1.3%), consumer discretionary (+1.7%), and information technology (+1.0%) sectors showed the largest advances among the four sectors in the green. The energy sector registered the largest decline by a wide margin, dropping -2.2% amid sliding oil prices ($70.83/bbl, -0.46, -0.7%). The health care (-1.3%) and materials (-1.0%) sectors also logged solid declines.
The 10-year Treasury yield edged up one basis point to 4.41%, while the 2-year yield rose one basis point to 4.25%. This week features fresh economic data including the November Retail Sales, Industrial Production, Housing Starts, Existing Home Sales, and Personal Income and Spending reports, the latter of which features the Fed's preferred inflation gauge in the PCE Price Index. The FOMC decision on rates is on Wednesday. |
 Kenneth J. Gruneisen started out as a licensed stockbroker in August 1987, a couple of months prior to the historic stock market crash that took the Dow Jones Industrial Average down -22.6% in a single day. He has published daily fact-based fundamental and technical analysis on high-ranked stocks online for two decades. Through FACTBASEDINVESTING.COM, Kenneth provides educational articles, news, market commentary, and other information regarding proven investment systems that work in good times and bad.
Comments contained in the body of this report are technical opinions only and are not necessarily those of Gruneisen Growth Corp. The material herein has been obtained from sources believed to be reliable and accurate, however, its accuracy and completeness cannot be guaranteed. Our firm, employees, and customers may effect transactions, including transactions contrary to any recommendation herein, or have positions in the securities mentioned herein or options with respect thereto. Any recommendation contained in this report may not be suitable for all investors and it is not to be deemed an offer or solicitation on our part with respect to the purchase or sale of any securities. |
|
 |
Tech, Retail, and Finanical Indexes Rose
Kenneth J. Gruneisen - Passed the CAN SLIM® Master's Exam
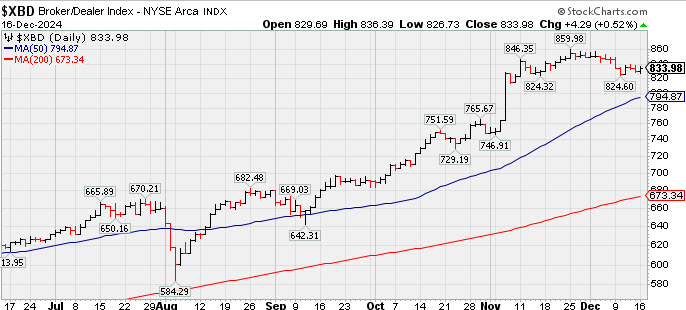
The Retail Index ($RLX +1.24%) outpaced the Broker/Dealer Index ($XBD +0.52%) and the Bank Index ($BKX +0.40%) as each posted gains. The tech sector had a positive bias as the Semiconductor Index ($SOX +2.06%) and the Networking Index ($NWX +2.02%) both posted solid gains and the Biotech Index ($BTK +0.72%) followed with a smaller gain. Commodity-linked groups had a negative bias as the Gold & Silver Index ($XAU -1.00%), Oil Services Index ($OSX -1.82%), and the Integrated Oil Index ($XOI -2.92%) finisahed unanimously to the downside.
PICTURED: The Broker/Dealer Index ($XBD +0.52%) ended higher, consolidating above its 50-day moving average line.
| Oil Services |
$OSX |
73.35 |
-1.36 |
-1.82% |
-12.56% |
| Integrated Oil |
$XOI |
1,768.43 |
-53.12 |
-2.92% |
-5.05% |
| Semiconductor |
$SOX |
5,256.06 |
+106.28 |
+2.06% |
+25.88% |
| Networking |
$NWX |
1,314.40 |
+25.82 |
+2.00% |
+57.83% |
| Broker/Dealer |
$XBD |
833.68 |
+4.00 |
+0.48% |
+49.60% |
| Retail Index |
$RLX |
5,432.39 |
+66.37 |
+1.24% |
+39.69% |
| Gold & Silver |
$XAU |
146.44 |
-1.48 |
-1.00% |
+16.51% |
| Bank |
$BKX |
132.28 |
+0.53 |
+0.40% |
+37.76% |
| Biotech |
$BTK |
5,919.72 |
+43.84 |
+0.75% |
+9.24% |
|
|
|
 |
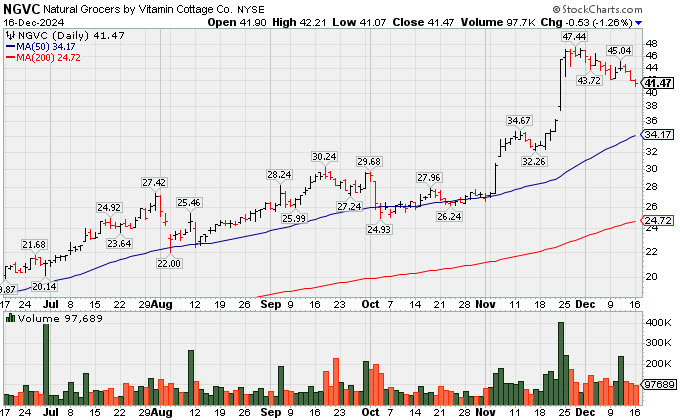
Consolidating After Considerable Rally to New Highs
Kenneth J. Gruneisen - Passed the CAN SLIM® Master's Exam
Natural Grocers (NGVC) has been consolidating after rallying to a new all-time high and it is extended from any sound base. Its 50-day moving average (DMA) line ($34.24) defines initial support to watch above the prior high in the $30 area.
NGVC was highlighted in yellow in the 9/05/24 mid-day report (read here). It was noted that a valid secondary buy point exists up to 5% above the prior high since finding support near its 10 WMA line following an earlier breakout. It was last shown in this FSU section on 11/11/24 with an annotated graph under the headline, "New High After 6th Consecutive Gain".
NGVC reported Sep '24 quarterly earnings +50% on +9% sales revenues versus the year-ago period. It has an Earnings Per Share Rating of 96. Its 6 latest quarterly comparisons were above the +25% minimum earnings guideline (C criteria). Annual earnings growth has been steady (A criteria). The Retail-Super/Mini Markets group is currently ranked 88th on the 197 Industry Groups list. Top-rated funds owning an interest in the company's shares rose from 177 in Sep '23 to 215 in Sep '24, a reassuring sign concerning the I criteria. Its current Up/Down Volume Ratio of 1.8 provides an unbiased indication that its shares have been under slight accumulation over the past 50 days. Its small supply (S criteria) of only 22.8 million shares outstanding can contribute to greater price volatility in the event of institutional buying or selling. Charts courtesy www.stockcharts.com
Symbol/Exchange
Company Name
Industry Group | PRICE | CHANGE
(%Change) | Day High | Volume
(% DAV)
(% 50 day avg vol) | 52 Wk Hi
% From Hi | Featured
Date | Price
Featured | Pivot Featured | | Max Buy |  USLM - NASDAQ USLM - NASDAQ
U.S. Lime & Minerals
Bldg-Cement/Concrt/Ag | $144.01 | -1.93
-1.32% | $147.38 | 74,855
78.79% of 50 DAV
50 DAV is 95,000 | $159.53
-9.73%
| 9/17/2024 | $71.26 | PP = $87.23 | | MB = $91.59 |  Most Recent Note - 12/16/2024 12:46:21 PM Most Recent Note - 12/16/2024 12:46:21 PM
G - Consolidating in an orderly fashion near its all-time high. Its 50 DMA line ($128) defines important near-term support to watch on pullbacks. It has been noted repeatedly as - "Very extended from any sound base".
>>> FEATURED STOCK ARTICLE : Extended From Any Sound Base After Impressive Rally - 11/12/2024 | View all notes | Set NEW NOTE alert | Company Profile | SEC News | Chart | Request a new note C A S I | GVA - NYSE
Granite Construction
Bldg-Heavy Construction | $93.26 | -0.18
-0.19% | $95.28 | 522,776
82.07% of 50 DAV
50 DAV is 637,000 | $105.20
-11.35%
| 6/11/2024 | $59.76 | PP = $64.33 | | MB = $67.55 | Most Recent Note - 12/13/2024 6:58:17 PM
G - Pulled back today for its 6th loss in the span of 8 sessions, slumping from its all-time high toward its 50 DMA line ($90.72). Reported Sep ''24 quarterly earnings +19% on +14% sales revenues versus the year-ago period, repeatedly noted as "below the +25% minimum guideline (C criteria) of the fact-based investment system."
>>> FEATURED STOCK ARTICLE : Negative Reversal After Hitting New All-Time High - 12/6/2024 | View all notes | Set NEW NOTE alert | Company Profile | SEC News | Chart | Request a new note C A S I | TXRH - NASDAQ
Texas Roadhouse
Retail-Restaurants | $187.45 | +0.59
0.32% | $189.60 | 517,628
74.80% of 50 DAV
50 DAV is 692,000 | $206.04
-9.02%
| 7/26/2024 | $173.08 | PP = $175.82 | | MB = $184.61 | Most Recent Note - 12/13/2024 7:01:43 PM
G - Quietly slumped below its 50 DMA line ($190) raising concerns with its 3rd consecutive loss backed by light volume. A prompt rebound above the 50 DMA line is needed for its outlook to improve.
>>> FEATURED STOCK ARTICLE : Hovering Near High After Recent Volume-driven Gains - 11/15/2024 | View all notes | Set NEW NOTE alert | Company Profile | SEC News | Chart | Request a new note C A S I | HWM - NYSE
Howmet Aerospace
Aerospace/Defense | $113.41 | -0.02
-0.02% | $114.31 | 1,329,991
57.65% of 50 DAV
50 DAV is 2,307,000 | $120.71
-6.05%
| 7/30/2024 | $93.95 | PP = $85.52 | | MB = $89.80 | Most Recent Note - 12/12/2024 9:05:36 PM
G - Pulled back today with lighter volume. Retreating from its all-time high after getting extended from any sound base. Its prior high ($106.93 on 10/21/24) and 50 DMA line ($109.47) define near-term support levels to watch on pullbacks. Fundamentals remain strong.
>>> FEATURED STOCK ARTICLE : Extended From Prior Base and Perched at High - 12/5/2024 | View all notes | Set NEW NOTE alert | Company Profile | SEC News | Chart | Request a new note C A S I | NGVC - NYSE
Natural Grocers
Retail-Super/Mini Mkts | $41.53 | -0.47
-1.12% | $42.21 | 117,209
114.91% of 50 DAV
50 DAV is 102,000 | $47.57
-12.70%
| 11/5/2024 | $30.57 | PP = $30.42 | | MB = $31.94 | Most Recent Note - 12/16/2024 4:18:47 PM
G - Pulled back for a 3rd consecutive loss, retreating from its all-time high after getting very extended from any sound base. Reported Sep '24 quarterly earnings +50% on +9% sales revenues versus the year-ago period. Its 50 DMA line ($34.23) defines near-term support above prior highs in the $30 area. See the latest FSU analysis for more details and a new annotated graph..
>>> FEATURED STOCK ARTICLE : Consolidating After Considerable Rally to New Highs - 12/16/2024 | View all notes | Set NEW NOTE alert | Company Profile | SEC News | Chart | Request a new note C A S I | Symbol/Exchange
Company Name
Industry Group | PRICE | CHANGE
(%Change) | Day High | Volume
(% DAV)
(% 50 day avg vol) | 52 Wk Hi
% From Hi | Featured
Date | Price
Featured | Pivot Featured | | Max Buy | CLS - NYSE
Celestica
Elec-Contract Mfg | $99.03 | -0.17
-0.17% | $100.51 | 1,866,168
74.05% of 50 DAV
50 DAV is 2,520,000 | $99.34
-0.31%
| 10/11/2024 | $57.62 | PP = $63.59 | | MB = $66.77 | Most Recent Note - 12/13/2024 7:08:58 PM
G - Gapped up today and rallied with above-average volume to a new all-time high with its 3rd consecutive gain. It is very extended from any sound base. Its 50 DMA line ($76) defines initial support to watch on pullbacks.
>>> FEATURED STOCK ARTICLE : Pulling Back After Considerable Rally - 11/13/2024 | View all notes | Set NEW NOTE alert | Company Profile | SEC News | Chart | Request a new note C A S I | PAY - NYSE
Paymentus Holdings
Finance-CrdtCard/PmtPr | $35.75 | +1.40
4.08% | $35.86 | 339,010
82.69% of 50 DAV
50 DAV is 410,000 | $38.94
-8.19%
| 10/17/2024 | $26.15 | PP = $25.31 | | MB = $26.58 | Most Recent Note - 12/16/2024 12:49:32 PM
G - Consolidating well above its 50 DMA line ($29.68) which defines important near-term support to watch. It is extended from any sound base.
>>> FEATURED STOCK ARTICLE : Extended From Prior Base After Considerable Spike Higher - 11/14/2024 | View all notes | Set NEW NOTE alert | Company Profile | SEC News | Chart | Request a new note C A S I | RMD - NYSE
Resmed Inc
HEALTH SERVICES - Medical Appliances and Equipment | $241.04 | +2.52
1.06% | $241.84 | 491,163
54.27% of 50 DAV
50 DAV is 905,100 | $260.49
-7.47%
| 10/25/2024 | $256.64 | PP = $255.28 | | MB = $268.04 | Most Recent Note - 12/12/2024 9:08:38 PM
G - Pulled back today with higher (near average) volume, sputtering near its 50 DMA line ($242). Its Relative Strength Rating has slumped to 73, below the 80+ minimum guideline for buy candidates, raisingb concerns.
>>> FEATURED STOCK ARTICLE : Recent Slump Below 50-Day Moving Average Raised Concerns - 11/18/2024 | View all notes | Set NEW NOTE alert | Company Profile | SEC News | Chart | Request a new note C A S I | ATGE - NYSE
Adtalem Global Education
Consumer Svcs-Education | $91.24 | +2.49
2.81% | $91.40 | 183,115
52.62% of 50 DAV
50 DAV is 348,000 | $92.93
-1.82%
| 10/30/2024 | $83.34 | PP = $80.28 | | MB = $84.29 | Most Recent Note - 12/16/2024 12:44:56 PM
G - Consolidating in an orderly fashion near its all-time high. Its 50 DMA line ($83.20) defines initial support above prior highs in the $80 area. Fundamentals remain strong.
>>> FEATURED STOCK ARTICLE : Hovering Near High With Volume Totals Cooling - 12/4/2024 | View all notes | Set NEW NOTE alert | Company Profile | SEC News | Chart | Request a new note C A S I | TW - NASDAQ
Tradeweb Markets
Financial Svcs-Specialty | $133.57 | +2.07
1.57% | $133.94 | 663,695
75.08% of 50 DAV
50 DAV is 884,000 | $141.69
-5.73%
| 11/19/2024 | $134.41 | PP = $136.23 | | MB = $143.04 | Most Recent Note - 12/13/2024 7:00:08 PM
Y - Consolidating near its 50 DMA line ($132) after encountering distributional pressure. Since recently featured it has not produced a volume-driven gain above the pivot point to trigger a proper technical buy signal. It was highlighted in yellow with pivot point cited based on its 10/15/24 high plus 10 cents.
>>> FEATURED STOCK ARTICLE : Tradeweb Markets Perched Near High - 11/19/2024 | View all notes | Set NEW NOTE alert | Company Profile | SEC News | Chart | Request a new note C A S I | Symbol/Exchange
Company Name
Industry Group | PRICE | CHANGE
(%Change) | Day High | Volume
(% DAV)
(% 50 day avg vol) | 52 Wk Hi
% From Hi | Featured
Date | Price
Featured | Pivot Featured | | Max Buy | ATAT - NASDAQ
Atour Lifestyle Hldgs ADR
Leisure-Lodging | $26.97 | -0.04
-0.15% | $27.67 | 603,789
46.09% of 50 DAV
50 DAV is 1,310,000 | $29.90
-9.80%
| 12/9/2024 | $29.34 | PP = $29.25 | | MB = $30.71 | Most Recent Note - 12/13/2024 7:04:12 PM
Y - Suffered a loss today with higher volume, raising concerns while slumping near its 50 DMA line ($26.69). A violation would trigger a technical sell signal.
>>> FEATURED STOCK ARTICLE : Volume Above Average Behind Breakout Gain - 12/9/2024 | View all notes | Set NEW NOTE alert | Company Profile | SEC News | Chart | Request a new note C A S I | VEEV - NYSE
Veeva Systems Inc Cl A
Computer Sftwr-Medical | $224.64 | -4.15
-1.81% | $229.61 | 1,853,165
175.71% of 50 DAV
50 DAV is 1,054,700 | $258.93
-13.24%
| 12/9/2024 | $250.70 | PP = $240.68 | | MB = $252.71 | Most Recent Note - 12/16/2024 12:48:00 PM
Y - It has slumped back well into the prior base raising concerns following a noted 12/06/24 "breakaway gap". Reported Oct '24 quarterly earnings +31% on +13% sales revenues versus the year-ago period, its 3rd consecutive quarterly comparison above the +25% minimum earnings guideline (C criteria). Annual earnings growth has been strong.
>>> FEATURED STOCK ARTICLE : Veeva Systems Consolidating After "Breakaway Gap" - 12/10/2024 | View all notes | Set NEW NOTE alert | Company Profile | SEC News | Chart | Request a new note C A S I |
|
|
|
Color Codes Explained :
Y - Better candidates highlighted by our
staff of experts.
G - Previously featured
in past reports as yellow but may no longer be buyable under the
guidelines.
***Last / Change / Volume data in this table is the closing quote data***
|
|
|
THESE ARE NOT BUY RECOMMENDATIONS!
Comments contained in the body of this report are technical
opinions only. The material herein has been obtained
from sources believed to be reliable and accurate, however,
its accuracy and completeness cannot be guaranteed.
This site is not an investment advisor, hence it does
not endorse or recommend any securities or other investments.
Any recommendation contained in this report may not
be suitable for all investors and it is not to be deemed
an offer or solicitation on our part with respect to
the purchase or sale of any securities. All trademarks,
service marks and trade names appearing in this report
are the property of their respective owners, and are
likewise used for identification purposes only.
This report is a service available
only to active Paid Premium Members.
You may opt-out of receiving report notifications
at any time. Questions or comments may be submitted
by writing to Premium Membership Services 665 S.E. 10 Street, Suite 201 Deerfield Beach, FL 33441-5634 or by calling 1-800-965-8307
or 954-785-1121.
|
|
|