You are not logged in.
This means you
CAN ONLY VIEW reports that were published prior to Friday, April 4, 2025.
You
MUST UPGRADE YOUR MEMBERSHIP if you want to see any current reports.
AFTER MARKET UPDATE - FRIDAY, JANUARY 24TH, 2025
Previous After Market Report Next After Market Report >>>
|
|
|
|
DOW |
-140.82 |
44,424.25 |
-0.32% |
|
Volume |
945,202,792 |
+6% |
|
Volume |
7,962,380,900 |
+13% |
|
NASDAQ |
-99.38 |
19,954.30 |
-0.50% |
|
Advancers |
1,527 |
56% |
|
Advancers |
2,220 |
51% |
|
S&P 500 |
-17.47 |
6,101.24 |
-0.29% |
|
Decliners |
1,191 |
44% |
|
Decliners |
2,113 |
49% |
|
Russell 2000 |
-6.86 |
2,307.74 |
-0.30% |
|
52 Wk Highs |
111 |
|
|
52 Wk Highs |
184 |
|
|
S&P 600 |
-2.96 |
1,455.30 |
-0.20% |
|
52 Wk Lows |
8 |
|
|
52 Wk Lows |
67 |
|
|
 |
Major Indices Fell Following a Recent Rebound
Kenneth J. Gruneisen - Passed the CAN SLIM® Master's Exam
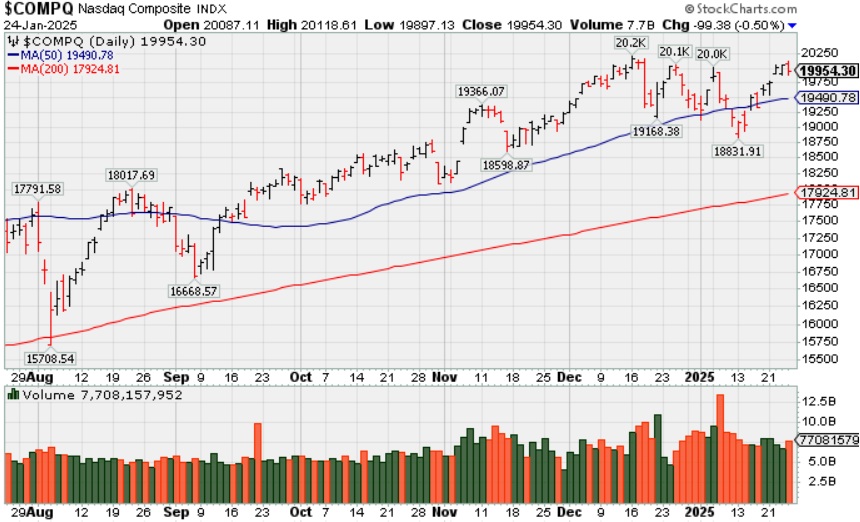
The major indices ended Friday's session lower, pausing after a recent rebound. Volume totals reported were higher than the prior session totals on the NYSE and on the Nasdaq exchange. Breadth was positive as advancers led decliners by a 5-4 margin at the NYSE while the mix was nearly even on the Nasdaq exchange. There were 47 high-ranked companies from the Leaders List that hit new 52-week highs and were listed on the BreakOuts Page, versus 50 on the prior session. New 52-week highs totals expanded and outnumbered shrinking new 52-week lows on the NYSE and on the Nasdaq exchange. The major indices have shaken off recent pressure (M criteria) as leadership has improved meaningfully, avoiding a more worrisome correction. Disciplined investors know to only buy stocks meeting all key criteria as they emerge from properly formed bases.
PICTURED: The Nasdaq Composite Index pulled back after 4 consecutive gains approaching its all-time high.
Guidance disappointments from Texas Instruments (TXN -7.5%) and Boeing (BA -1.7%) created a drag on the broader market. Dow component American Express (AXP -1.4%) posted better-than-expected results on robust customer spending activity. And a big IPO, natural gas exporter Venture Global (VG -4.0%) stumbled on its first day of trading. One individual standout was Twilio (TWLO +20.1%), which impressed with its guidance.
Within the S&P 500 sectors six finished higher and five sectors ended the day lower. Utilities (+1.1%) and communication services (+1.1%) rose while information technology (-1.1%) and energy (-1.0%) lost ground.
The preliminary January S&P Global US Services PMI showed a notable deceleration to 52.8 from 56.8 in December. And a weaker-than-expected consumer sentiment reading for January was pressured by unemployment and inflation concerns. And there was a better-than-expected Existing Home Sales Report for December.
The 2-yr note yield settled one basis point lower at 4.27% while the 10-yr note yield settled one basis point lower at 4.63%. The U.S. Dollar Index (-0.5% to 107.48) moved lower as the greenback lost ground against most major currency pairs. The yen (USD/JPY -0.1% to 155.89) was a focal point after the Bank of Japan raised its key policy rate by 25 basis points to 0.50% and communicated a bias to hike again if the economy evolves as expected. The euro (EUR/USD +0.8% to 1.0495) had a solid day.
|
 Kenneth J. Gruneisen started out as a licensed stockbroker in August 1987, a couple of months prior to the historic stock market crash that took the Dow Jones Industrial Average down -22.6% in a single day. He has published daily fact-based fundamental and technical analysis on high-ranked stocks online for two decades. Through FACTBASEDINVESTING.COM, Kenneth provides educational articles, news, market commentary, and other information regarding proven investment systems that work in good times and bad.
Comments contained in the body of this report are technical opinions only and are not necessarily those of Gruneisen Growth Corp. The material herein has been obtained from sources believed to be reliable and accurate, however, its accuracy and completeness cannot be guaranteed. Our firm, employees, and customers may effect transactions, including transactions contrary to any recommendation herein, or have positions in the securities mentioned herein or options with respect thereto. Any recommendation contained in this report may not be suitable for all investors and it is not to be deemed an offer or solicitation on our part with respect to the purchase or sale of any securities. |
|
 |
Financials and Gold & Silver Index Rose
Kenneth J. Gruneisen - Passed the CAN SLIM® Master's Exam
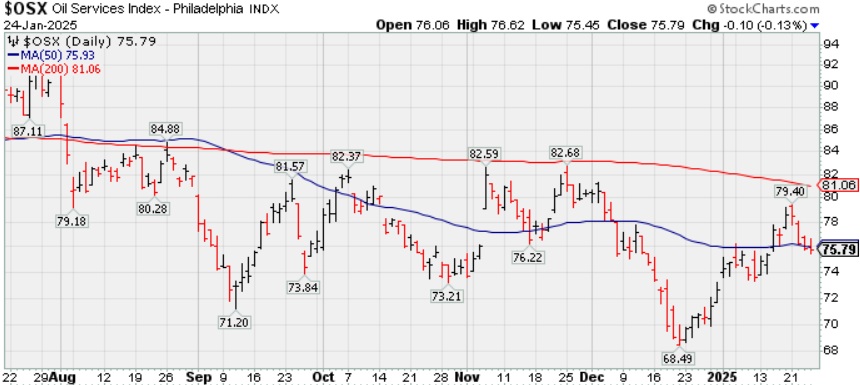
The Retail Index ($RLX -0.18%) ended slightly lower on Friday while the Broker/Dealer Index ($XBD +0.91%) and the Bank Index ($BKX +0.39%) posted small gains. The tech sector had a negative bias as the Networking Index ($NWX -1.09%), Biotech Index ($BTK -0.85%), and the Semiconductor Index ($SOX -1.89%) suffered unanimous losses. Commodity-linked groups were mixed as the Oil Services Index ($OSX -0.13%) and the Integrated Oil Index ($XOI -1.15%) lost ground while the Gold & Silver Index ($XAU +1.30%) rose.
PICTURED: The Oil Services Index ($OSX -0.13%) has pulled back just below its 50-day moving average (DMA) line with 4 consecutive losses.
| Oil Services |
$OSX |
75.79 |
-0.10 |
-0.13% |
+4.40% |
| Integrated Oil |
$XOI |
1,880.80 |
-22.66 |
-1.19% |
+6.65% |
| Semiconductor |
$SOX |
5,341.94 |
-102.75 |
-1.89% |
+7.27% |
| Networking |
$NWX |
1,364.75 |
-14.99 |
-1.09% |
+9.31% |
| Broker/Dealer |
$XBD |
896.16 |
+8.04 |
+0.91% |
+11.27% |
| Retail Index |
$RLX |
5,467.48 |
-9.84 |
-0.18% |
+5.66% |
| Gold & Silver |
$XAU |
150.89 |
+1.93 |
+1.30% |
+10.00% |
| Bank |
$BKX |
137.68 |
+0.54 |
+0.39% |
+8.01% |
| Biotech |
$BTK |
6,198.03 |
-53.13 |
-0.85% |
+7.87% |
|
|
|
 |
Featured Stocks
Kenneth J. Gruneisen - Passed the CAN SLIM® Master's Exam
Symbol/Exchange
Company Name
Industry Group | PRICE | CHANGE
(%Change) | Day High | Volume
(% DAV)
(% 50 day avg vol) | 52 Wk Hi
% From Hi | Featured
Date | Price
Featured | Pivot Featured | | Max Buy |  GVA - NYSE GVA - NYSE
Granite Construction
Bldg-Heavy Construction | $91.49 | -1.35
-1.45% | $92.84 | 509,955
96.40% of 50 DAV
50 DAV is 529,000 | $105.20
-13.03%
| 6/11/2024 | $59.76 | PP = $64.33 | | MB = $67.55 | Most Recent Note - 1/21/2025 3:48:20 PM
G - Posting a 6th consecutive gain today rising above its 50 DMA line ($94) helping its outlook to improve. Slumped after a noted "negative reversal" at its all-time high. Reported Sep ''24 quarterly earnings +19% on +14% sales revenues versus the year-ago period, repeatedly noted as "below the +25% minimum guideline (C criteria) of the fact-based investment system."
>>> FEATURED STOCK ARTICLE : Negative Reversal After Hitting New All-Time High - 12/6/2024 | View all notes | Set NEW NOTE alert | Company Profile | SEC News | Chart | Request a new note C A S I | TXRH - NASDAQ
Texas Roadhouse Inc
LEISURE - Restaurants | $178.55 | -0.58
-0.32% | $178.86 | 854,820
122.66% of 50 DAV
50 DAV is 696,900 | $206.04
-13.34%
| 7/26/2024 | $173.08 | PP = $175.82 | | MB = $184.61 | Most Recent Note - 1/23/2025 7:22:47 PM
G - Sputtering yet still finding support above its 200 DMA line ($174.40) but lingering below its 50 DMA line ($188.86) in recent weeks. A rebound above the 50 DMA line is still needed for its outlook to improve. See the latest FSU analysis for more details and a new annotated graph.
>>> FEATURED STOCK ARTICLE : Lingering Below 50-Day Moving Average Line - 1/23/2025 | View all notes | Set NEW NOTE alert | Company Profile | SEC News | Chart | Request a new note C A S I | HWM - NYSE
Howmet Aerospace
Aerospace/Defense | $127.03 | -0.71
-0.56% | $127.55 | 2,102,857
86.25% of 50 DAV
50 DAV is 2,438,000 | $129.10
-1.60%
| 1/8/2025 | $115.05 | PP = $120.81 | | MB = $126.85 | Most Recent Note - 1/22/2025 5:07:13 PM
Y - Paused today near its "max buy" level after 6 consecutive gains for new all-time highs. Recent volume-driven gains above the pivot point triggered a new (or add-on) technical buy signal. Found support recently above the prior high ($106.93 on 10/21/24). Fundamentals remain strong.
>>> FEATURED STOCK ARTICLE : Extended From Prior Base and Perched at High - 12/5/2024 | View all notes | Set NEW NOTE alert | Company Profile | SEC News | Chart | Request a new note C A S I | NGVC - NYSE
Natural Grocers
Retail-Super/Mini Mkts | $41.50 | -0.04
-0.10% | $41.90 | 90,740
78.90% of 50 DAV
50 DAV is 115,000 | $47.57
-12.76%
| 11/5/2024 | $30.57 | PP = $30.42 | | MB = $31.94 | Most Recent Note - 1/21/2025 3:49:43 PM
G - Gapped up today but retreated from its early high. Found support at its 50 DMA line ($40). More damaging losses would raise serious concerns and trigger a worrisome technical sell signal. Reported Sep ''24 quarterly earnings +50% on +9% sales revenues versus the year-ago period.
>>> FEATURED STOCK ARTICLE : Consolidating After Considerable Rally to New Highs - 12/16/2024 | View all notes | Set NEW NOTE alert | Company Profile | SEC News | Chart | Request a new note C A S I | CLS - NYSE
Celestica
Elec-Contract Mfg | $121.69 | -1.23
-1.00% | $126.01 | 2,410,214
106.88% of 50 DAV
50 DAV is 2,255,000 | $131.23
-7.27%
| 10/11/2024 | $57.62 | PP = $63.59 | | MB = $66.77 | Most Recent Note - 1/22/2025 1:10:38 PM
G - Extended from any sound base and hitting yet another new all-time high with today's 6th consecutive gain. Its 50 DMA line ($94) defines initial support to watch on pullbacks.
>>> FEATURED STOCK ARTICLE : New High After 6th Consecutive Gain - 1/22/2025 | View all notes | Set NEW NOTE alert | Company Profile | SEC News | Chart | Request a new note C A S I | Symbol/Exchange
Company Name
Industry Group | PRICE | CHANGE
(%Change) | Day High | Volume
(% DAV)
(% 50 day avg vol) | 52 Wk Hi
% From Hi | Featured
Date | Price
Featured | Pivot Featured | | Max Buy | PAY - NYSE
Paymentus Holdings
Finance-CrdtCard/PmtPr | $30.39 | -0.23
-0.75% | $31.01 | 207,244
38.45% of 50 DAV
50 DAV is 539,000 | $38.94
-21.96%
| 1/3/2025 | $34.21 | PP = $38.94 | | MB = $40.89 | Most Recent Note - 1/21/2025 3:43:48 PM
G - Rebounding toward its 50 DMA line with today''s big gain after noted losses backed by above average volume. A rebound above the 50 DMA line ($33.37) is needed for its outlook to improve.
>>> FEATURED STOCK ARTICLE : Losses Below 50-Day Moving Average Hurt Outlook - 1/8/2025 | View all notes | Set NEW NOTE alert | Company Profile | SEC News | Chart | Request a new note C A S I | RMD - NYSE
ResMed
Medical-Products | $250.51 | +1.63
0.65% | $250.76 | 778,470
100.45% of 50 DAV
50 DAV is 775,000 | $260.49
-3.83%
| 10/25/2024 | $256.64 | PP = $255.28 | | MB = $268.04 | Most Recent Note - 1/21/2025 3:45:22 PM
Y - Gapped up today rebounding above its 50 DMA line ($239.49) helping its outlook to improve and its color code is changed to yellow. Its Relative Strength Rating is 83, at the 80+ minimum guideline for buy candidates. Faces near-term resistance due to overhead supply up to the $260 level.
>>> FEATURED STOCK ARTICLE : Recent Slump Below 50-Day Moving Average Raised Concerns - 11/18/2024 | View all notes | Set NEW NOTE alert | Company Profile | SEC News | Chart | Request a new note C A S I | ATGE - NYSE
Adtalem Global Education
Consumer Svcs-Education | $99.62 | -0.73
-0.73% | $100.36 | 213,973
55.87% of 50 DAV
50 DAV is 383,000 | $100.54
-0.92%
| 12/31/2024 | $91.50 | PP = $93.03 | | MB = $97.68 | Most Recent Note - 1/17/2025 10:06:48 AM
G - After a noted "positive reversal" today''s 4th consecutive gain has it wedging to new all-time highs above its "max buy" level and its color code is changed to green. New pivot point was cited based on its 11/06/24 high plus 10 cents. It did not produce gains above its pivot point with heavy enough volume to trigger a proper new (or add-on) technical buy signal. Its 50 DMA line ($90.34) defines initial support above the prior low ($84.79 on 12/18/24). Fundamentals remain strong.
>>> FEATURED STOCK ARTICLE : Hovering Near High With Volume Totals Cooling - 12/4/2024 | View all notes | Set NEW NOTE alert | Company Profile | SEC News | Chart | Request a new note C A S I | TW - NASDAQ
Tradeweb Markets
Financial Svcs-Specialty | $131.00 | +0.00
0.00% | $132.14 | 866,044
101.77% of 50 DAV
50 DAV is 851,000 | $141.69
-7.54%
| 11/19/2024 | $134.41 | PP = $136.23 | | MB = $143.04 | Most Recent Note - 1/22/2025 5:11:56 PM
G - Its Relative Strength Rating has slumped to 77, below the 80+ minimum guideline for buy candidates while lingering below its 50 DMA line. Prior lows in the $125 area define the next very important support level to watch. More damaging losses would raise serious concerns. A rebound above the 50 DMA line ($132) is needed for its outlook to improve and it must produce a volume-driven gain above the pivot point to trigger a proper technical buy signal. It was highlighted in yellow with pivot point cited based on its 10/15/24 high plus 10 cents.
>>> FEATURED STOCK ARTICLE : Tradeweb Markets Perched Near High - 11/19/2024 | View all notes | Set NEW NOTE alert | Company Profile | SEC News | Chart | Request a new note C A S I | ATAT - NASDAQ
Atour Lifestyle Hldgs ADR
Leisure-Lodging | $27.31 | +1.16
4.44% | $27.58 | 1,148,945
93.26% of 50 DAV
50 DAV is 1,232,000 | $29.90
-8.66%
| 12/9/2024 | $29.34 | PP = $29.25 | | MB = $30.71 |  Most Recent Note - 1/24/2025 11:56:09 PM Most Recent Note - 1/24/2025 11:56:09 PM
Y - Color code is changed to yellow after a solid rebound above its 50 DMA line helped its outlook to improve.
>>> FEATURED STOCK ARTICLE : Volume Above Average Behind Breakout Gain - 12/9/2024 | View all notes | Set NEW NOTE alert | Company Profile | SEC News | Chart | Request a new note C A S I | Symbol/Exchange
Company Name
Industry Group | PRICE | CHANGE
(%Change) | Day High | Volume
(% DAV)
(% 50 day avg vol) | 52 Wk Hi
% From Hi | Featured
Date | Price
Featured | Pivot Featured | | Max Buy | CRAI - NASDAQ
CRA International
Comml Svcs-Consulting | $188.46 | +0.56
0.30% | $188.68 | 31,450
92.50% of 50 DAV
50 DAV is 34,000 | $210.70
-10.56%
| 12/17/2024 | $208.34 | PP = $208.48 | | MB = $218.90 | Most Recent Note - 1/21/2025 3:46:41 PM
G - Today''s gain with light volume has it rebounding toward its 50 DMA line which may act as resistance. A rebound above the 50 DMA line ($190) is needed for its outlook to improve. Its 200 DMA line ($174) defines important near-term support. Fundamentals remain strong.
>>> FEATURED STOCK ARTICLE : Volume-Driven Gain for New High Triggered Technical Buy Signal - 12/17/2024 | View all notes | Set NEW NOTE alert | Company Profile | SEC News | Chart | Request a new note C A S I | LRN - NYSE
Stride
Consumer Svcs-Education | $119.38 | +0.33
0.28% | $120.39 | 566,082
80.87% of 50 DAV
50 DAV is 700,000 | $120.60
-1.01%
| 1/10/2025 | $114.31 | PP = $112.90 | | MB = $118.55 | Most Recent Note - 1/22/2025 5:09:46 PM
Y - Posted a 5th consecutive gain today with lackluster volume, wedging above the pivot point cited based on its 12/04/24 high and hitting new all-time highs. Fundamentals remain strong. Recently consolidated in an orderly fashion above its 50 DMA line ($106.66). The 1/10/25 mid-day report noted - "A gain and strong close above the pivot point backed by at least +40% above average volume may clinch a technical buy signal."
>>> FEATURED STOCK ARTICLE : Encountered Distributional Pressure Amid Broader Weakness - 1/10/2025 | View all notes | Set NEW NOTE alert | Company Profile | SEC News | Chart | Request a new note C A S I |
|
|
|
Color Codes Explained :
Y - Better candidates highlighted by our
staff of experts.
G - Previously featured
in past reports as yellow but may no longer be buyable under the
guidelines.
***Last / Change / Volume data in this table is the closing quote data***
|
|
|
THESE ARE NOT BUY RECOMMENDATIONS!
Comments contained in the body of this report are technical
opinions only. The material herein has been obtained
from sources believed to be reliable and accurate, however,
its accuracy and completeness cannot be guaranteed.
This site is not an investment advisor, hence it does
not endorse or recommend any securities or other investments.
Any recommendation contained in this report may not
be suitable for all investors and it is not to be deemed
an offer or solicitation on our part with respect to
the purchase or sale of any securities. All trademarks,
service marks and trade names appearing in this report
are the property of their respective owners, and are
likewise used for identification purposes only.
This report is a service available
only to active Paid Premium Members.
You may opt-out of receiving report notifications
at any time. Questions or comments may be submitted
by writing to Premium Membership Services 665 S.E. 10 Street, Suite 201 Deerfield Beach, FL 33441-5634 or by calling 1-800-965-8307
or 954-785-1121.
|
|
|