You are not logged in.
This means you
CAN ONLY VIEW reports that were published prior to Friday, April 18, 2025.
You
MUST UPGRADE YOUR MEMBERSHIP if you want to see any current reports.
AFTER MARKET UPDATE - WEDNESDAY, JANUARY 8TH, 2025
Previous After Market Report Next After Market Report >>>
|
|
|
|
DOW |
+106.84 |
42,635.20 |
+0.25% |
|
Volume |
1,003,072,645 |
-1% |
|
Volume |
8,966,038,600 |
-35% |
|
NASDAQ |
-10.80 |
19,478.88 |
-0.06% |
|
Advancers |
1,174 |
44% |
|
Advancers |
1,486 |
34% |
|
S&P 500 |
+9.22 |
5,918.25 |
+0.16% |
|
Decliners |
1,517 |
56% |
|
Decliners |
2,886 |
66% |
|
Russell 2000 |
-10.84 |
2,238.96 |
-0.48% |
|
52 Wk Highs |
20 |
|
|
52 Wk Highs |
59 |
|
|
S&P 600 |
-0.29 |
1,410.87 |
-0.02% |
|
52 Wk Lows |
125 |
|
|
52 Wk Lows |
146 |
|
|
 |
Breadth Negative as Major Indices Sputtered with Less Leadership
Kenneth J. Gruneisen - Passed the CAN SLIM® Master's Exam
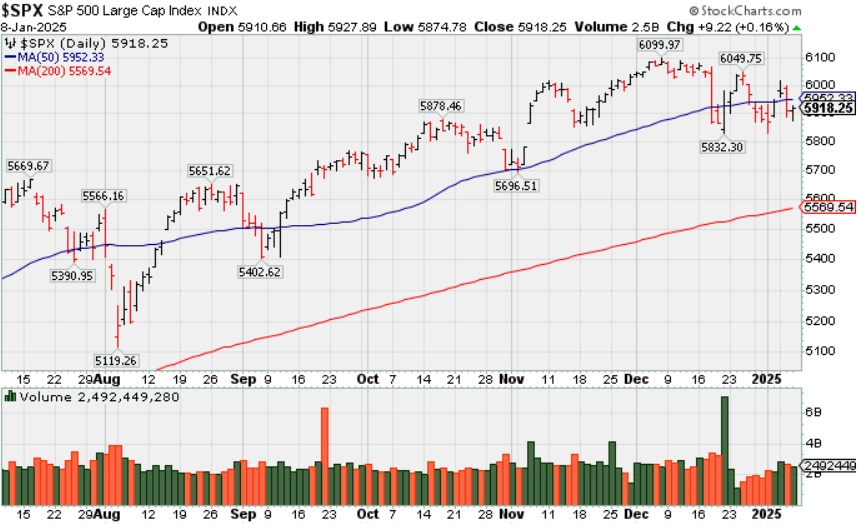
The S&P 500 settled 0.2% higher and the Dow Jones Industrial Average rose 0.3% while the Nasdaq Composite declined -0.1% The volume totals were lighter than the prior session total on the NYSE and on the Nasdaq exchange. Decliners led advancers by a 5-4 margin at the NYSE and by 2-1 at the Nasdaq exchange. There were 9 high-ranked companies from the Leaders List that hit new 52-week highs and were listed on the BreakOuts Page, versus 12 on the prior session. New 52-week lows totals expanded and outnumbered shrinking new highs totals on the NYSE and on the Nasdaq exchange. The major indices' uptrend has come under pressure (M criteria). Disciplined investors know that new buying efforts are only to be made in stocks meeting all key criteria of the fact-based investment system.
PICTURED: The S&P 500 Index halted its slide above prior lows after slumping back below its 50-day moving average (DMA) line.
The Treasury market settled little changed as the 10-yr yield rose one basis point to 4.69% and the 2-yr yield settled one basis point lower at 4.29%. A fresh $22 billion 30-yr bond sale met strong demand.
The economic data included a below-consensus ADP Employment Change report for December (122,000), and an unexpected drop in weekly Initial Claims (201,000; prior 211,000).
The FOMC Minutes for the December 17-18 meeting conveyed a belief that the Fed should hold off on another rate cut until it has more confidence in inflation returning to its 2% target and/or more concern about the labor market deteriorating in a more pronounced manner.
The US equities markets are closed Thursday in observance of the National Day of Mourning in honor of late former President Jimmy Carter.
|
 Kenneth J. Gruneisen started out as a licensed stockbroker in August 1987, a couple of months prior to the historic stock market crash that took the Dow Jones Industrial Average down -22.6% in a single day. He has published daily fact-based fundamental and technical analysis on high-ranked stocks online for two decades. Through FACTBASEDINVESTING.COM, Kenneth provides educational articles, news, market commentary, and other information regarding proven investment systems that work in good times and bad.
Comments contained in the body of this report are technical opinions only and are not necessarily those of Gruneisen Growth Corp. The material herein has been obtained from sources believed to be reliable and accurate, however, its accuracy and completeness cannot be guaranteed. Our firm, employees, and customers may effect transactions, including transactions contrary to any recommendation herein, or have positions in the securities mentioned herein or options with respect thereto. Any recommendation contained in this report may not be suitable for all investors and it is not to be deemed an offer or solicitation on our part with respect to the purchase or sale of any securities. |
|
 |
Gold & Silver and Biotech Indexes Led Gainers
Kenneth J. Gruneisen - Passed the CAN SLIM® Master's Exam
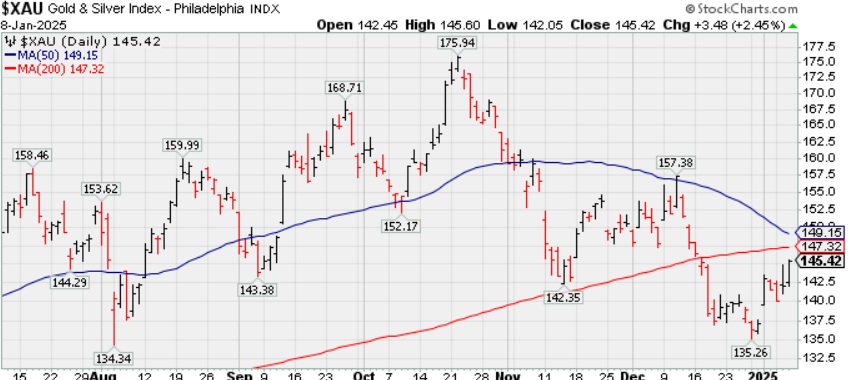
The Retail Index ($RLX +0.33%) and Broker/Dealer Index ($XBD +0.54%) both edged higher but the Bank Index ($BKX -0.13%) suffered a small loss. The tech sector was mixed as the Semiconductor Index ($SOX -0.96%) outpaced the Networking Index ($NWX -0.11%) to the downside and the Biotech Index ($BTK +0.72%) posted a small gain. Commodity-linked groups were mixed as the Gold & Silver Index ($XAU +2.46%) rose while the Oil Services Index ($OSX -2.08%) fell and the Integrated Oil Index ($XOI -0.03%) finished flat.
PICTURED: The Gold & Silver Index ($XAU +2.46%) is rebounding toward its 50-day and 200-day moving average (DMA) lines which are converging.
| Oil Services |
$OSX |
73.78 |
-1.57 |
-2.08% |
+1.63% |
| Integrated Oil |
$XOI |
1,826.13 |
-0.56 |
-0.03% |
+3.55% |
| Semiconductor |
$SOX |
5,162.35 |
-49.90 |
-0.96% |
+3.66% |
| Networking |
$NWX |
1,259.82 |
-1.43 |
-0.11% |
+0.90% |
| Broker/Dealer |
$XBD |
822.36 |
+4.41 |
+0.54% |
+2.11% |
| Retail Index |
$RLX |
5,197.41 |
+16.97 |
+0.33% |
+0.44% |
| Gold & Silver |
$XAU |
145.42 |
+3.48 |
+2.45% |
+6.01% |
| Bank |
$BKX |
129.44 |
-0.17 |
-0.13% |
+1.55% |
| Biotech |
$BTK |
5,930.79 |
+42.23 |
+0.72% |
+3.22% |
|
|
|
 |
Losses Below 50-Day Moving Average Hurt Outlook
Kenneth J. Gruneisen - Passed the CAN SLIM® Master's Exam
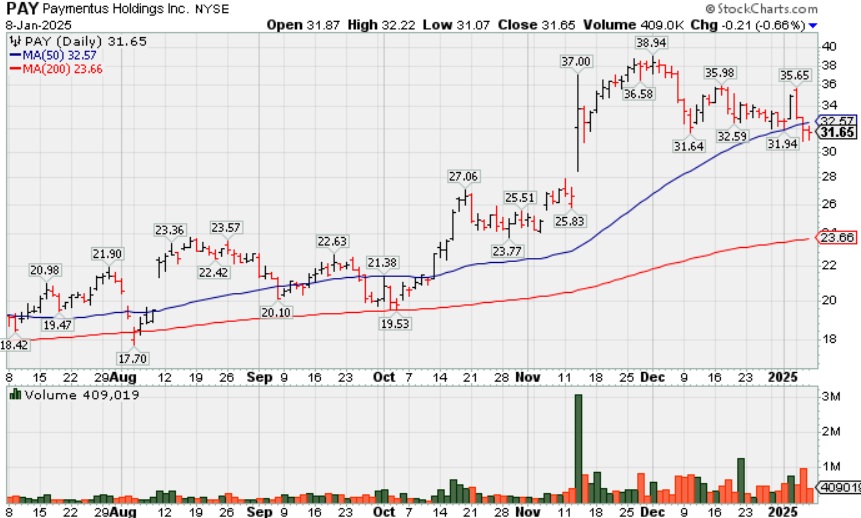
Paymentus Holdings (PAY -$0.21 or -0.66% to $31.65) had its color code changed to green after slumping below its 50-day moving average (DMA) line ($32.57) with recent losses backed by above average volume. A prompt rebound above the 50 DMA liner is needed for its outlook to improve
PAY now has a 98 Earnings Per Share Rating and a 95 Relative Strength Rating. PAY found support near prior highs in the $24-25 area during the consolidation after it was highlighted in yellow with new pivot point cited based on its 3/21/24 high plus 10 cents in the 10/17/24 mid-day report (read here). It was last shown in this FSU section on 11/14/24 with an annotated graph under the headline, "Extended From Prior Base After Considerable Spike Higher".
The number of top-rated funds owning its shares rose from 112 in Dec '23 to 163 in Dec '24, a reassuring concerning the I criteria. Its current Up/Down Volume Ratio of 1.0 is an unbiased sign its shares have been neutral concerning accumulation/distribution over the past 50 days.
|
|
|
Color Codes Explained :
Y - Better candidates highlighted by our
staff of experts.
G - Previously featured
in past reports as yellow but may no longer be buyable under the
guidelines.
***Last / Change / Volume data in this table is the closing quote data***
Symbol/Exchange
Company Name
Industry Group |
PRICE |
CHANGE
(%Change) |
Day High |
Volume
(% DAV)
(% 50 day avg vol) |
52 Wk Hi
% From Hi |
Featured
Date |
Price
Featured |
Pivot Featured |
|
Max Buy |
 GVA
-
NYSE
GVA
-
NYSE
Granite Construction
Bldg-Heavy Construction
|
$88.39
|
+0.02
0.02% |
$88.44
|
359,366
56.95% of 50 DAV
50 DAV is 631,000
|
$105.20
-15.98%
|
6/11/2024
|
$59.76
|
PP = $64.33
|
|
MB = $67.55
|
 Most Recent Note - 1/8/2025 5:04:36 PM
G - Still sputtering below its 50 DMA line ($93.27), and a rebound above that short-term average is needed for its outlook to improve. Sputtering after a noted "negative reversal" at its all-time high. Reported Sep '24 quarterly earnings +19% on +14% sales revenues versus the year-ago period, repeatedly noted as "below the +25% minimum guideline (C criteria) of the fact-based investment system."
>>> FEATURED STOCK ARTICLE : Negative Reversal After Hitting New All-Time High - 12/6/2024 |
View all notes |
Set NEW NOTE alert |
Company Profile |
SEC
News |
Chart |
Request a new note
C
A
S
I |
TXRH
-
NASDAQ
Texas Roadhouse
Retail-Restaurants
|
$182.05
|
+0.78
0.43% |
$182.43
|
873,251
124.57% of 50 DAV
50 DAV is 701,000
|
$206.04
-11.64%
|
7/26/2024
|
$173.08
|
PP = $175.82
|
|
MB = $184.61
|
Most Recent Note - 1/8/2025 5:14:53 PM
G - Managed a "positive reversal" today after slumping near its 200 DMA line ($173). Lingering below its 50 DMA line ($191) in recent weeks and a rebound above the 50 DMA line is still needed for its outlook to improve.
>>> FEATURED STOCK ARTICLE : Hovering Near High After Recent Volume-driven Gains - 11/15/2024 |
View all notes |
Set NEW NOTE alert |
Company Profile |
SEC
News |
Chart |
Request a new note
C
A
S
I |
HWM
-
NYSE
Howmet Aerospace
Aerospace/Defense
|
$115.05
|
+3.39
3.04% |
$115.16
|
2,299,173
97.51% of 50 DAV
50 DAV is 2,358,000
|
$120.71
-4.69%
|
1/8/2025
|
$115.05
|
PP = $120.81
|
|
MB = $126.85
|
Most Recent Note - 1/8/2025 5:09:17 PM
Y - Posted a big gain today with average volume rising further above its 50 DMA line ($112.27). Color code is changed to yellow with new pivot point cited based on its 12/06/24 high plus 10 cents after a short flat base. Subsequent volume-driven gains above the pivot point may trigger a new (or add-on) technical buy signal. Found support recently above the prior high ($106.93 on 10/21/24). Fundamentals remain strong.
>>> FEATURED STOCK ARTICLE : Extended From Prior Base and Perched at High - 12/5/2024 |
View all notes |
Set NEW NOTE alert |
Company Profile |
SEC
News |
Chart |
Request a new note
C
A
S
I |
NGVC
-
NYSE
Natural Grocers
Retail-Super/Mini Mkts
|
$39.95
|
+0.40
1.01% |
$40.22
|
91,792
81.23% of 50 DAV
50 DAV is 113,000
|
$47.57
-16.02%
|
11/5/2024
|
$30.57
|
PP = $30.42
|
|
MB = $31.94
|
Most Recent Note - 1/7/2025 6:12:16 PM
G - Pulled back for a 2nd consecutive loss, consolidating above its 50 DMA line ($38). Reported Sep '24 quarterly earnings +50% on +9% sales revenues versus the year-ago period.
>>> FEATURED STOCK ARTICLE : Consolidating After Considerable Rally to New Highs - 12/16/2024 |
View all notes |
Set NEW NOTE alert |
Company Profile |
SEC
News |
Chart |
Request a new note
C
A
S
I |
CLS
-
NYSE
Celestica
Elec-Contract Mfg
|
$102.47
|
+4.20
4.27% |
$103.46
|
2,340,001
107.73% of 50 DAV
50 DAV is 2,172,000
|
$101.72
0.74%
|
10/11/2024
|
$57.62
|
PP = $63.59
|
|
MB = $66.77
|
Most Recent Note - 1/8/2025 5:02:35 PM
G - Volume was +12% above average today as it hit a new all-time high, rising from a short consolidation. Its 50 DMA line ($87.84) defines initial support to watch on pullbacks.
>>> FEATURED STOCK ARTICLE : Pulling Back After Considerable Rally - 11/13/2024 |
View all notes |
Set NEW NOTE alert |
Company Profile |
SEC
News |
Chart |
Request a new note
C
A
S
I |
Symbol/Exchange
Company Name
Industry Group |
PRICE |
CHANGE
(%Change) |
Day High |
Volume
(% DAV)
(% 50 day avg vol) |
52 Wk Hi
% From Hi |
Featured
Date |
Price
Featured |
Pivot Featured |
|
Max Buy |
PAY
-
NYSE
Paymentus Holdings
Finance-CrdtCard/PmtPr
|
$31.65
|
-0.21
-0.66% |
$32.22
|
409,014
83.99% of 50 DAV
50 DAV is 487,000
|
$38.94
-18.72%
|
1/3/2025
|
$34.21
|
PP = $38.94
|
|
MB = $40.89
|
Most Recent Note - 1/8/2025 5:46:28 PM
G - Color code was changed to green after slumping below its 50 DMA line ($32.57) with losses backed by above average volume. A prompt rebound above the 50 DMA line is needed for its outlook to improve. See the latest FSU analysis for more details and a new annotated graph.
>>> FEATURED STOCK ARTICLE : Losses Below 50-Day Moving Average Hurt Outlook - 1/8/2025 |
View all notes |
Set NEW NOTE alert |
Company Profile |
SEC
News |
Chart |
Request a new note
C
A
S
I |
RMD
-
NYSE
ResMed
Medical-Products
|
$236.17
|
-0.23
-0.10% |
$237.20
|
874,288
98.23% of 50 DAV
50 DAV is 890,000
|
$260.49
-9.34%
|
10/25/2024
|
$256.64
|
PP = $255.28
|
|
MB = $268.04
|
Most Recent Note - 1/8/2025 5:12:37 PM
G - Met resistance at its 50 DMA line today after rebounding with 3 gains marked by light volume. A rebound above its 50 DMA line ($240.67) is needed for its outlook to improve. Its Relative Strength Rating is 82, above the 80+ minimum guideline for buy candidates.
>>> FEATURED STOCK ARTICLE : Recent Slump Below 50-Day Moving Average Raised Concerns - 11/18/2024 |
View all notes |
Set NEW NOTE alert |
Company Profile |
SEC
News |
Chart |
Request a new note
C
A
S
I |
ATGE
-
NYSE
Adtalem Global Education
Consumer Svcs-Education
|
$94.41
|
+0.87
0.93% |
$94.59
|
307,227
72.12% of 50 DAV
50 DAV is 426,000
|
$97.37
-3.04%
|
12/31/2024
|
$91.50
|
PP = $93.03
|
|
MB = $97.68
|
Most Recent Note - 1/8/2025 4:59:36 PM
Y - Hovering near its high since a new pivot point was cited based on its 11/06/24 high plus 10 cents. Still consolidating in an orderly fashion above its 50 DMA line ($88.60) which defines initial support above prior highs in the $80 area. Subsequent volume-driven gains above its pivot point may trigger a new (or add-on) technical buy signal. Fundamentals remain strong.
>>> FEATURED STOCK ARTICLE : Hovering Near High With Volume Totals Cooling - 12/4/2024 |
View all notes |
Set NEW NOTE alert |
Company Profile |
SEC
News |
Chart |
Request a new note
C
A
S
I |
TW
-
NASDAQ
Tradeweb Markets
Financial Svcs-Specialty
|
$134.06
|
+1.47
1.11% |
$134.87
|
727,857
85.63% of 50 DAV
50 DAV is 850,000
|
$141.69
-5.38%
|
11/19/2024
|
$134.41
|
PP = $136.23
|
|
MB = $143.04
|
Most Recent Note - 1/3/2025 2:46:05 PM
Y - Color code is changed to yellow after rebounding above its 50 DMA line ($131.91) with today's gain approaching prior highs. It must produce a volume-driven gain above the pivot point to trigger a proper technical buy signal. It was highlighted in yellow with pivot point cited based on its 10/15/24 high plus 10 cents.
>>> FEATURED STOCK ARTICLE : Tradeweb Markets Perched Near High - 11/19/2024 |
View all notes |
Set NEW NOTE alert |
Company Profile |
SEC
News |
Chart |
Request a new note
C
A
S
I |
ATAT
-
NASDAQ
Atour Lifestyle Hldgs ADR
Leisure-Lodging
|
$25.83
|
+0.63
2.50% |
$26.03
|
1,119,188
87.92% of 50 DAV
50 DAV is 1,273,000
|
$29.90
-13.61%
|
12/9/2024
|
$29.34
|
PP = $29.25
|
|
MB = $30.71
|
Most Recent Note - 1/6/2025 6:07:32 PM
G - Color code is changed to green after slumping well below its 50 DMA line ($26.69). Today's more damaging loss below the prior low ($25.68 on 12/30/24) raised serious concerns and triggered a technical sell signal.
>>> FEATURED STOCK ARTICLE : Volume Above Average Behind Breakout Gain - 12/9/2024 |
View all notes |
Set NEW NOTE alert |
Company Profile |
SEC
News |
Chart |
Request a new note
C
A
S
I |
Symbol/Exchange
Company Name
Industry Group |
PRICE |
CHANGE
(%Change) |
Day High |
Volume
(% DAV)
(% 50 day avg vol) |
52 Wk Hi
% From Hi |
Featured
Date |
Price
Featured |
Pivot Featured |
|
Max Buy |
CRAI
-
NASDAQ
CRA International
Comml Svcs-Consulting
|
$184.05
|
+2.83
1.56% |
$184.97
|
32,131
91.80% of 50 DAV
50 DAV is 35,000
|
$210.70
-12.65%
|
12/17/2024
|
$208.34
|
PP = $208.48
|
|
MB = $218.90
|
Most Recent Note - 1/8/2025 5:03:17 PM
G - Still lingering below its 50 DMA line. A rebound above the 50 DMA line ($191.05) is needed for its outlook to improve. Fundamentals remain strong.
>>> FEATURED STOCK ARTICLE : Volume-Driven Gain for New High Triggered Technical Buy Signal - 12/17/2024 |
View all notes |
Set NEW NOTE alert |
Company Profile |
SEC
News |
Chart |
Request a new note
C
A
S
I |
|
|
|
THESE ARE NOT BUY RECOMMENDATIONS!
Comments contained in the body of this report are technical
opinions only. The material herein has been obtained
from sources believed to be reliable and accurate, however,
its accuracy and completeness cannot be guaranteed.
This site is not an investment advisor, hence it does
not endorse or recommend any securities or other investments.
Any recommendation contained in this report may not
be suitable for all investors and it is not to be deemed
an offer or solicitation on our part with respect to
the purchase or sale of any securities. All trademarks,
service marks and trade names appearing in this report
are the property of their respective owners, and are
likewise used for identification purposes only.
This report is a service available
only to active Paid Premium Members.
You may opt-out of receiving report notifications
at any time. Questions or comments may be submitted
by writing to Premium Membership Services 665 S.E. 10 Street, Suite 201 Deerfield Beach, FL 33441-5634 or by calling 1-800-965-8307
or 954-785-1121.
|
|
|