You are not logged in.
This means you
CAN ONLY VIEW reports that were published prior to Wednesday, April 2, 2025.
You
MUST UPGRADE YOUR MEMBERSHIP if you want to see any current reports.
AFTER MARKET UPDATE - THURSDAY, JANUARY 23RD, 2025
Previous After Market Report Next After Market Report >>>
|
|
|
|
DOW |
+408.34 |
44,565.07 |
+0.92% |
|
Volume |
895,696,709 |
-7% |
|
Volume |
7,036,440,400 |
-3% |
|
NASDAQ |
+44.34 |
20,053.68 |
+0.22% |
|
Advancers |
1,534 |
56% |
|
Advancers |
2,514 |
58% |
|
S&P 500 |
+32.34 |
6,118.71 |
+0.53% |
|
Decliners |
1,197 |
44% |
|
Decliners |
1,801 |
42% |
|
Russell 2000 |
+10.88 |
2,314.60 |
+0.47% |
|
52 Wk Highs |
101 |
|
|
52 Wk Highs |
121 |
|
|
S&P 600 |
+5.38 |
1,458.26 |
+0.37% |
|
52 Wk Lows |
27 |
|
|
52 Wk Lows |
118 |
|
|
 |
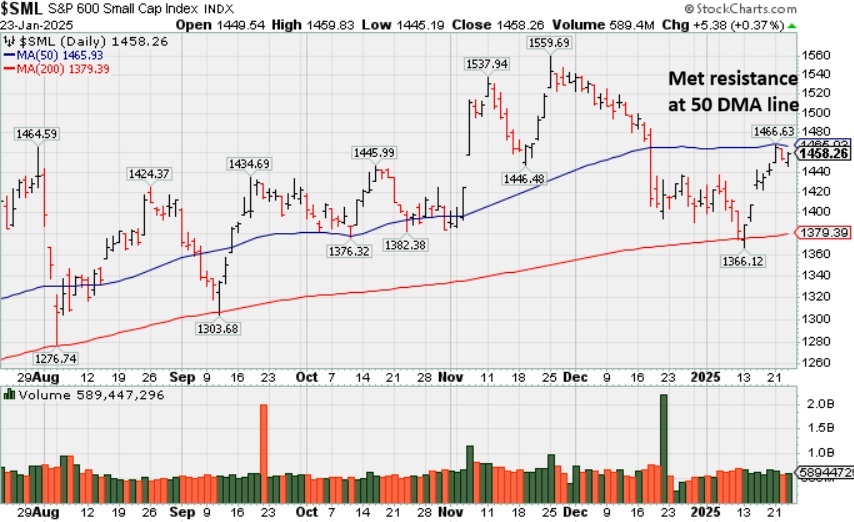
Major Indices Rose with Less Volume and Less Leadership
Kenneth J. Gruneisen - Passed the CAN SLIM® Master's Exam
The Dow Jones Industrial Average (+0.9%) outperformed its peers while the S&P 500 (+0.5%) and Nasdaq Composite (+0.2%) followed. Volume totals reported were lighter than the prior session totals on the NYSE and on the Nasdaq exchange, action indicative of less aggressive institutional buying demand. Breadth was positive as advancers led decliners by a 5-4 margin at the NYSE and by 4-3 on the Nasdaq exchange. There were 50 high-ranked companies from the Leaders List that hit new 52-week highs and were listed on the BreakOuts Page, versus 78 on the prior session. New 52-week highs totals contracted yet still outnumbered new 52-week lows on the NYSE and on the Nasdaq exchange. The major indices have shaken off recent pressure (M criteria) as leadership has improved meaningfully, avoiding a more worrisome correction. Disciplined investors know to only buy stocks meeting all key criteria as they emerge from properly formed bases.
PICTURED: The S&P 600 Small Cap Index posted a 3rd consecutive gain above its 50-day moving average (DMA) line and touched a new all-time high.
Goldman Sachs (GS +1.1%), UnitedHealth (UNH +1.9%), and Caterpillar (CAT +2.2%) drove gains in the price-weighted Dow Jones Industrial Average. Blue-chip names like GE Aerospace (GE +6.6%) and Union Pacific (UNP +5.2%) surged after encouraging earnings results and guidance, boosting the S&P 500 industrial sector (+1.0%). The 10-yr yield settled four basis points higher at 4.64% and the 2-yr yield settled two basis points lower at 4.28%.
The latest weekly jobless claims report showed a larger than expected increase in initial claims and the highest level for continuing claims since November 2021. President Trump, at the World Economic Forum in Davos, said he will press OPEC and Saudi Arabia to lower oil prices, that he expects NATO countries to boost their defense spending to 5% of GDP. He also said that foreign companies producing products in the U.S. could enjoy a lower tax rate (or else face tariffs if they do not).
|
 Kenneth J. Gruneisen started out as a licensed stockbroker in August 1987, a couple of months prior to the historic stock market crash that took the Dow Jones Industrial Average down -22.6% in a single day. He has published daily fact-based fundamental and technical analysis on high-ranked stocks online for two decades. Through FACTBASEDINVESTING.COM, Kenneth provides educational articles, news, market commentary, and other information regarding proven investment systems that work in good times and bad.
Comments contained in the body of this report are technical opinions only and are not necessarily those of Gruneisen Growth Corp. The material herein has been obtained from sources believed to be reliable and accurate, however, its accuracy and completeness cannot be guaranteed. Our firm, employees, and customers may effect transactions, including transactions contrary to any recommendation herein, or have positions in the securities mentioned herein or options with respect thereto. Any recommendation contained in this report may not be suitable for all investors and it is not to be deemed an offer or solicitation on our part with respect to the purchase or sale of any securities. |
|
 |
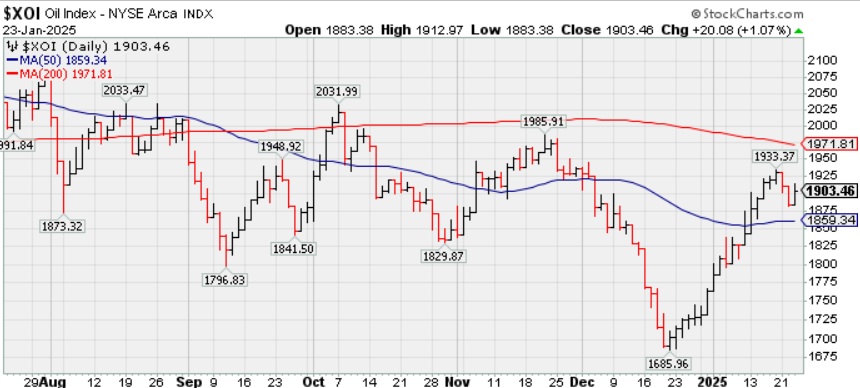
Retail, Financial, Networking and Biotech Indexes Rose
Kenneth J. Gruneisen - Passed the CAN SLIM® Master's Exam
The Retail Index ($RLX +0.40%), Broker/Dealer Index ($XBD +0.69%), and the Bank Index ($BKX +0.61%) posted unanimous gains. The tech sector was mixed as the Networking Index ($NWX +1.38%) and the Biotech Index ($BTK +1.76%) both posted gains while the Semiconductor Index ($SOX -0.45%) suffered a modest loss. The Oil Services Index ($OSX -0.44%) and the Gold & Silver Index ($XAU -0.39%) both edged lower.
PICTURED: The Integrated Oil Index ($XOI +1.07%) posted a solid gain. Recent gains helped it rebound above its 50-day moving average (DMA) line but it remains well below its 200 DMA line.
| Oil Services |
$OSX |
75.90 |
-0.33 |
-0.44% |
+4.54% |
| Integrated Oil |
$XOI |
1,903.46 |
+20.08 |
+1.07% |
+7.93% |
| Semiconductor |
$SOX |
5,444.69 |
-24.60 |
-0.45% |
+9.33% |
| Networking |
$NWX |
1,379.74 |
+18.83 |
+1.38% |
+10.51% |
| Broker/Dealer |
$XBD |
888.11 |
+6.07 |
+0.69% |
+10.28% |
| Retail Index |
$RLX |
5,477.32 |
+21.96 |
+0.40% |
+5.85% |
| Gold & Silver |
$XAU |
148.96 |
-0.43 |
-0.29% |
+8.59% |
| Bank |
$BKX |
137.14 |
+0.83 |
+0.61% |
+7.59% |
| Biotech |
$BTK |
6,251.16 |
+108.29 |
+1.76% |
+8.80% |
|
|
|
 |
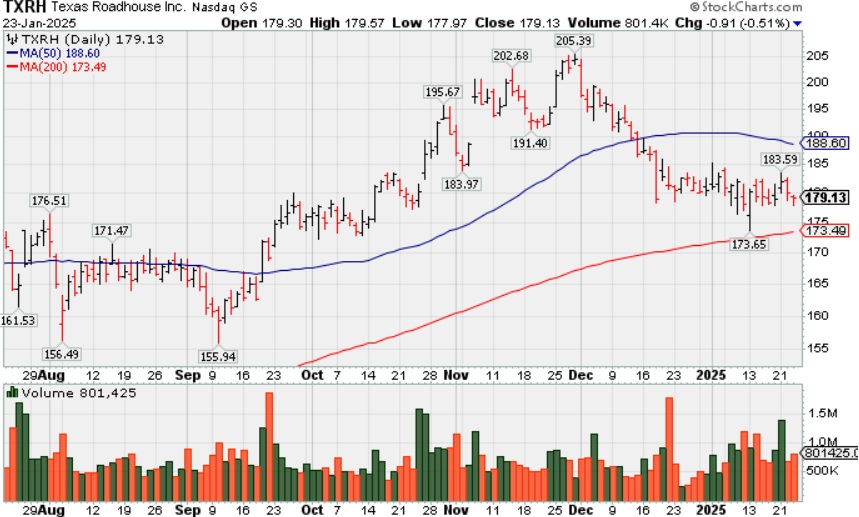
Lingering Below 50-Day Moving Average Line
Kenneth J. Gruneisen - Passed the CAN SLIM® Master's Exam
Texas Roadhouse (TXRH -$0.91 or -0.51% to $179.13) has recently been finding support at its 200 DMA line ($173.40) but lingering below its 50-day moving average (DMA) line ($188.60) in recent weeks. A rebound above the 50 DMA line is still needed for its outlook to improve. Its Relative Strength Rating has slumped to 75, below the 80+ minimum guideline for buy candidates.
TXRH was highlighted in yellow with pivot point cited based on its 6/28/24 high plus 10 cents in the 7/26/24 mid-day report (read here). It was last shown in this FSU section on 11/15/24 with an annotated graph under the headline "Hovering Near High After Recent Volume-driven Gains".
TXRH has a 97 Earnings Per Share Rating, well above the 80+ minimum guideline for buy candidates. It reported Sep '24 quarterly earnings +33% on +13% sales revenues versus the year-ago period, its 3rd consecutive quarterly comparison above the +25% earnings guideline (C criteria). Annual earnings growth has been strong since a downturn in FY '20.
The number of top-rated funds owning its shares rose from 682 in Sep '23 to 900 in Dec '24, a reassuring sign concerning the I criteria. Its current Up/Down Volume Ratio of 0.8 is an unbiased indication its shares have been under distributional pressure over the past 50 days.
|
|
|
Color Codes Explained :
Y - Better candidates highlighted by our
staff of experts.
G - Previously featured
in past reports as yellow but may no longer be buyable under the
guidelines.
***Last / Change / Volume data in this table is the closing quote data***
Symbol/Exchange
Company Name
Industry Group |
PRICE |
CHANGE
(%Change) |
Day High |
Volume
(% DAV)
(% 50 day avg vol) |
52 Wk Hi
% From Hi |
Featured
Date |
Price
Featured |
Pivot Featured |
|
Max Buy |
 GVA
-
NYSE
GVA
-
NYSE
Granite Construction
Bldg-Heavy Construction
|
$92.84
|
-1.24
-1.32% |
$94.27
|
472,719
88.52% of 50 DAV
50 DAV is 534,000
|
$105.20
-11.75%
|
6/11/2024
|
$59.76
|
PP = $64.33
|
|
MB = $67.55
|
Most Recent Note - 1/21/2025 3:48:20 PM
G - Posting a 6th consecutive gain today rising above its 50 DMA line ($94) helping its outlook to improve. Slumped after a noted "negative reversal" at its all-time high. Reported Sep '24 quarterly earnings +19% on +14% sales revenues versus the year-ago period, repeatedly noted as "below the +25% minimum guideline (C criteria) of the fact-based investment system."
>>> FEATURED STOCK ARTICLE : Negative Reversal After Hitting New All-Time High - 12/6/2024 |
View all notes |
Set NEW NOTE alert |
Company Profile |
SEC
News |
Chart |
Request a new note
C
A
S
I |
TXRH
-
NASDAQ
Texas Roadhouse Inc
LEISURE - Restaurants
|
$179.13
|
-0.91
-0.51% |
$179.57
|
801,925
115.07% of 50 DAV
50 DAV is 696,900
|
$206.04
-13.06%
|
7/26/2024
|
$173.08
|
PP = $175.82
|
|
MB = $184.61
|
 Most Recent Note - 1/23/2025 7:22:47 PM
G - Sputtering yet still finding support above its 200 DMA line ($174.40) but lingering below its 50 DMA line ($188.86) in recent weeks. A rebound above the 50 DMA line is still needed for its outlook to improve. See the latest FSU analysis for more details and a new annotated graph.
>>> FEATURED STOCK ARTICLE : Lingering Below 50-Day Moving Average Line - 1/23/2025 |
View all notes |
Set NEW NOTE alert |
Company Profile |
SEC
News |
Chart |
Request a new note
C
A
S
I |
HWM
-
NYSE
Howmet Aerospace
Aerospace/Defense
|
$127.74
|
+1.03
0.81% |
$129.10
|
3,092,035
127.35% of 50 DAV
50 DAV is 2,428,000
|
$129.10
-1.05%
|
1/8/2025
|
$115.05
|
PP = $120.81
|
|
MB = $126.85
|
Most Recent Note - 1/22/2025 5:07:13 PM
Y - Paused today near its "max buy" level after 6 consecutive gains for new all-time highs. Recent volume-driven gains above the pivot point triggered a new (or add-on) technical buy signal. Found support recently above the prior high ($106.93 on 10/21/24). Fundamentals remain strong.
>>> FEATURED STOCK ARTICLE : Extended From Prior Base and Perched at High - 12/5/2024 |
View all notes |
Set NEW NOTE alert |
Company Profile |
SEC
News |
Chart |
Request a new note
C
A
S
I |
NGVC
-
NYSE
Natural Grocers
Retail-Super/Mini Mkts
|
$41.54
|
+0.89
2.19% |
$41.69
|
93,446
81.26% of 50 DAV
50 DAV is 115,000
|
$47.57
-12.68%
|
11/5/2024
|
$30.57
|
PP = $30.42
|
|
MB = $31.94
|
Most Recent Note - 1/21/2025 3:49:43 PM
G - Gapped up today but retreated from its early high. Found support at its 50 DMA line ($40). More damaging losses would raise serious concerns and trigger a worrisome technical sell signal. Reported Sep '24 quarterly earnings +50% on +9% sales revenues versus the year-ago period.
>>> FEATURED STOCK ARTICLE : Consolidating After Considerable Rally to New Highs - 12/16/2024 |
View all notes |
Set NEW NOTE alert |
Company Profile |
SEC
News |
Chart |
Request a new note
C
A
S
I |
CLS
-
NYSE
Celestica
Elec-Contract Mfg
|
$122.92
|
-0.35
-0.28% |
$124.61
|
2,732,985
120.08% of 50 DAV
50 DAV is 2,276,000
|
$131.23
-6.33%
|
10/11/2024
|
$57.62
|
PP = $63.59
|
|
MB = $66.77
|
Most Recent Note - 1/22/2025 1:10:38 PM
G - Extended from any sound base and hitting yet another new all-time high with today's 6th consecutive gain. Its 50 DMA line ($94) defines initial support to watch on pullbacks.
>>> FEATURED STOCK ARTICLE : New High After 6th Consecutive Gain - 1/22/2025 |
View all notes |
Set NEW NOTE alert |
Company Profile |
SEC
News |
Chart |
Request a new note
C
A
S
I |
Symbol/Exchange
Company Name
Industry Group |
PRICE |
CHANGE
(%Change) |
Day High |
Volume
(% DAV)
(% 50 day avg vol) |
52 Wk Hi
% From Hi |
Featured
Date |
Price
Featured |
Pivot Featured |
|
Max Buy |
PAY
-
NYSE
Paymentus Holdings
Finance-CrdtCard/PmtPr
|
$30.62
|
-0.62
-1.98% |
$31.55
|
303,489
56.52% of 50 DAV
50 DAV is 537,000
|
$38.94
-21.37%
|
1/3/2025
|
$34.21
|
PP = $38.94
|
|
MB = $40.89
|
Most Recent Note - 1/21/2025 3:43:48 PM
G - Rebounding toward its 50 DMA line with today's big gain after noted losses backed by above average volume. A rebound above the 50 DMA line ($33.37) is needed for its outlook to improve.
>>> FEATURED STOCK ARTICLE : Losses Below 50-Day Moving Average Hurt Outlook - 1/8/2025 |
View all notes |
Set NEW NOTE alert |
Company Profile |
SEC
News |
Chart |
Request a new note
C
A
S
I |
RMD
-
NYSE
ResMed
Medical-Products
|
$248.88
|
+1.55
0.63% |
$249.12
|
643,888
82.66% of 50 DAV
50 DAV is 779,000
|
$260.49
-4.46%
|
10/25/2024
|
$256.64
|
PP = $255.28
|
|
MB = $268.04
|
Most Recent Note - 1/21/2025 3:45:22 PM
Y - Gapped up today rebounding above its 50 DMA line ($239.49) helping its outlook to improve and its color code is changed to yellow. Its Relative Strength Rating is 83, at the 80+ minimum guideline for buy candidates. Faces near-term resistance due to overhead supply up to the $260 level.
>>> FEATURED STOCK ARTICLE : Recent Slump Below 50-Day Moving Average Raised Concerns - 11/18/2024 |
View all notes |
Set NEW NOTE alert |
Company Profile |
SEC
News |
Chart |
Request a new note
C
A
S
I |
ATGE
-
NYSE
Adtalem Global Education
Consumer Svcs-Education
|
$100.35
|
+0.74
0.74% |
$100.54
|
283,001
72.94% of 50 DAV
50 DAV is 388,000
|
$100.20
0.15%
|
12/31/2024
|
$91.50
|
PP = $93.03
|
|
MB = $97.68
|
Most Recent Note - 1/17/2025 10:06:48 AM
G - After a noted "positive reversal" today's 4th consecutive gain has it wedging to new all-time highs above its "max buy" level and its color code is changed to green. New pivot point was cited based on its 11/06/24 high plus 10 cents. It did not produce gains above its pivot point with heavy enough volume to trigger a proper new (or add-on) technical buy signal. Its 50 DMA line ($90.34) defines initial support above the prior low ($84.79 on 12/18/24). Fundamentals remain strong.
>>> FEATURED STOCK ARTICLE : Hovering Near High With Volume Totals Cooling - 12/4/2024 |
View all notes |
Set NEW NOTE alert |
Company Profile |
SEC
News |
Chart |
Request a new note
C
A
S
I |
TW
-
NASDAQ
Tradeweb Markets Cl A
Financial Svcs-Specialty
|
$131.00
|
+2.43
1.89% |
$131.05
|
831,096
97.73% of 50 DAV
50 DAV is 850,400
|
$141.69
-7.54%
|
11/19/2024
|
$134.41
|
PP = $136.23
|
|
MB = $143.04
|
Most Recent Note - 1/22/2025 5:11:56 PM
G - Its Relative Strength Rating has slumped to 77, below the 80+ minimum guideline for buy candidates while lingering below its 50 DMA line. Prior lows in the $125 area define the next very important support level to watch. More damaging losses would raise serious concerns. A rebound above the 50 DMA line ($132) is needed for its outlook to improve and it must produce a volume-driven gain above the pivot point to trigger a proper technical buy signal. It was highlighted in yellow with pivot point cited based on its 10/15/24 high plus 10 cents.
>>> FEATURED STOCK ARTICLE : Tradeweb Markets Perched Near High - 11/19/2024 |
View all notes |
Set NEW NOTE alert |
Company Profile |
SEC
News |
Chart |
Request a new note
C
A
S
I |
ATAT
-
NASDAQ
Atour Lifestyle Hldgs ADR
Leisure-Lodging
|
$26.15
|
-0.07
-0.27% |
$26.42
|
613,645
49.25% of 50 DAV
50 DAV is 1,246,000
|
$29.90
-12.54%
|
12/9/2024
|
$29.34
|
PP = $29.25
|
|
MB = $30.71
|
Most Recent Note - 1/17/2025 10:02:56 AM
G - Still lingering below its 50 DMA line ($26.53) which may act as resistance. A rebound above the 50 DMA line is needed for its outlook to improve.
>>> FEATURED STOCK ARTICLE : Volume Above Average Behind Breakout Gain - 12/9/2024 |
View all notes |
Set NEW NOTE alert |
Company Profile |
SEC
News |
Chart |
Request a new note
C
A
S
I |
Symbol/Exchange
Company Name
Industry Group |
PRICE |
CHANGE
(%Change) |
Day High |
Volume
(% DAV)
(% 50 day avg vol) |
52 Wk Hi
% From Hi |
Featured
Date |
Price
Featured |
Pivot Featured |
|
Max Buy |
CRAI
-
NASDAQ
CRA International
Comml Svcs-Consulting
|
$187.90
|
+3.82
2.08% |
$187.96
|
30,216
88.87% of 50 DAV
50 DAV is 34,000
|
$210.70
-10.82%
|
12/17/2024
|
$208.34
|
PP = $208.48
|
|
MB = $218.90
|
Most Recent Note - 1/21/2025 3:46:41 PM
G - Today's gain with light volume has it rebounding toward its 50 DMA line which may act as resistance. A rebound above the 50 DMA line ($190) is needed for its outlook to improve. Its 200 DMA line ($174) defines important near-term support. Fundamentals remain strong.
>>> FEATURED STOCK ARTICLE : Volume-Driven Gain for New High Triggered Technical Buy Signal - 12/17/2024 |
View all notes |
Set NEW NOTE alert |
Company Profile |
SEC
News |
Chart |
Request a new note
C
A
S
I |
LRN
-
NYSE
Stride
Consumer Svcs-Education
|
$119.05
|
+1.56
1.33% |
$120.60
|
706,126
100.59% of 50 DAV
50 DAV is 702,000
|
$118.58
0.40%
|
1/10/2025
|
$114.31
|
PP = $112.90
|
|
MB = $118.55
|
Most Recent Note - 1/22/2025 5:09:46 PM
Y - Posted a 5th consecutive gain today with lackluster volume, wedging above the pivot point cited based on its 12/04/24 high and hitting new all-time highs. Fundamentals remain strong. Recently consolidated in an orderly fashion above its 50 DMA line ($106.66). The 1/10/25 mid-day report noted - "A gain and strong close above the pivot point backed by at least +40% above average volume may clinch a technical buy signal."
>>> FEATURED STOCK ARTICLE : Encountered Distributional Pressure Amid Broader Weakness - 1/10/2025 |
View all notes |
Set NEW NOTE alert |
Company Profile |
SEC
News |
Chart |
Request a new note
C
A
S
I |
|
|
|
THESE ARE NOT BUY RECOMMENDATIONS!
Comments contained in the body of this report are technical
opinions only. The material herein has been obtained
from sources believed to be reliable and accurate, however,
its accuracy and completeness cannot be guaranteed.
This site is not an investment advisor, hence it does
not endorse or recommend any securities or other investments.
Any recommendation contained in this report may not
be suitable for all investors and it is not to be deemed
an offer or solicitation on our part with respect to
the purchase or sale of any securities. All trademarks,
service marks and trade names appearing in this report
are the property of their respective owners, and are
likewise used for identification purposes only.
This report is a service available
only to active Paid Premium Members.
You may opt-out of receiving report notifications
at any time. Questions or comments may be submitted
by writing to Premium Membership Services 665 S.E. 10 Street, Suite 201 Deerfield Beach, FL 33441-5634 or by calling 1-800-965-8307
or 954-785-1121.
|
|
|