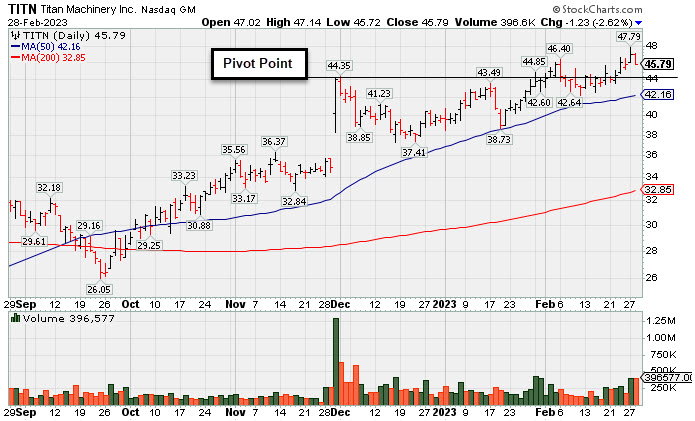
Pulled Back from New All-Time High - Tuesday, February 28, 2023
Titan Machinery Inc (TITN -$1.23 or -2.62% to $45.79) pulled back today with above average volume after hitting a new all-time high on the prior session with a big gain. Its color code was changed to yellow after pulling back below its "max buy" level. Its 50-day moving average (DMA) line ($42.16) definies important near-term support to watch on pullbacks.
Fundamentals remain strong after reporting Oct '22 quarterly earnings +91% on +47% sales revenues. It currently has the highest possible earnings Per Share Rating of 99. Following years of losses it has shown strong earnings growth for FY '19-22. TITN was highlighted in yellow with pivot point cited based on its 11/23/21 high plus 10 cents in the 11/30/22 mid-day report (read here). It was last shown in greater detail on 1/30/23 with an annotated graph under the headline, "7th Consecutive Gain for Titan".
The small supply of only 22.7 million shares outstanding (S criteria) can contribute to greater price volatility in the event of institutional buying or selling. The number of top-rated funds owning its shares rose from 241 in Dec '20 to 361 in Dec '22, a reassuring sign concerning the I criteria. Its current Up/Down Volume Ratio of 1.7 is an unbiased indication its shares have been under slight accumulation over the past 50 days.
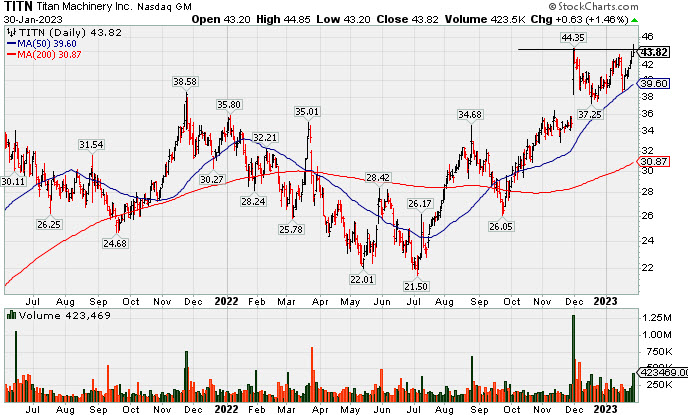
7th Consecutive Gain for Titan - Monday, January 30, 2023
Titan Machinery Inc (TITN +0.63 ort +1.46% to $43.82) posted a 7th consecutive gain today backbed by higher volume. It found support when recently consolidating near the prior high in the $38 area which defines important support to watch along with its 50-day moving average (DMA) line ($39.60). Its color code has been changed to yellow with a new pivot point cited based on its 12/01/22 high plus 10 cents. Subsequent gains above the pivot point backed by at least +40% above average volume may trigger a new technical buy signal. A valid secondary buy point also may be considered up to 5% above the recent high since it found support at the 10-week moving average line.
Fundamentals remain strong after reporting Oct '22 quarterly earnings +91% on +47% sales revenues. It currently has the highest possible earnings Per Share Rating of 99. Following years of losses it has shown strong earnings growth for FY '19-22. TITN was highlighted in yellow with pivot point cited based on its 11/23/21 high plus 10 cents in the 11/30/22 mid-day report (read here). It was last shown in greater detail on 1/13/23 with an annotated graph under the headline, "Forming New Base for Past 7 Weeks".
The small supply of only 22.7 million shares outstanding (S criteria) can contribute to greater price volatility in the event of institutional buying or selling. The number of top-rated funds owning its shares rose from 241 in Dec '20 to 361 in Dec '22, a reassuring sign concerning the I criteria. Its current Up/Down Volume Ratio of 1.2 is an unbiased indication its shares have been under slight accumulation over the past 50 days.
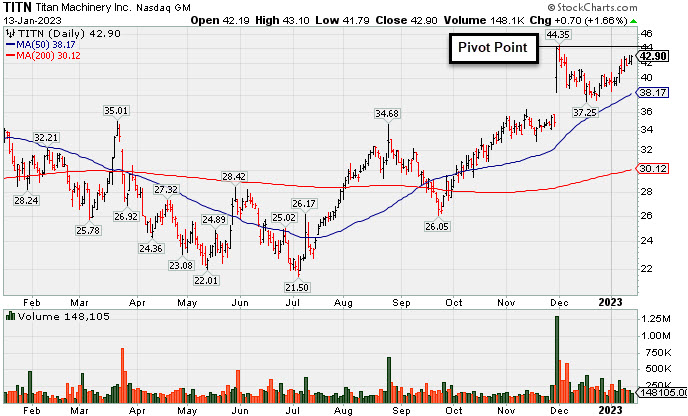
Forming New Base for Past 7 Weeks - Friday, January 13, 2023
Titan Machinery Inc (TITN +$0.70 or +1.66% to $42.90) posted another gain with light volume. It found support when recently consolidating near the prior high in the $38 area which defines important support to watch along with its 50-day moving average (DMA) line ($38.17). Its color code has been changed to yellow with a new pivot point cited based on its 12/01/22 high plus 10 cents. Subsequent gains above the pivot point backed by at least +40% above average volume may trigger a new technical buy signal. A valid secondary buy point also may be considered up to 5% above the recent high since it found support at the 10-week moving average line.
Fundamentals remain strong after reporting Oct '22 quarterly earnings +91% on +47% sales revenues. It currently has the highest possible earnings Per Share Rating of 99. Following years of losses it has shown strong earnings growth for FY '19-22. TITN was highlighted in yellow with pivot point cited based on its 11/23/21 high plus 10 cents in the 11/30/22 mid-day report (read here). It was last shown in greater detail on 12/30/22 with an annotated graph under the headline, "Found Support Near Prior High Following Breakout".
The small supply of only 22.7 million shares outstanding (S criteria) can contribute to greater price volatility in the event of institutional buying or selling. The number of top-rated funds owning its shares rose from 241 in Dec '20 to 355 in Dec '22, a reassuring sign concerning the I criteria. Its current Up/Down Volume Ratio of 1.1 is an unbiased indication its shares have been under slight accumulation over the past 50 days.
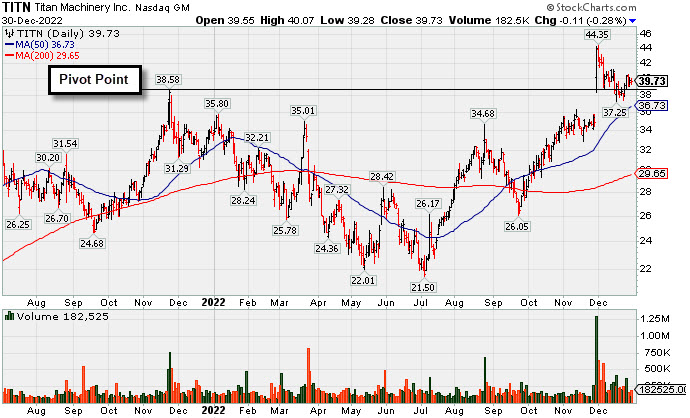
Found Support Near Prior High Following Breakout - Friday, December 30, 2022
Titan Machinery Inc (TITN -$0.11 or -0.28% to $39.73) recently found support when consolidating near the prior high in the $38 area. The next important support to watch is its 50-day moving average (DMA) line ($36.73).
Fundamentals remain strong after reporting Oct '22 quarterly earnings +91% on +47% sales revenues. It currently has the highest possible earnings Per Share Rating of 99. Following years of losses it has shown strong earnings growth for FY '19-22. TITN was highlighted in yellow with pivot point cited based on its 11/23/21 high plus 10 cents in the 11/30/22 mid-day report (read here). It was shown in greater detail that evening with an annotated graph under the headline, "Gap Up and Big Volume-Driven Breakout Gain".
The small supply of only 22.7 million shares outstanding (S criteria) can contribute to greater price volatility in the event of institutional buying or selling. The number of top-rated funds owning its shares rose from 241 in Dec '20 to 348 in Sep '22, a reassuring sign concerning the I criteria. Its current Up/Down Volume Ratio of 1.2 is an unbiased indication its shares have been under slight accumulation over the past 50 days.
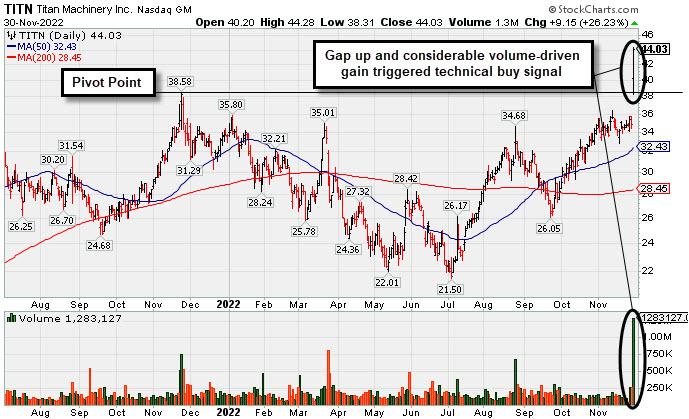
Gap Up and Big Volume-Driven Breakout Gain - Wednesday, November 30, 2022
Titan Machinery Inc (TITN +$9.15 or +26.23% to $44.03) finished strong after highlighted in yellow with pivot point cited based on its 11/23/21 high plus 10 cents in the earlier mid-day report (read here). It gapped up rallying for a big volume-driven gain and new all-time high, but it has quickly gotten extended from the prior highs. Disciplined investors avoid chasing stocks more than 5% above the prior high or pivot point.
TITN went through a long consolidation below its 200 DMA line since dropped from the Featured Stocks list on 1/26/22. Fundamentals remain strong. Bullish action came after it reported Oct '22 quarterly earnings +91% on +47% sales revenues versus the year ago period, continuing its streak of strong quarterly comparisons. It currently has the highest possible earnings Per Share Rating of 99. Following years of losses it has shown strong earnings growth for FY '19-22.
The small supply of only 22.6 million shares outstanding (S criteria) can contribute to greater price volatility in the event of institutional buying or selling. The number of top-rated funds owning its shares rose from 241 in Dec '20 to 344 in Sep '22, a reassuring sign concerning the I criteria. Its current Up/Down Volume Ratio of 1.3 is an unbiased indication its shares have been under slight accumulation over the past 50 days.
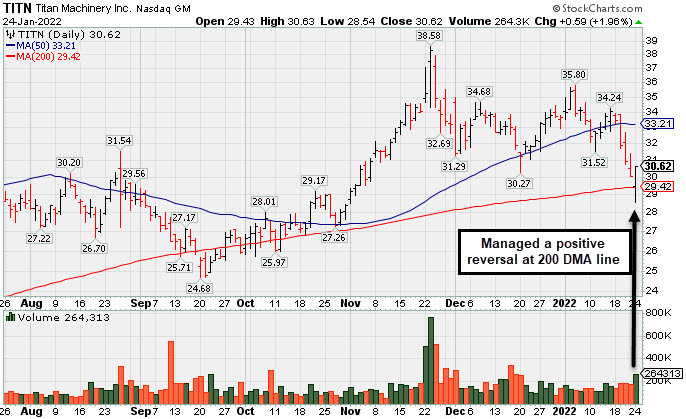
Positive Reversal After Undercutting 200-Day Moving Average - Monday, January 24, 2022
Titan Machinery Inc (TITN +$0.10 or +0.33% to $30.13) managed a "positive reversal" today after undercutting both its 200-day moving average (DMA) line ($29.42) and the prior low ($30.27 on 12/20/21). A rebound above the 50 DMA line ($33.21) is still needed for its outlook to improve. It faces resistance due to overhead supply up to the $38 level.
Fundamentals remain strong. TITN was first highlighted in yellow in the 11/23/21 mid-day report (read here) with pivot point cited base on its 6/01/21 high plus 10 cents. It was last shown in this FSU section on 12/31/21 with detailed analysis and an annotated graph under the headline, "Recently Found Support at 50-Day Moving Average Line". Bullish action came after it reported Oct '21 quarterly earnings +81% on +26% sales revenues versus the year ago period, its 4th strong quarterly comparison. It currently has the highest possible earnings Per Share Rating of 99. Following years of losses it has shown strong earnings growth for FY '19-21.
The small supply of only 22.6 million shares outstanding (S criteria) can contribute to greater price volatility in the event of institutional buying or selling. The number of top-rated funds owning its shares rose from 241 in Dec '20 to 315 in Dec '21, a reassuring sign concerning the I criteria. Its current Up/Down Volume Ratio of 1.1 is an unbiased indication its shares have been under slight accumulation over the past 50 days.
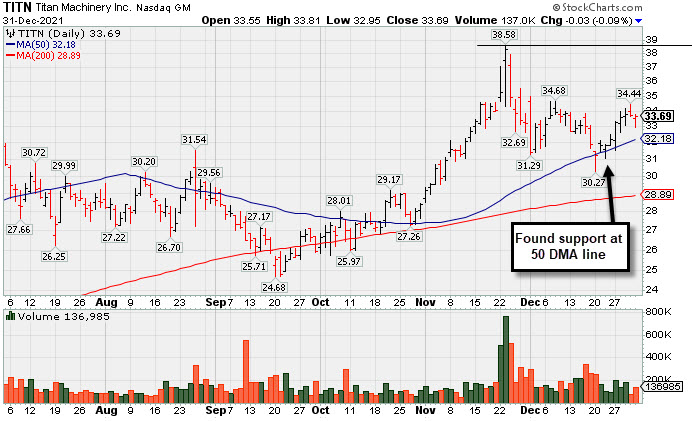
Recently Found Support at 50-Day Moving Average Line - Friday, December 31, 2021
Titan Machinery Inc (TITN -$0.03 or -0.09% to $33.69) has been consolidating after it found prompt support near its 50-day moving average (DMA) line ($32.18). It has not formed a sound base and faces some near-term resistance due to overhead supply up to the $38 level. TITN was first highlighted in yellow in the 11/23/21 mid-day report (read here) with pivot point cited base on its 6/01/21 high plus 10 cents. More detailed analysis an an annotated graph where shown that evening under the headline, "Strong Close With Gain Backed by +467% Above Average Volume".
Bullish action came after it reported Oct '21 quarterly earnings +81% on +26% sales revenues versus the year ago period, its 4th strong quarterly comparison. It currently has the highest possible earnings Per Share Rating of 99. Following years of losses it has shown strong earnings growth for FY '19-21.
The small supply of only 22.6 million shares outstanding (S criteria) can contribute to greater price volatility in the event of institutional buying or selling. The number of top-rated funds owning its shares rose from 241 in Dec '20 to 301 in Sep '21, a reassuring sign concerning the I criteria. Its current Up/Down Volume Ratio of 1.3 is an unbiased indication its shares have been under accumulation over the past 50 days.
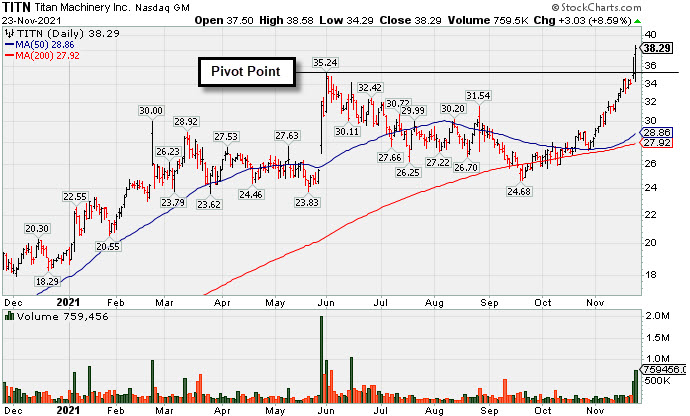
Strong Close With Gain Backed by +467% Above Average Volume - Tuesday, November 23, 2021
Titan Machinery Inc (TITN +$3.03 or +8.59% to $38.29) was highlighted in yellow in the earlier mid-day report (read here) with pivot point cited base on its 6/01/21 high plus 10 cents. It hit a new 52-week high with today's 2nd consecutive big volume-driven gain. The gain and strong close above the pivot point clinched a technical buy signal.
Bullish action came after it reported Oct '21 quarterly earnings +81% on +26% sales revenues versus the year ago period, its 4th strong quarterly comparison. Volume and volatility often increase near earnings news. It currently has the highest possible earnings Per Share Rating of 99. Following years of losses it has shown strong earnings growth for FY '19-21.
The small supply of only 22.6 million shares outstanding (S criteria) can contribute to greater price volatility in the event of institutional buying or selling. The number of top-rated funds owning its shares rose from 241 in Dec '20 to 306 in Sep '21, a reassuring sign concerning the I criteria. Its current Up/Down Volume Ratio of 1.4 is an unbiased indication its shares have been under accumulation over the past 50 days.