Slump to New Lows Hurts Outlook - Friday, August 2, 2024
Charts used courtesy of www.stockcharts.com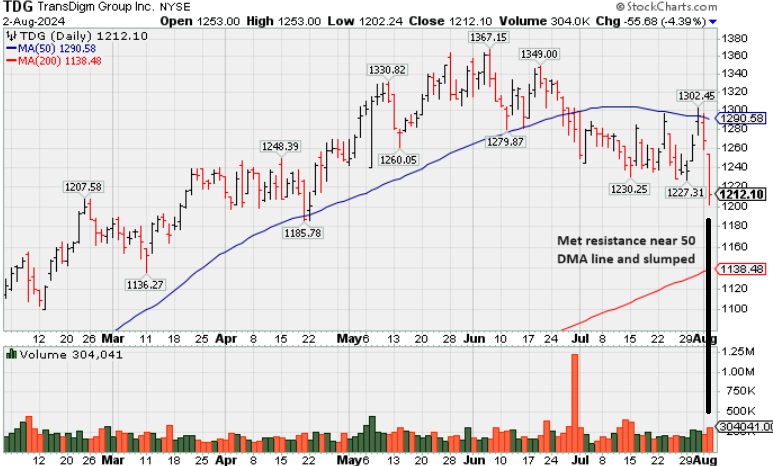
Lingering Below 50-Day Moving Average But Only -7% Off High - Wednesday, July 10, 2024
Charts used courtesy of www.stockcharts.com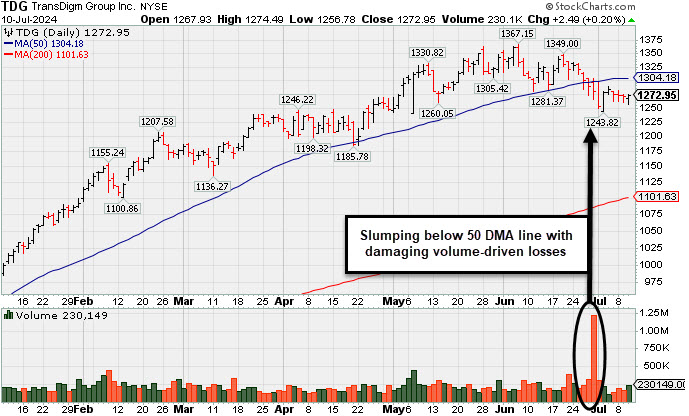
Transdigm Consolidating Above 50-Day Moving Average - Wednesday, June 12, 2024
Charts used courtesy of www.stockcharts.com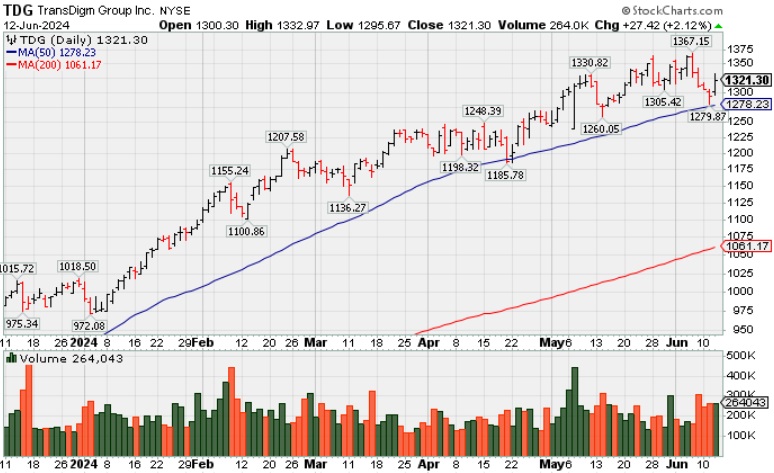
Aerospace/Defense Firm Hitting Another All-Time High - Tuesday, May 21, 2024
Charts used courtesy of www.stockcharts.com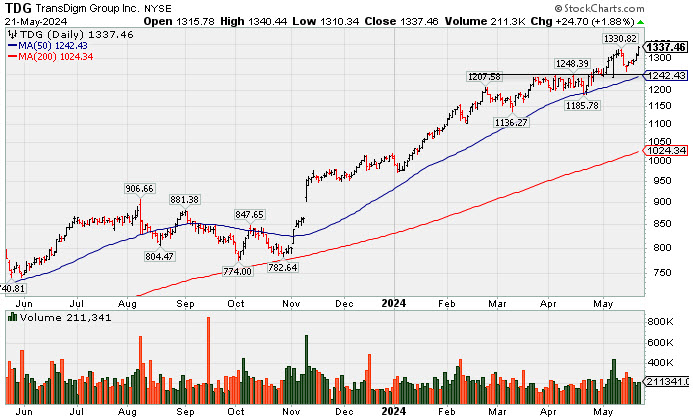
Found Support at 50-Day Moving Average Line and Hit New High - Tuesday, April 30, 2024
Transdigm Group Inc (TDG -$10.69 or -0.85% to $1,248.03) churned above average volume and ended with a small loss. It found prompt support at its 50-day moving average (DMA) line during a brief consolidation since last shown in the FSU section on 4/09/24 with an annotated graph under the headline, "Volume Totals Cooling While Perched Near High".Charts used courtesy of www.stockcharts.com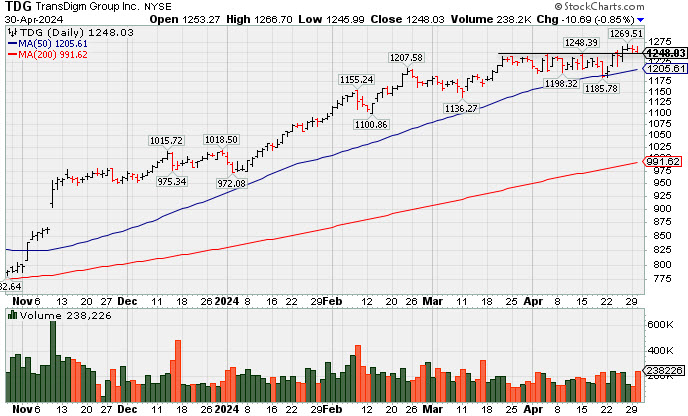
Volume Totals Cooling While Perched Near High - Tuesday, April 9, 2024
Transdigm Group Inc (TDG -$17.36 or -1.41% and $1,215.93) is holding its ground following a "negative reversal" on 4/04/24 after touching a new all-time high. Its 50-day moving average (DMA ) line ($1,173) defines near-term support to watch.Charts used courtesy of www.stockcharts.com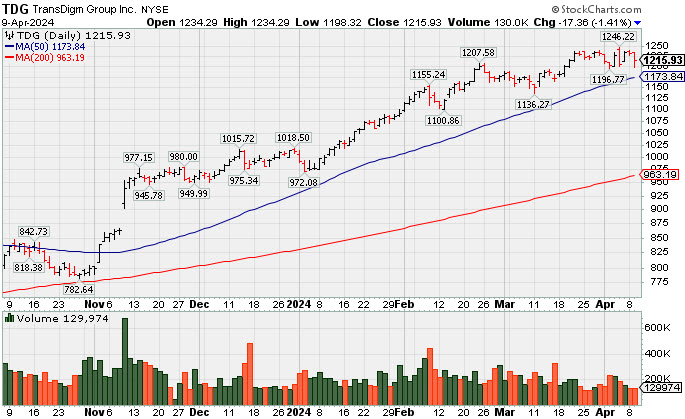
Perched in Tight Range Encountering Distribtion Near All-Time High - Friday, March 15, 2024
Transdigm Group Inc (TDG -$13.70 or -1.16% to $1,172.20) pulled back with higher volume yet remains perched near its all-time high after 3 weeks of tight closes. It has shown somew signs of distributional pressure with higher volume loss and lighter volume gains. Its 50-day moving average (DMA) line ($1,114) defines near-term support to watch.Charts used courtesy of www.stockcharts.com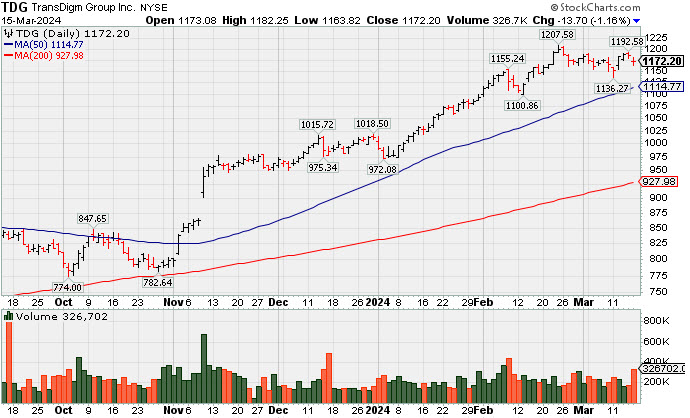
| Symbol/Exchange Company Name Industry Group | PRICE | CHANGE | Day High | Volume (% DAV) (% 50 day avg vol) | 52 Wk Hi | Featured Date | Price Featured | Pivot Featured |
| Max Buy | ||||||||
Arista Networks Computer-Networking | $277.73 | -6.29 -2.21% | $281.81 | 3,818,972 50 DAV is 2,395,000 | $292.66 -5.10% | 10/31/2023 | $188.84 | PP = $198.80 |
| MB = $208.74 | ||||||||
| Most Recent Note - 3/12/2024 9:43:43 PM G - Posted a solid gain today after testing support at its 50 DMA line ($263.70) on the prior session. It has not formed a sound base of sufficient length. >>> FEATURED STOCK ARTICLE : Best Ever Close for Arista Networks - 3/1/2024 | View all notes | Set NEW NOTE alert | Company Profile | SEC News | Chart | Request a new note | ||||||||
Novo Nordisk ADR Medical-Ethical Drugs | $132.37 | -2.21 -1.64% | $134.00 | 3,777,276 50 DAV is 5,503,000 | $138.28 -4.27% | 3/1/2024 | $124.23 | PP = $124.97 |
| MB = $131.22 | ||||||||
| Most Recent Note - 3/13/2024 12:40:50 PM G - Stubbornly holding its ground after last week it rallied from a noted new advanced "3-weeks tight" base with big volume-driven gains. Recent lows in the $118 area define initial support to watch above its 50 DMA line ($116.52). >>> FEATURED STOCK ARTICLE : Perched at All-Time High After Rallying from Advanced "3-Weeks Tight" - 3/12/2024 | View all notes | Set NEW NOTE alert | Company Profile | SEC News | Chart | Request a new note | ||||||||
Axon Enterprise Security/Sfty | $307.78 | +1.35 0.44% | $309.70 | 1,568,784 50 DAV is 471,000 | $325.63 -5.48% | 11/8/2023 | $127.84 | PP = $223.30 |
| MB = $234.47 | ||||||||
G - Posted a small gain today with heavy volume, still hovering near its all-time high. Bullish action came after it reported Dec '23 quarterly earnings +60% on +29% sales revenues versus the year-ago period. Its 50-day moving average (DMA) line ($272) defines near-term support to watch. See the latest FSU analysis for more details and an annotated graph. >>> FEATURED STOCK ARTICLE : Hovering Near All-Time High; Spiked Higher Following Earnings - 3/14/2024 | View all notes | Set NEW NOTE alert | Company Profile | SEC News | Chart | Request a new note | ||||||||
TransDigm Group Aerospace/Defense | $1,172.20 | -13.70 -1.16% | $1,182.25 | 326,702 50 DAV is 222,000 | $1,207.58 -2.93% | 12/12/2023 | $1,000.39 | PP = $1,013.18 |
| MB = $1,063.84 | ||||||||
G - Pulled back with higher volume yet remains perched near its all-time high after 3 weeks of tight closes. Its 50 DMA line ($1,114) defines near-term support to watch. See the latest FSU analysis for more details and a new annotated graph. >>> FEATURED STOCK ARTICLE : Perched in Tight Range Encountering Distribtion Near All-Time High - 3/15/2024 | View all notes | Set NEW NOTE alert | Company Profile | SEC News | Chart | Request a new note | ||||||||
CrowdStrike Holdings Computer Sftwr-Security | $315.63 | -12.96 -3.94% | $327.39 | 4,477,828 50 DAV is 4,231,000 | $365.00 -13.53% | 1/2/2024 | $246.42 | PP = $261.91 |
| MB = $275.01 | ||||||||
G - Pulled back with above-average volume today, closing -13.5% off its all-time high. It has not formed a sound base of sufficient length. Its 50 DMA ($305.25) recently acted as support. Fundamentals remain strong after it reported Jan ''24 quarterly earnings +102% on +33% sales revenues versus the year-ago period. >>> FEATURED STOCK ARTICLE : Encountered Distributional Pressure After Spiking to New High - 3/11/2024 | View all notes | Set NEW NOTE alert | Company Profile | SEC News | Chart | Request a new note | ||||||||
| Symbol/Exchange Company Name Industry Group | PRICE | CHANGE | Day High | Volume (% DAV) (% 50 day avg vol) | 52 Wk Hi | Featured Date | Price Featured | Pivot Featured |
| Max Buy | ||||||||
e.l.f. Beauty Cosmetics/Personal Care | $199.37 | -0.92 -0.46% | $201.51 | 1,654,926 50 DAV is 1,534,000 | $221.83 -10.12% | 1/2/2024 | $138.23 | PP = $153.63 |
| MB = $161.31 | ||||||||
| Most Recent Note - 3/14/2024 5:03:49 PM G - Extended from any sound base, it pulled back today with below-average volume. Its 50 DMA line ($174) defines important near-term support to watch. Fundamentals remain strong. >>> FEATURED STOCK ARTICLE : Encountering Distributional Pressure Near All-Time High - 3/8/2024 | View all notes | Set NEW NOTE alert | Company Profile | SEC News | Chart | Request a new note | ||||||||
Coca Cola Femsa Sab Ads Beverages - Soft Drinks | $98.33 | -1.31 -1.31% | $100.17 | 468,186 50 DAV is 172,500 | $104.38 -5.80% | 1/12/2024 | $93.38 | PP = $99.34 |
| MB = $104.31 | ||||||||
| Most Recent Note - 3/12/2024 9:37:21 PM Y - Posted a 2nd consecutive gain today with slightly above-average volume, finding support above its 50 DMA line ($95.23). There was a noted "negative reversal" on 2/20/24 at its all-time high. Reported Dec ''23 quarterly earnings -13% on +24% sales revenues versus the year-ago period, raising fundamental concerns. >>> FEATURED STOCK ARTICLE : Perched at High With Earnings News Due - 2/21/2024 | View all notes | Set NEW NOTE alert | Company Profile | SEC News | Chart | Request a new note | ||||||||
Paccar Trucks and Parts-Hvy Duty | $118.34 | +3.13 2.72% | $118.95 | 7,281,327 50 DAV is 2,270,000 | $116.88 1.25% | 1/23/2024 | $100.35 | PP = $98.57 |
| MB = $103.50 | ||||||||
G - Hitting a new all-time high with today's gain, steadily wedging higher with gains lacking great volume conviction. Its 50 DMA line ($105.12) defines near-term support to watch on pullbacks. Fundamentals remain strong. >>> FEATURED STOCK ARTICLE : Extended From Any Sound Base After 7 Weekly Gains - 2/26/2024 | View all notes | Set NEW NOTE alert | Company Profile | SEC News | Chart | Request a new note | ||||||||
Hubbell Electrical-Power/Equipmt | $395.15 | -6.68 -1.66% | $402.77 | 975,154 50 DAV is 421,000 | $404.15 -2.23% | 1/30/2024 | $343.26 | PP = $336.83 |
| MB = $353.67 | ||||||||
| Most Recent Note - 3/12/2024 9:01:56 PM G - Rallied for a new all-time high and closed at the session high with today''s volume-driven gain, getting more extended from the previously noted base. Its 50 DMA line ($350) defines important support to watch on pullbacks. >>> FEATURED STOCK ARTICLE : Inched to New Highs With Average Volume - 2/28/2024 | View all notes | Set NEW NOTE alert | Company Profile | SEC News | Chart | Request a new note | ||||||||
Manhattan Associates Computer Sftwr-Enterprse | $247.00 | -3.67 -1.46% | $249.43 | 1,081,810 50 DAV is 363,000 | $266.94 -7.47% | 1/31/2024 | $240.57 | PP = $230.71 |
| MB = $242.25 | ||||||||
| Most Recent Note - 3/12/2024 9:47:13 PM G - Posted a small gain today with +47% above average volume. It is extended from the previously noted base. Its 50 DMA line ($234) defines near-term support to watch above prior highs in the $230 area. >>> FEATURED STOCK ARTICLE : Hovering Near All-Time High After Streak of Small Gains - 2/29/2024 | View all notes | Set NEW NOTE alert | Company Profile | SEC News | Chart | Request a new note | ||||||||
| Symbol/Exchange Company Name Industry Group | PRICE | CHANGE | Day High | Volume (% DAV) (% 50 day avg vol) | 52 Wk Hi | Featured Date | Price Featured | Pivot Featured |
| Max Buy | ||||||||
U.S. Lime & Minerals Bldg-Cement/Concrt/Ag | $290.54 | -3.45 -1.17% | $298.18 | 81,380 50 DAV is 20,000 | $298.36 -2.62% | 2/9/2024 | $254.68 | PP = $265.09 |
| MB = $278.34 | ||||||||
G - There was a "negative reversal" today at its all-time high breaking a streak of 6 consecutive gains. Prior highs in the $265-266 area define initial near-term support to watch on pullbacks. >>> FEATURED STOCK ARTICLE : Hit New All Time High With Light Volume Behind 5th Straight Gain - 3/13/2024 | View all notes | Set NEW NOTE alert | Company Profile | SEC News | Chart | Request a new note | ||||||||
ServiceNow Computer Sftwr-Enterprse | $743.91 | -35.58 -4.56% | $762.00 | 2,538,189 50 DAV is 1,251,000 | $815.32 -8.76% | 2/22/2024 | $771.75 | PP = $815.32 |
| MB = $856.09 | ||||||||
G - Gapped down today and violated its 50 DMA line ($759) with a volume-driven loss raising concerns and triggering a technical sell signal. Its color code is changed to green. Prior lows in the &30 area define the next important near-term support to watch. A rebound above the 50 DMA line is needed for its outlook to improve. >>> FEATURED STOCK ARTICLE : Found Support With a Solid Gap Up from 10-Week Moving Average - 2/23/2024 | View all notes | Set NEW NOTE alert | Company Profile | SEC News | Chart | Request a new note | ||||||||
Synopsys Computer Sftwr-Design | $550.05 | -9.26 -1.66% | $562.00 | 1,347,261 50 DAV is 1,347,000 | $629.38 -12.60% | 2/22/2024 | $600.65 | PP = $582.85 |
| MB = $611.99 | ||||||||
| Most Recent Note - 3/13/2024 10:20:11 PM Y - Pulled back today with higher (still below-average) volume. Volume totals have been cooling in recent weeks while consolidating. The prior low ($555 on 3/11/24) defines near-term support above its 50 DMA line ($544.38). Previously noted - "A strong volume-driven gain and close above the pivot point is needed to clinch a proper technical buy signal. Reported Jan ''24 quarterly earnings +36% on +21% sales revenues versus the year-ago period, its 3rd strong quarter above the +25% minimum earnings guideline (C criteria). Annual earnings growth (A criteria) has been strong and steady." >>> FEATURED STOCK ARTICLE : Gapped Up for New High But Ended Near Session Low - 2/22/2024 | View all notes | Set NEW NOTE alert | Company Profile | SEC News | Chart | Request a new note | ||||||||
Paymentus Holdings Finance-CrdtCard/PmtPr | $23.16 | -0.32 -1.36% | $23.75 | 537,771 50 DAV is 277,000 | $24.99 -7.32% | 3/5/2024 | $19.97 | PP = $18.89 |
| MB = $19.83 | ||||||||
| Most Recent Note - 3/14/2024 12:16:57 PM G - Pulling back from its 52-week high with today's loss following 4 consecutive volume-driven gains. Very extended from the previously noted base. Prior highs in the $18 range define important initial support to watch on pullbacks. >>> FEATURED STOCK ARTICLE : Big Gap Up Gain Triggered Technical Buy Signal - 3/5/2024 | View all notes | Set NEW NOTE alert | Company Profile | SEC News | Chart | Request a new note | ||||||||
Transdigm Perched Near All-Time High - Wednesday, February 14, 2024
Transdigm Group Inc (TDG +$24.87 or +2.22% to $1,147.13) is extended from any sound base and managed a new high close with today's gain. Its 50-day moving average (DMA) line ($1,038) defines near-term support to watch above prior highs in the $1,013-1,015 area.ph under the headline, "Inching to New Highs With 6th Consecutive Gain".
Charts used courtesy of www.stockcharts.com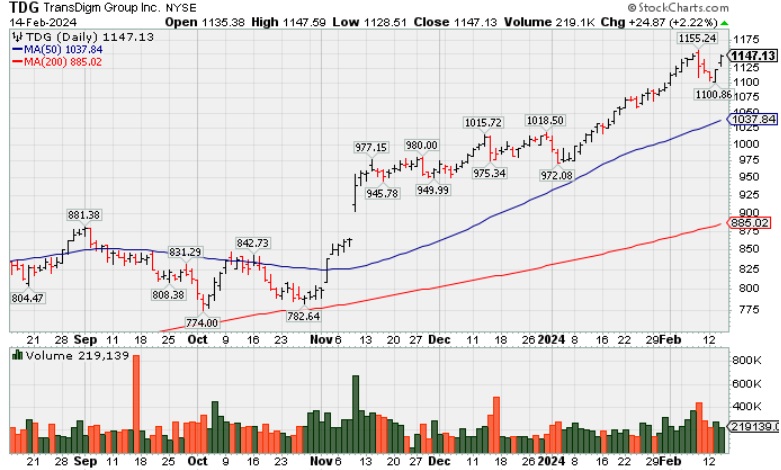
Inching to New Highs With 6th Consecutive Gain - Thursday, January 11, 2024
Transdigm Group Inc (TDG +$4.82 or +0.47% to $1,019.82) posted a 6th consecutive gain today with below-average volume. The new pivot point cited was based on its 11/14/23 high plus 10 cents. Gains above the pivot point must be backed by at least +40% above-average volume to trigger a proper new technical buy signal. Fundamentals remain strong. Important near-term support to watch is its 50-day moving average (DMA) line ($969).Charts used courtesy of www.stockcharts.com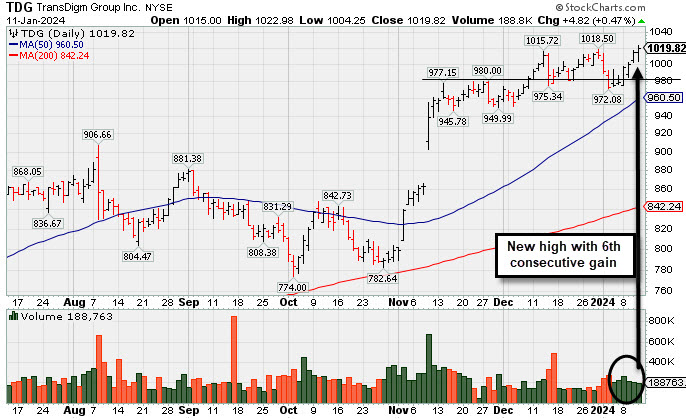
| Symbol/Exchange Company Name Industry Group | PRICE | CHANGE | Day High | Volume (% DAV) (% 50 day avg vol) | 52 Wk Hi | Featured Date | Price Featured | Pivot Featured |
| Max Buy | ||||||||
Arista Networks Computer-Networking | $251.74 | +2.51 1.01% | $252.15 | 1,256,845 50 DAV is 1,987,000 | $251.25 0.20% | 10/31/2023 | $188.84 | PP = $198.80 |
| MB = $208.74 | ||||||||
G - Posted a small gain today with light volume for another new all-time high. Its 50 DMA line ($224) defines near-term support above the prior low in the $210 area. Fundamentals remain strong. >>> FEATURED STOCK ARTICLE : Extended From Base and Hovering at All-Time High - 12/26/2023 | View all notes | Set NEW NOTE alert | Company Profile | SEC News | Chart | Request a new note | ||||||||
Novo Nordisk ADR Medical-Ethical Drugs | $106.69 | -1.98 -1.82% | $108.69 | 5,021,297 50 DAV is 4,238,000 | $108.98 -2.10% | 11/2/2023 | $100.97 | PP = $104.10 |
| MB = $109.31 | ||||||||
Y - Pulling back today after challenging its all-time high. Prior highs in the $105 area define initial support above its 50 DMA line ($101.34). >>> FEATURED STOCK ARTICLE : Gap Up Gain on Prior Session Triggered Technical Buy Signal - 1/5/2024 | View all notes | Set NEW NOTE alert | Company Profile | SEC News | Chart | Request a new note | ||||||||
Qualys Computer Sftwr-Security | $191.99 | +3.36 1.78% | $192.18 | 699,425 50 DAV is 376,000 | $206.35 -6.96% | 11/3/2023 | $167.50 | PP = $165.03 |
| MB = $173.28 | ||||||||
G - Posted a 3rd consecutive gain today with higher volume after finding prompt support near its 50 DMA line ($184). The 1/05/24 low ($180.01) defines important near-term support where more damaging losses would raise concerns. >>> FEATURED STOCK ARTICLE : Posted Light Volume Gain Finding Support at 50-Day Moving Average - 1/8/2024 | View all notes | Set NEW NOTE alert | Company Profile | SEC News | Chart | Request a new note | ||||||||
Axon Enterprise Security/Sfty | $249.59 | +0.57 0.23% | $251.72 | 383,934 50 DAV is 453,000 | $260.69 -4.26% | 11/8/2023 | $127.84 | PP = $223.30 |
| MB = $234.47 | ||||||||
| Most Recent Note - 1/9/2024 5:14:08 PM G - Pulled back today with average volume. Its 50-day moving average (DMA) line ($233) defines near-term support above prior highs in the $229-231 area. See the latest FSU analysis for more details and a new annotated graph. >>> FEATURED STOCK ARTICLE : Consolidating Well Above Near-Term Support - 1/9/2024 | View all notes | Set NEW NOTE alert | Company Profile | SEC News | Chart | Request a new note | ||||||||
TransDigm Group Aerospace/Defense | $1,019.82 | +4.82 0.47% | $1,022.98 | 188,763 50 DAV is 231,000 | $1,018.50 0.13% | 12/12/2023 | $1,000.39 | PP = $1,013.18 |
| MB = $1,063.84 | ||||||||
Y - Hit a new high as it posted a 6th consecutive gain today with below-average volume. See the latest FSU analysis for more details and a new annotated graph. >>> FEATURED STOCK ARTICLE : Inching to New Highs With 6th Consecutive Gain - 1/11/2024 | View all notes | Set NEW NOTE alert | Company Profile | SEC News | Chart | Request a new note | ||||||||
| Symbol/Exchange Company Name Industry Group | PRICE | CHANGE | Day High | Volume (% DAV) (% 50 day avg vol) | 52 Wk Hi | Featured Date | Price Featured | Pivot Featured |
| Max Buy | ||||||||
Palo Alto Networks Computer Sftwr-Security | $323.49 | +7.40 2.34% | $325.37 | 5,000,749 50 DAV is 4,364,000 | $318.00 1.73% | 1/10/2024 | $313.65 | PP = $318.00 |
| MB = $333.90 | ||||||||
| Most Recent Note - 1/10/2024 1:58:01 PM Y - Gapped up today on track for a 3rd consecutive gain challenging its all-time high. Color code is changed to yellow while noting that a valid secondary buy point exists up to 5% above the prior high after finding support at its 10 WMA line since the prior breakout. Fundamentals remain strong. >>> FEATURED STOCK ARTICLE : Consolidating After Volume-Driven Gains for All-Time Highs - 12/15/2023 | View all notes | Set NEW NOTE alert | Company Profile | SEC News | Chart | Request a new note | ||||||||
United Rentals Comml Svcs-Leasing | $551.70 | +2.02 0.37% | $552.83 | 567,222 50 DAV is 688,000 | $585.50 -5.77% | 12/1/2023 | $499.51 | PP = $488.73 |
| MB = $513.17 | ||||||||
| Most Recent Note - 1/9/2024 5:21:29 PM G - Quietly pulled back from its all-time high. Its 50 DMA line ($498) defines near-term support to watch above prior highs. >>> FEATURED STOCK ARTICLE : Perched Near All-Time High Following Volume-Driven Gains - 12/19/2023 | View all notes | Set NEW NOTE alert | Company Profile | SEC News | Chart | Request a new note | ||||||||
Amphastar Pharm Medical-Biomed/Biotech | $54.03 | -0.79 -1.44% | $54.64 | 720,046 50 DAV is 482,000 | $67.66 -20.14% | 12/4/2023 | $60.84 | PP = $58.35 |
| MB = $61.27 | ||||||||
| Most Recent Note - 1/10/2024 1:50:47 PM G - Color code is changed to green with today''s 4th consecutive volume-driven loss violating its 50 DMA line ($56.16) raising concerns and triggering a technical sell signal. Only a prompt rebound above the 50 DMA line would help its outlook improve. Fundamentals remain strong. >>> FEATURED STOCK ARTICLE : Consolidating Above Pivot Point With Volume Cooling - 12/21/2023 | View all notes | Set NEW NOTE alert | Company Profile | SEC News | Chart | Request a new note | ||||||||
The Bancorp Banks-Northeast | $39.42 | +0.38 0.97% | $39.61 | 471,719 50 DAV is 414,000 | $42.46 -7.16% | 12/4/2023 | $39.88 | PP = $41.62 |
| MB = $43.70 | ||||||||
| Most Recent Note - 1/9/2024 5:19:22 PM G - Still lingering below its 50 DMA line ($38.84) which may now act as resistance after damaging losses raised concerns. A prompt rebound above the 50 DMA line is needed for its outlook to improve. >>> FEATURED STOCK ARTICLE : Negative Reversals are Signs of Distributional Pressure - 12/22/2023 | View all notes | Set NEW NOTE alert | Company Profile | SEC News | Chart | Request a new note | ||||||||
lululemon athletica Retail-Apparel/Shoes/Acc | $485.48 | +1.38 0.29% | $486.21 | 823,650 50 DAV is 1,500,000 | $516.39 -5.99% | 12/8/2023 | $490.61 | PP = $485.93 |
| MB = $510.23 | ||||||||
| Most Recent Note - 1/9/2024 5:17:54 PM Y - Quietly pulling back from its all-time high and trading near its 2021 high of $485 which defines initial support to watch after its recent breakout from a 2+ year base. More damaging losses would raise greater concerns. >>> FEATURED STOCK ARTICLE : Perched at All-Time High With Volume Totals Cooling - 12/27/2023 | View all notes | Set NEW NOTE alert | Company Profile | SEC News | Chart | Request a new note | ||||||||
| Symbol/Exchange Company Name Industry Group | PRICE | CHANGE | Day High | Volume (% DAV) (% 50 day avg vol) | 52 Wk Hi | Featured Date | Price Featured | Pivot Featured |
| Max Buy | ||||||||
CrowdStrike Holdings Computer Sftwr-Security | $284.41 | +2.37 0.84% | $287.76 | 3,460,716 50 DAV is 3,202,000 | $282.32 0.74% | 1/2/2024 | $246.42 | PP = $261.91 |
| MB = $275.01 | ||||||||
| Most Recent Note - 1/10/2024 12:19:52 PM G - Color code was changed to green after rising above its "max buy" level and hitting another new 52-week high with today's 5th consecutive gain. A solid gain and close above the pivot point triggered a technical buy signal on the prior session. Reported Oct '23 quarterly earnings +105% on +35% sales revenues versus the year-ago period, extending its streak of strong earnings increases well above the +25% minimum guideline (C criteria) in quarterly comparisons. Faces no resistance due to overhead supply. Annual earnings history has been strong. Completed its $34 IPO on 6/12/19. >>> FEATURED STOCK ARTICLE : CrowdStrike Holdings Pulling Back After "3-Weeks Tight" Pattern - 1/3/2024 | View all notes | Set NEW NOTE alert | Company Profile | SEC News | Chart | Request a new note | ||||||||
e.l.f. Beauty Cosmetics/Personal Care | $159.07 | +3.44 2.21% | $160.21 | 1,120,841 50 DAV is 1,475,000 | $156.41 1.70% | 1/2/2024 | $138.23 | PP = $153.63 |
| MB = $161.31 | ||||||||
Y - Wedged to another new high with today''s 6th consecutive gain backed by below-average volume. Pivot point cited recently was based on its 12/20/23 high plus 10 cents after forming an advanced "3 weeks tight" base. Subsequent volume-driven gains for new highs are needed to trigger a technical buy signal. Reported Sep '23 quarterly earnings +128% on +76% sales revenues versus the year-ago period, adding to its streak of very strong quarterly results well above the +25% minimum earnings guideline (C criteria). Annual earnings (A criteria) history over the past 3 years has been strong, making it a better match with the fact-based investment system's fundamental guidelines. >>> FEATURED STOCK ARTICLE : Pulled Back After Closing 3 Weeks Tight - 1/2/2024 | View all notes | Set NEW NOTE alert | Company Profile | SEC News | Chart | Request a new note | ||||||||
Volume-Driven Loss Breaks Streak of 6 Straight Gains - Thursday, December 14, 2023
Transdigm Group Inc's (TDG -$24.36 or -2.41% to $987.00) suffered a loss with above average volume today breaking a streak of 6 consecutive gains after wedging to a new all-time high. A new pivot point was recently cited based on its 11/14/23 high plus 10 cents, however, the subsequent gains above the pivot point were not backed by the +40% above average volume necessary to trigger a proper new technical buy signal. Disciplined investors may watch for confirming gains to new highs as a sign of fresh institutional buying demand. Recent lows in the $950 area define near-term support to watch.Charts used courtesy of www.stockcharts.com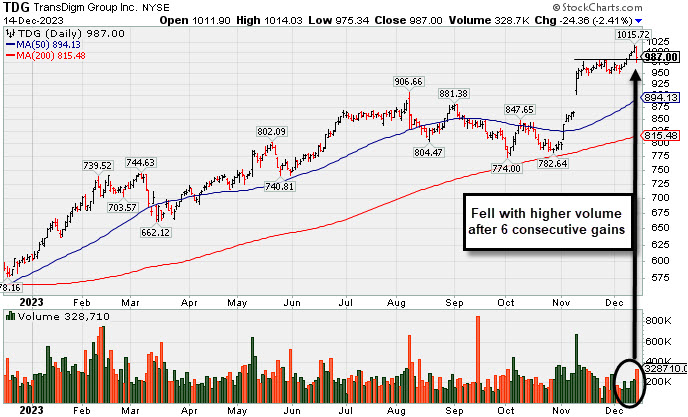
TransDigm's Big Gap Up Gain Triggered Technical Buy Signal - Thursday, November 9, 2023
Transdigm Group Inc's (TDG +$77.86 or +8.70% to $973.07) finshed strong after highlighted in yellow in the earlier mid-day report (read here) with pivot point cited based on its 8/08/23 high plus 10 cents. It hit a new all-time high (N criteria) triggering a technical buy signal with today's "breakaway gap" and 10th consecutive volume-driven gain. Bullish action came after it reported Sep '23 quarterly earnings +46% on +23% sales revenues versus the year-ago period, its 10th consecutive comparison above the +25% minimum earnings guideline (C criteria). Growth has been very strong after a downturn in FY '20 and '21 (A criteria) hurt its earnings track record. It has an 87 Earnings Per Share Rating.Charts used courtesy of www.stockcharts.com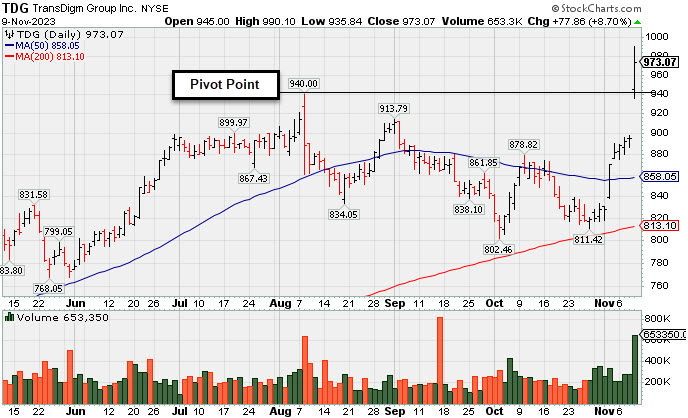
Fundamental and Technical Concerns Were Recently Raised - Wednesday, November 16, 2016
Transdigm Group Inc's (TDG -$3.13 or -1.21% to $255.79 ) fell today with above average volume. Its 50-day moving average (DMA) line ($262) may act as resistance following a volume-driven loss on 11/14/16 triggering a technical sell signal. It may find support near prior lows, however, a rebound above its 50 DMA line is needed for its outlook to improve.Recently it reported earnings +16% on +8% sales revenues for the Sep '16 quarter, below the +25% minimum earnings guideline (C criteria), raising fundamental concerns. TDG was last shown in this FSU section on 10/19/16 with an annotated graph under the headline, "Rebound Above 50-Day Moving Average Line Needed". Subsequent gains lacked great volume conviction as it rebounded and wedged to new highs but soon stalled.
Charts used courtesy of www.stockcharts.com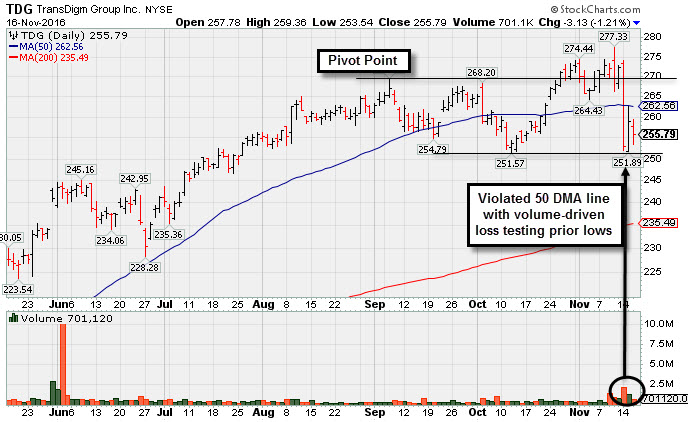
Rebound Above 50-Day Moving Average Line Needed - Wednesday, October 19, 2016
Transdigm Group Inc's (TDG -$0.42 or -0.15% to $281.66) is still sputtering below its 50-day moving average (DMA) line ($284.84). A rebound above that important short-term average is needed for its outlook improve. TDG was last shown in this FSU section on 9/07/16 with an annotated graph under the headline, "Light Volume Behind Gains Wedging for New Highs".Charts used courtesy of www.stockcharts.com
Light Volume Behind Gains Wedging for New Highs - Wednesday, September 7, 2016
Transdigm Group Inc's (TDG +$1.73 or +0.60% to $291.81) posted a 4th consecutive light volume gain for a new all-time high. Volume recently dried up while hovering in a tight range near its high. It is extended from any sound base and well above its 50-day moving average (DMA) line ($277) and prior highs near $268 defining near-term support to watch on pullbacks.Charts used courtesy of www.stockcharts.com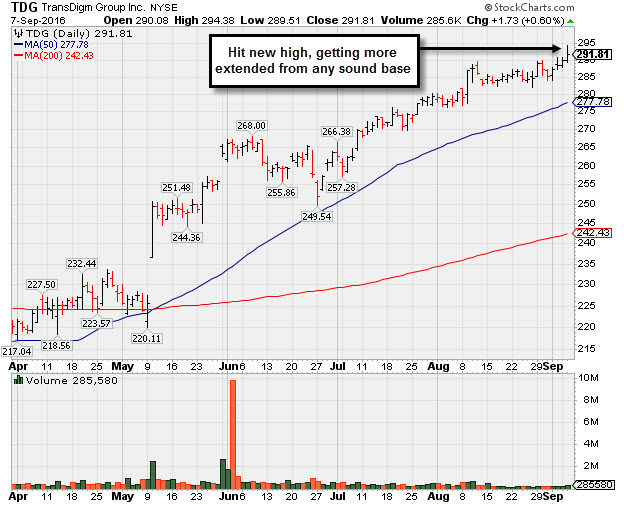
Gains Lack Great Volume While Wedging to New Highs - Wednesday, July 27, 2016
Transdigm Group Inc's (TDG +$0.85 or +0.31% to $278.15) volume totals still have been cooling while stubbornly holding its ground and inching further into new all-time high territory. Its 50-day moving average (DMA) line ($263) defines important near-term support to watch on pullbacks. TDG was last shown in this FSU section on 7/01/16 with an annotated graph under the headline, "Near Highs After Finding Support Above 50-Day Moving Average Line".Charts used courtesy of www.stockcharts.com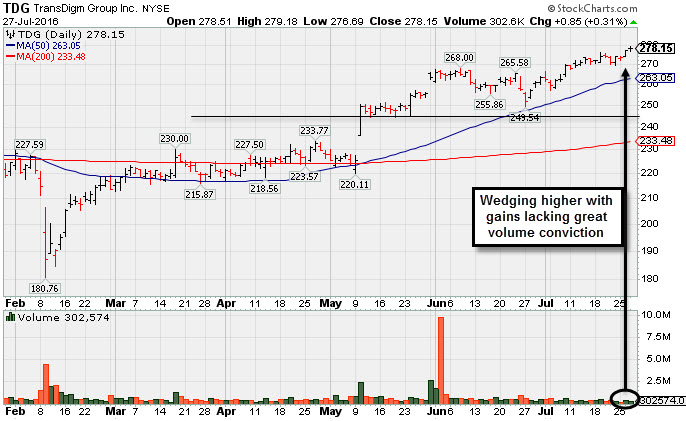
Near Highs After Finding Support Above 50-Day Moving Average Line - Friday, July 1, 2016
Transdigm Group Inc (TDG -$0.97 or -0.37% to $262.72) is consolidating above its "max buy" level. Recent lows and its 50-day moving average (DMA) line ($250.42) define important near-term support to watch on pullbacks.Charts used courtesy of www.stockcharts.com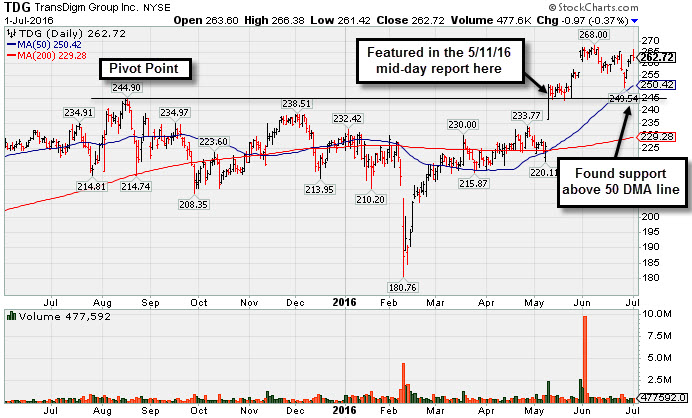
Getting Extended From Prior Base After More Volume-Driven Gains - Wednesday, June 1, 2016
Transdigm Group Inc (TDG +$2.55 or +0.97% to $266.09) is getting more extended from its prior base following a couple more considerable volume-driven gains. It was highlighted in yellow with pivot point based on its 8/18/15 high plus 10 cents in the 5/11/16 mid-day report (read here). It had gapped up on the prior session and hit a new high (N criteria) with a considerable volume-driven gain triggering a technical buy signal. It stubbornly held its ground after shown in this FSU section on 5/11/16 with an annotated graph under the headline, "Fundamentals Strong Behind Technical Breakout".Charts used courtesy of www.stockcharts.com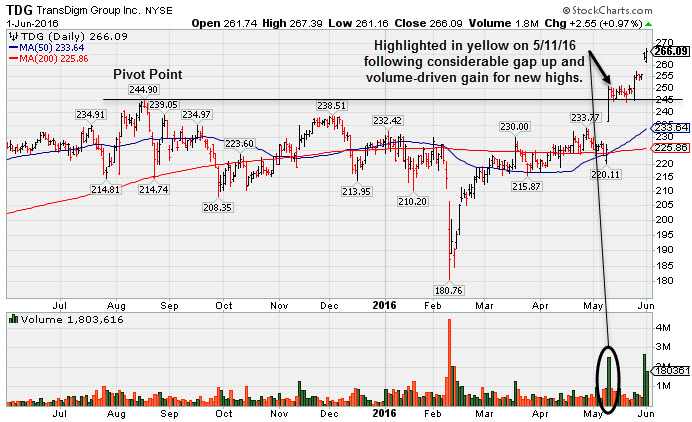
Fundamentals Strong Behind Technical Breakout - Wednesday, May 11, 2016
Transdigm Group Inc (TDG -$2.39 or -0.96% to $247.11) was highlighted in yellow with pivot point based on its 8/18/15 high plus 10 cents in the earlier mid-day report (read here). It gapped up on the prior session and hit a new high (N criteria) with a considerable volume-driven gain triggering a technical buy signal. It reported earnings +36% on +29% sales for the Mar '16 quarter, marking its 3rd consecutive quarterly comparison with earnings above the +25% minimum earning guideline (C criteria).Charts used courtesy of www.stockcharts.com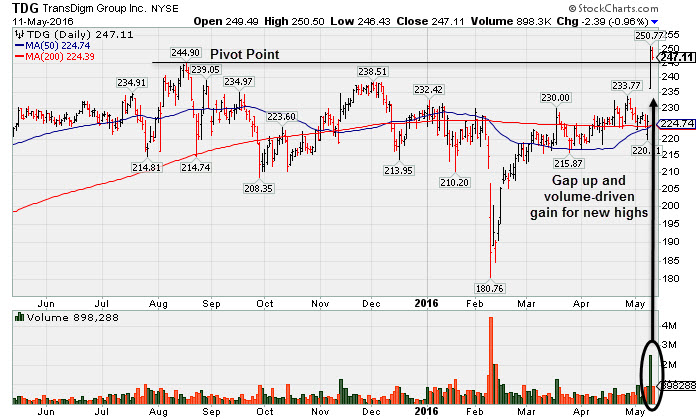
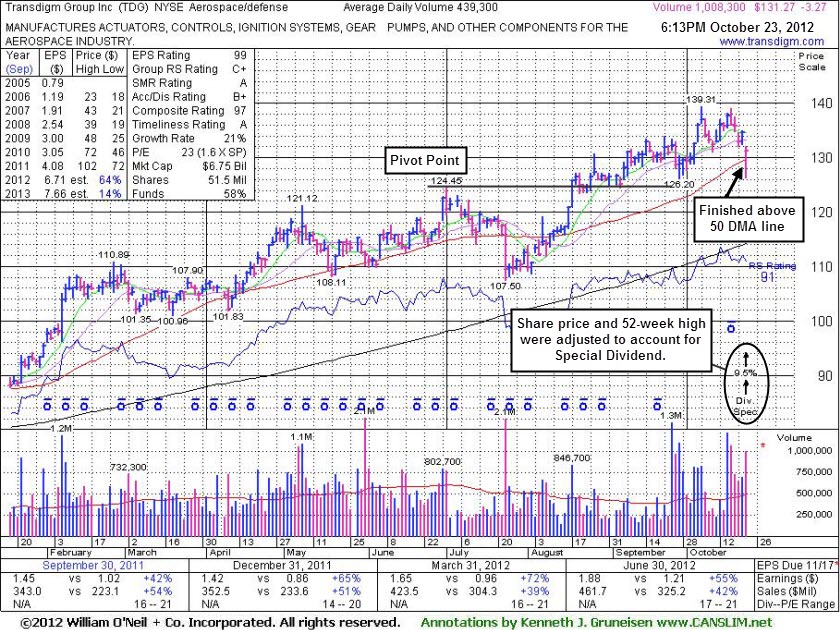
Resilient Near 50-Day Moving Average Line Following Special Dividend - Tuesday, October 23, 2012
Transdigm Group Inc (TDG -$3.27 or -2.43% to $131.27) gapped down today and raised concerns as it undercut its 50-day moving average (DMA) line, then it promptly rebounded back above that important short-term average. Recently it was noted as extended from its prior base. It was also noted when churning heavy volume without making meaningful price progress, price/volume action that has often been noted in past examples as a sign of distributional pressure. Members may review prior analysis via the "view all notes" link on any stocks highlighted in CANSLIM.net reports.On Monday its board of directors approved a special dividend of $12.85 a share. TransDigm will pay the dividend Nov. 5 to shareholders of record Oct. 25. The high-ranked Aerospace/Defense firm's last appearance in this FSU section was on 9/20/12 with an annotated graph under the headline, "Volume Light While Consolidating Under "Max Buy" Level" while hovering near new 52-week and all-time highs. Since then it stubbornly held its ground above prior highs and went on to rally further into new high territory. On the annotated graph below you will see that prices have been adjusted to account for the one-time dividend. Do not be confused when looking back at prior reports and data provided which may have not yet been adjusted accordingly.
Its current Up/Down Volume ratio of 1.9 is an unbiased indication that its shares were under accumulation over the past 50 days. The number of top-rated funds owning its share rose from 387 in Sep '11 to 518 in Sep '12, a reassuring trend concerning the I criteria. It reported earnings +55% on +42% sales revenues for the quarter ended June 30, 2012 versus the year ago period. Earnings comparisons above the +25% minimum guideline for earnings growth have solidly satisfied the C criteria. Its strong annual earnings history also satisfies the A criteria. In recent years it had rebounded and rallied to new highs following a deep consolidation after it was dropped from the Featured Stocks list 1/17/08.
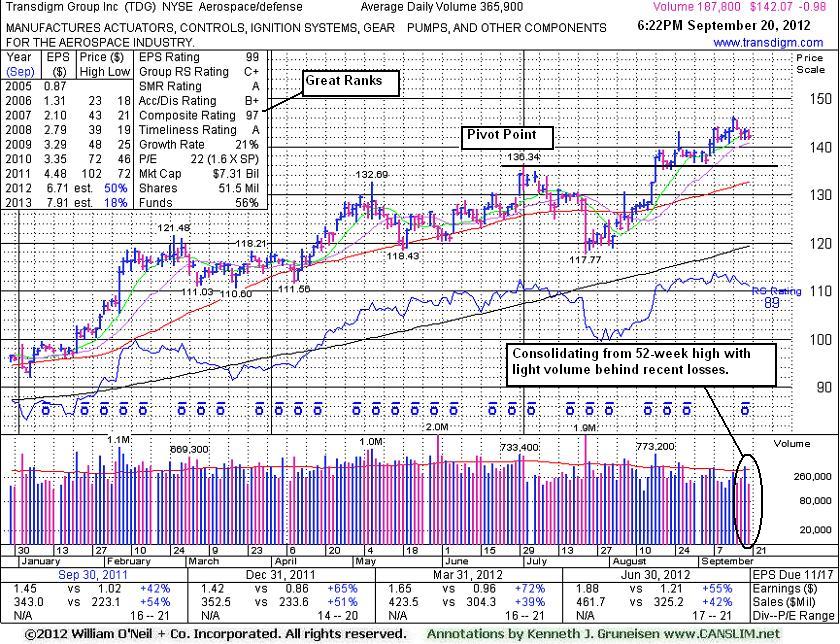
Volume Light While Consolidating Under "Max Buy" Level - Thursday, September 20, 2012
Transdigm Group Inc (TDG -$0.98 or -0.69% to $142.07) is perched only -2.8% off its all-time high. It pulled back on light volume and finished below its "max buy" level today, and its color code is changed to yellow. Prior highs along with its 50-day moving average (DMA) line define near-term chart support areas to watch on pullbacks where subsequent violations may raise concerns and trigger technical sell signals.
The high-ranked Aerospace/Defense firm's last appearance in this FSU section was on 8/17/12 with an annotated graph under the headline, "Finish Above New Pivot Point Backed By 86% Above Average Volume", as it posted a 7th consecutive gain while hitting new 52-week and all-time highs. Since then it stubbornly held its ground and went on to rally further into new high territory without hardly looking back.
The number of top-rated funds owning its share rose from 387 in Sep '11 to 470 in Jun '12, a reassuring trend concerning the I criteria. It reported earnings +55% on +42% sales revenues for the quarter ended June 30, 2012 versus the year ago period. Earnings comparisons above the +25% minimum guideline for earnings growth have solidly satisfied the C criteria. Its strong annual earnings history also satisfies the A criteria. In recent years it had rebounded and rallied to new highs following a deep consolidation after it was dropped from the Featured Stocks list 1/17/08. Members may review prior analysis via the "view all notes" link on any stocks highlighted in CANSLIM.net reports.
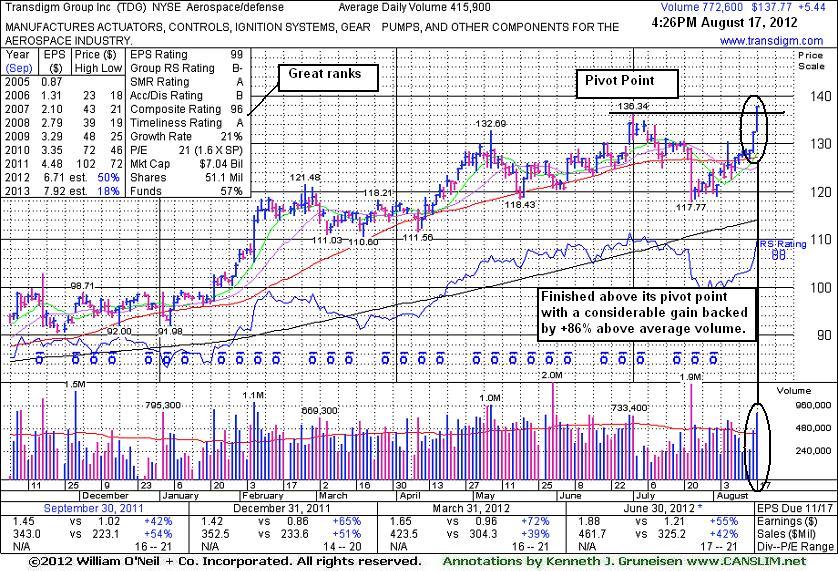
Finish Above New Pivot Point Backed By 86% Above Average Volume - Friday, August 17, 2012
Transdigm Group Inc (TDG +$5.44 or +4.11% to $137.77) posted a 7th consecutive gain, hitting new 52-week and all-time highs today. It finished above the new pivot point cited based on its 7/02/12 high plus 10 cents with a considerable gain backed by +86% above average volume clinching a new (or add-on) technical buy signal.
The high-ranked Aerospace/Defense firm's last appearance in this FSU section was on 7/18/12 with an annotated graph under the headline, "Found Support at 50-Day Average After Breakout Attempt Lacked Volume". Subsequent losses undercut that short-term average and an earlier chart low raising concerns and triggering technical sell signals, however it then immediately halted it slide and gradually repaired the damage. The number of top-rated funds owning its share rose from 387 in Sep '11 to 450 in Jun '12, a reassuring trend concerning the I criteria. It reported earnings +55% on +42% sales revenues for the quarter ended June 30, 2012 versus the year ago period. Earnings comparisons above the +25% minimum guideline for earnings growth have solidly satisfied the C criteria. Its strong annual earnings history also satisfies the A criteria. In recent years it had rebounded and rallied to new highs following a deep consolidation after it was dropped from the Featured Stocks list 1/17/08. Members may review prior analysis via the "view all notes" link on any stocks highlighted in CANSLIM.net reports.
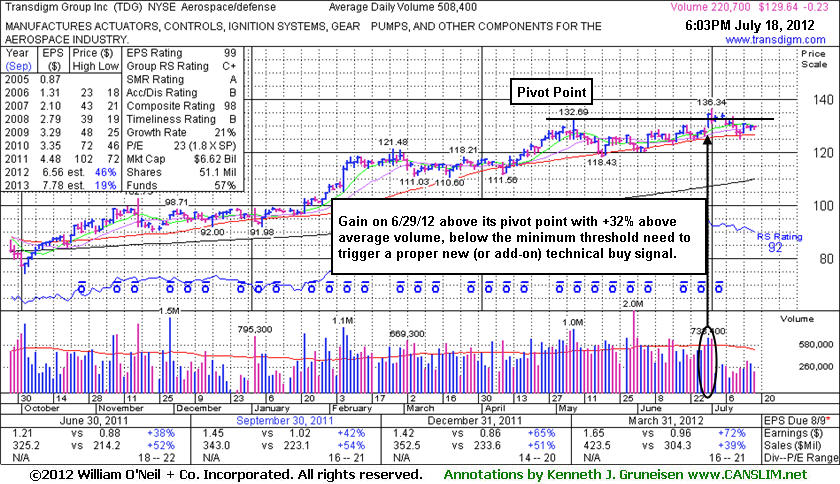
Found Support at 50-Day Average After Breakout Attempt Lacked Volume - Wednesday, July 18, 2012
Transdigm Group Inc (TDG -$0.23 or -0.18% to $129.64) recently halted its slide at its 50-day moving average (DMA) line which defines important support to watch. The 6/29/12 gain above its pivot point was backed by only +32% above average volume, below the minimum threshold needed to trigger a proper new (or add-on) technical buy signal. The high-ranked Aerospace/Defense firm's last appearance in this FSU section was on 6/18/12 with an annotated graph under the headline, "New Pivot Point Cited After Orderly Consolidation". It remains perched within close striking distance of its all-time high. Its pivot point cited is based on its 5/08/12 high plus 10 cents. As previously noted - "Patient investors will watch to see signs of fresh institutional accumulation. Volume-driven gains above the pivot point may trigger a new (or add-on) technical buy signal."The number of top-rated funds owning its share rose from 364 in Mar '11 to 439 in Mar '12, a reassuring trend concerning the I criteria. It reported earnings +72% on +39% sales revenues for the quarter ended March 31, 2012 versus the year ago period. That marked another increase in a streak of accelerating earnings comparisons above the +25% minimum guideline for earnings growth (solidly satisfying the C criteria). Its strong annual earnings history also satisfies the A criteria. In recent years it had rebounded and rallied to new highs following a deep consolidation after it was dropped from the Featured Stocks list 1/17/08. Members may review prior analysis via the "view all notes" link on any stocks highlighted in CANSLIM.net reports.
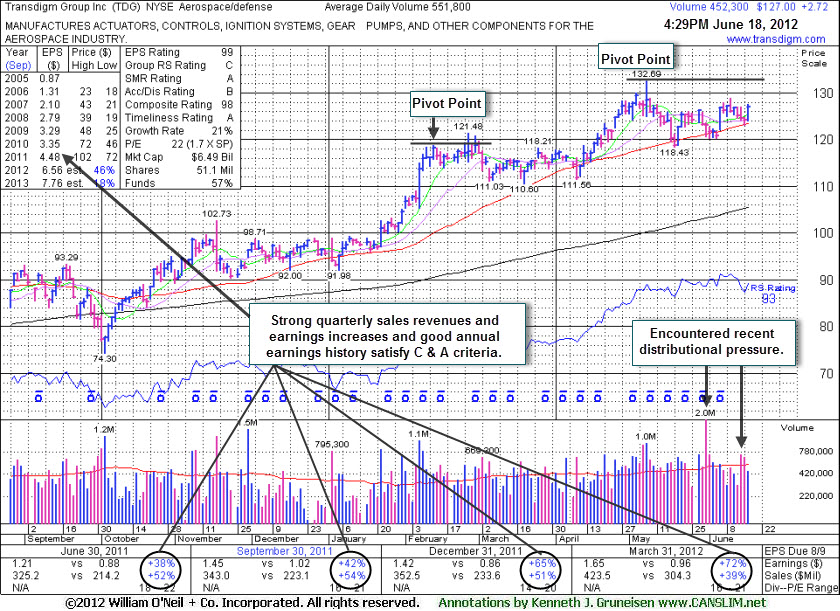
New Pivot Point Cited After Orderly Consolidation - Monday, June 18, 2012
Transdigm Group Inc (TDG +$2.72 or +2.19% to $127.00) has been consolidating above important support at its 50-day moving average (DMA) line while perched within close striking distance of its all-time high. Its color code was changed to yellow with a new pivot point cited based on its 5/08/12 high plus 10 cents. The annotated chart below illustrates that it has endured some recent distributional pressure, and patient investors will watch to see signs of fresh institutional accumulation. Volume-driven gains above the pivot point may trigger a new (or add-on) technical buy signal.Its prior low ($118.43 on 5/18/12) defines the next important near-term chart support level to watch below its 50 DMA line. The high-ranked Aerospace/Defense firm's last appearance in this FSU section was on 5/23/12 with an annotated graph under the headline, "Prior Highs and 50-Day Moving Average Acted as Support". It had failed to break out when an advanced "3-weeks tight" base pattern had recently been cited. After finding support near the 50 DMA line, volume-driven gains in April and May lifted it to new high territory before it began its current 7-week consolidation.
The number of top-rated funds owning its share rose from 364 in Mar '11 to 420 in Mar '12, a reassuring trend concerning the I criteria. It reported earnings +72% on +39% sales revenues for the quarter ended March 31, 2012 versus the year ago period. That marked another increase in a streak of accelerating earnings comparisons above the +25% minimum guideline for earnings growth (solidly satisfying the C criteria). Its strong annual earnings history also satisfies the A criteria. In recent years it had rebounded and rallied to new highs following a deep consolidation after it was dropped from the Featured Stocks list 1/17/08. Members may review prior analysis via the "view all notes" link on any stocks highlighted in CANSLIM.net reports.
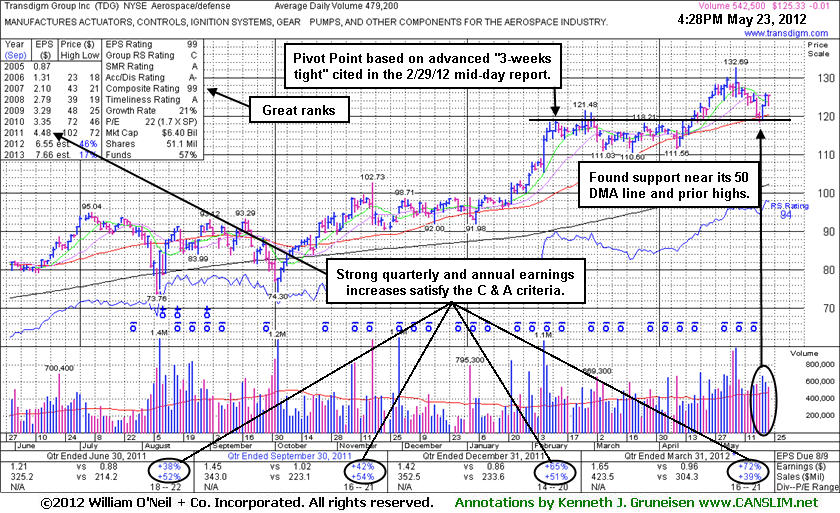
Prior Highs and 50-Day Moving Average Acted as Support - Wednesday, May 23, 2012
Transdigm Group Inc (TDG -$0.01 or -0.01% to $125.33) held its ground today after tallying 2 solid gains backed by above average volume. The gains are a sign of prompt support arriving at its 50-day moving average (DMA) line and near prior highs which also define important chart support. Poor market conditions (M criteria) argue against making any new buying efforts until a new confirmed rally by at least one of the major averages with a solid follow-through day. The high-ranked Aerospace/Defense firm's last appearance in this FSU section was on 3/30/12 with an annotated graph under the headline, "Enduring Distribution While Consolidating Above 50-Day Average", and after that appearance there was a "shake out" on 4/10/12 as it violated its 50 DMA line with a loss on above average volume. However, it made a stand before undercutting earlier lows and it promptly rebounded back above that important short-term average.A volume-driven gain on 4/20/12 confirmed a technical buy signal and subsequent gains with heavy volume helped it hit new all-time highs before beginning its latest consolidation. Members may review prior analysis via the "view all notes" link on any stocks highlighted in CANSLIM.net reports.
The number of top-rated funds owning its share rose from 364 in Mar '11 to 430 in Mar '12, a reassuring trend concerning the I criteria. It reported earnings +72% on +39% sales revenues for the quarter ended March 31, 2012 versus the year ago period. That marked another increase in a streak of accelerating earnings comparisons above the +25% minimum guideline for earnings growth (solidly satisfying the C criteria). Its strong annual earnings history also satisfies the A criteria. In recent years it had rebounded and rallied to new highs following a deep consolidation after it was dropped from the Featured Stocks list 1/17/08. Members can review all prior notes, featured articles and analysis with annotated graphs via the Company Profile page where earlier pivot points were identified on annotated graphs.
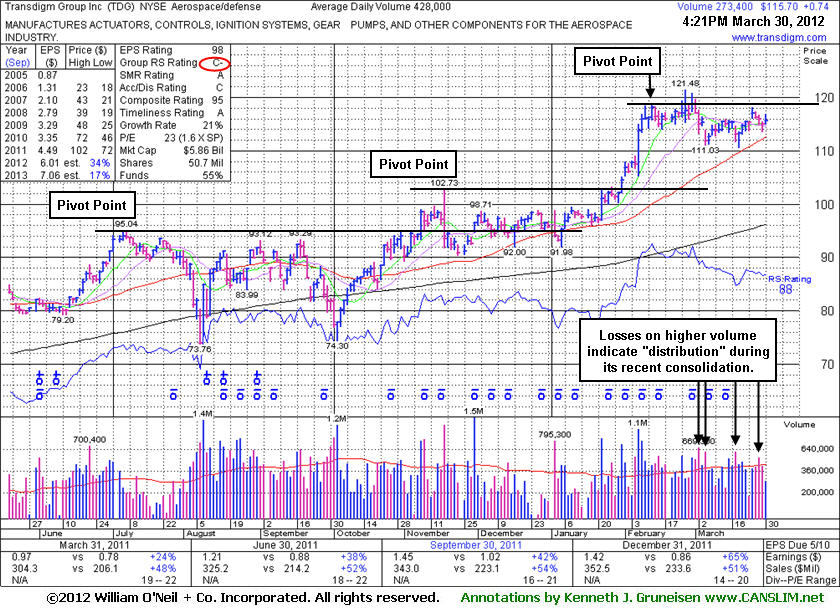
Enduring Distribution While Consolidating Above 50-Day Average - Friday, March 30, 2012
Transdigm Group Inc (TDG +$0.86 or +0.75% to $115.82) was up today on light volume after enduring mild distributional pressure this week. Its 50-day moving average (DMA) line defines important chart support to watch, and a violation of that important short-term average would trigger a technical sell signal. Distributional action in recent weeks is a cause for concern, yet it finished the week -4.6% off its 52-week high and it has very little overhead supply remaining to act as resistance. It remains below its latest pivot point cited. The number of top-rated funds owning its share rose from 364 in Mar '11 to 425 in Dec '11, a reassuring trend concerning the I criteria. A volume-driven gain above its latest pivot point for a new high close would trigger a new (or add-on) technical buy signal.
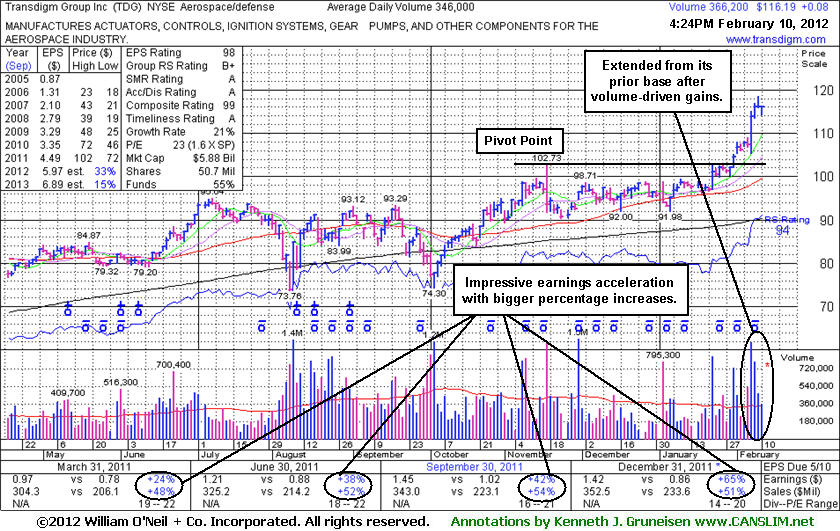
The Aerospace/Defense group's Relative Strength Rating fell from B+ to a C- (see red circle) since its last appearance in this FSU section on 2/10/12 with an annotated graph under the headline, "Earnings Increases Showing Acceleration Bodes Well". It had just seen a spurt of volume-driven gains into new high territory, and since then it has been consolidating in an orderly fashion. It reported earnings +65% on +51% sales revenues for the quarter ended December 31, 2011 versus the year ago period. That marked another increase in a streak of accelerating earnings comparisons above the +25% minimum guideline for earnings growth (solidly satisfying the C criteria). Its strong annual earnings history also satisfies the A criteria. In recent years it had rebounded and rallied to new highs following a deep consolidation after it was dropped from the Featured Stocks list 1/17/08. Its more recent pivot points are identified on the annotated graph below. Members can review all prior notes, featured articles and analysis with annotated graphs via the Company Profile page.
Earnings Increases Showing Acceleration Bodes Well - Friday, February 10, 2012
Transdigm Group Inc (TDG +$0.08 to $116.19) has seen volume-driven gains lift it more than +5% above the pivot point or the "max buy" level. As it reached new high territory there has been no overhead supply to act as resistance. On pullbacks the prior highs near $102 define the initial support level to watch above its 50-day moving average (DMA) line.The prompt rebounded above its 50-day moving average (DMA) line was a sign of great institutional support immediately following its 1/04/12 appearance in this FSU section with an annotated graph under the headline, "Damaging 50-Day Moving Average Violation Raised Concerns." Its subsequent gains to new highs made it an action-worthy buy candidate. It also reported earnings +65% on +51% sales revenues for the quarter ended December 31, 2011 versus the year ago period. That marked another increase in a streak of accelerating earnings comparisons above the +25% minimum guideline for earnings growth (solidly satisfying the C criteria). Its strong annual earnings history also satisfies the A criteria. In recent years it had rebounded and rallied to new highs following a deep consolidation after it was dropped from the Featured Stocks list 1/17/08.
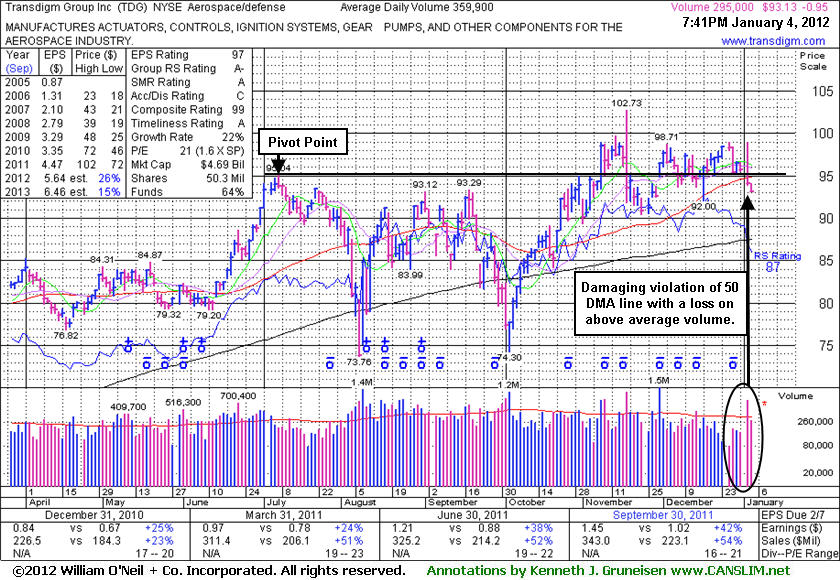
Damaging 50-Day Moving Average Violation Raised Concerns - Wednesday, January 04, 2012
Transdigm Group Inc (TDG -$0.95 or -1.01% to $93.13) slumped even lower today on lighter volume, rather than promptly repairing a damaging 50-day moving average (DMA) line violation. It was noted on the prior session as it erased early gains and violated its 50-day moving average (DMA) line, closing near the session low and raising concerns. Its loss on more than 2 times average volume triggered a technical sell signal, and its color code was changed to green after the worrisome sign of distributional pressure.
It would take a rebound above it 50 DMA line to help its outlook improve, and subsequent gains to new high closes would give it the look of an action-worthy buy candidate. Meanwhile, the path of least resistance may lead it to a deeper consolidation. Prior lows in the $90 define a support area that comes into play before its longer-term 200 DMA line. Its current Up/Down Volume Ratio of 1.2 still hints at near-term accumulation, however that is down from 1.5 while its Accumulation/Distribution rank also slipped to C from a B- when it made its last appearance in this FSU section on 12/06/11 with an annotated graph under the headline, "Little Resistance Remains Due To Overhead Supply."
The number of top-rated funds owning its shares rose from 351 in Dec '10 to 400 in Sep '11, a somewhat reassuring trend concerning the I criteria. as well. Its small supply of only 43.3 millions shares (S criteria) in the public float can also make is a big mover in the event of institutional accumulation or distribution. It reported earnings +42% on +54% sales revenues for the quarter ended September 30, 2011 versus the year ago period. Prior earnings comparisons near or above the +25% guideline and its strong annual earnings history satisfy the C and A criteria. In recent years it had rebounded and rallied to new highs following a deep consolidation after it was dropped from the Featured Stocks list 1/17/08.
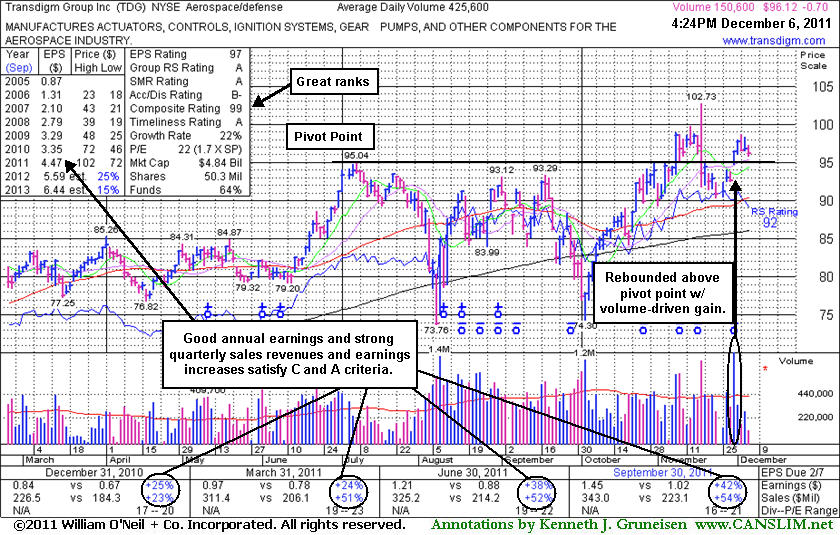
Little Resistance Remains Due To Overhead Supply - Tuesday, December 06, 2011
Transdigm Group Inc (TDG -$0.68 or -0.70% to $96.14) rebounded back above its pivot point with a volume-driven gain on 11/30/11. It stayed well above its 50-day moving average (DMA) line during its recent consolidation since its negative reversal after hitting a new all-time high on 11/17/11. Little resistance remains due to overhead supply. A subsequent slump below the recent low and its 50 DMA line would trigger more worrisome technical sell signals.
Its last appearance in this FSU section was on 11/09/11 with an annotated graph under the headline, "Strong Characteristics Shown In High-Ranked Aerospace/Defense Firm." A volume-driven gain on 11/08/11 had helped it break out from a 19-week base. It reported earnings +42% on +54% sales revenues for the quarter ended September 30, 2011 versus the year ago period. Prior earnings comparisons near or above the +25% guideline and its strong annual earnings history satisfy the C and A criteria. In recent years it had rebounded and rallied to new highs following a deep consolidation after it was dropped from the Featured Stocks list 1/17/08.
The number of top-rated funds owning its shares rose from 352 in Dec '10 to 396 in Sep '11, a somewhat reassuring trend concerning the I criteria. Its Up/Down Volume Ratio of 1.5 currently hints at near-term accumulation as well. Its small supply of only 43.3 millions shares (S criteria) in the public float can also make is a big mover in the event of institutional accumulation or distribution.
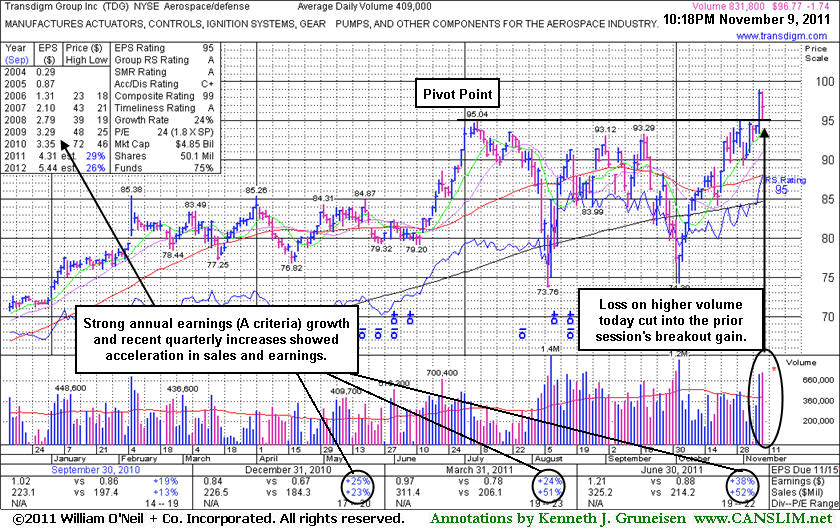
Strong Characteristics Shown In High-Ranked Aerospace/Defense Firm - Wednesday, November 09, 2011
Often, when a leading stock is setting up to breakout of a solid base it is highlighted in CANSLIM.net's Mid-Day Breakouts Report. The most relevant factors are noted in the report which allows prudent CANSLIM oriented investors to place the issue in their watch list. After doing any necessary backup research, the investor is prepared to act if and when the stock triggers a technical buy signal (breaks above its pivot point on more than +50% average turnover). In the event the stock fails to trigger a technical buy signal and its price declines then it will simply be removed from the watch list. In other cases, stocks may be featured in CANSLIM.net's Mid-Day Breakouts Report.after recent action already triggered technical buy signal. Disciplined investors know to buy as near as possible to the pivot point and avoid chasing stocks after they have rallied more than +5% above their pivot point. It is crucial to always limit losses whenever any stock heads the wrong direction, and disciplined investors sell if a struggling stock ever falls more than -7% from their purchase price.
Transdigm Group Inc (TDG -$1.74 or -1.77% to $96.77) hit a new 52-week high on the prior session with a volume-driven gain helping it break out from a 19-week base. Today it pulled back on higher volume while consolidating above prior highs while it was featured in yellow in the mid-day report (read here) with a pivot point based on its 7/07/11 high plus 10 cents. Reported earnings +38% on +52% sales revenues for the quarter ended June 30, 2011 versus the year ago period. Prior earnings comparisons were right at the +25% guideline and it has maintained a strong annual earnings history (A criteria). Volume and volatility often increase near earnings news and it is due to report earnings for the September period soon. In recent years it has rebounded and rallied to new highs following a deep consolidation after it was dropped from the Featured Stocks list 1/17/08.
The number of top-rated funds owning its shares rose from 383 in Dec '10 to 401 in Sep '11, a somewhat reassuring trend concerning the I criteria. Its Up/Down Volume Ratio of 1.2 currently hints at near-term accumulation as well. Its small supply of only 43.1 millions shares (S criteria) in the public float can also make is a big mover in the event of institutional accumulation or distribution. Disciplined investors always limit losses at -7% from their purchase price to remove the possibility of any small loss growing to become a larger and potentially more devastating loss. Pyramiding into positions also is a smart tactic to let the market action dictate how heavily weighted an investor may get into any promising buy candidates.
Light Volume Pullbacks Offered Chance For Disciplined Buyers - Friday, October 05, 2007
Statistically, about 40% of winning stocks will pull back after breaking out. In other words, it is not uncommon for stocks to pullback and retest support near their pivot point after breaking out. It is important to see the bulls show up and offer support at or above the pivot point. This may offer investors a chance to increase their exposure before the stock continues advancing. However, an important caveat is that volume should contract as the stock pulls back towards its pivot point. Heavy volume behind losses can be cause for concern, especially if the stock does not find support at its pivot point. Whenever a recent breakout is completely negated by a loss that leads to a close back in the prior base, this is construed as a technical sell signal and a sign that the bears are regaining control.
TransDigm Group Incorporated (TDG +$1.46 or +3.26% to $46.20) rallied on above average volume after recently pulling back and finding support near its pivot point. TDG was featured at $42.67 in yellow in the Monday, September 24th, 2007 CANSLIM.net Mid-Day Breakouts Report at with a $43.99 pivot point and $46.19 maximum buy price (read here). Two days later, TDG appeared in a CANSLIM.net Stock Bulletin (read here) with a more detailed analysis indicating its healthy attributes. After its breakout, TDG spent the next several trading sessions pulling back on relatively light volume toward a possible retest of support near its pivot point. The bulls showed up and curbed the bears' selling by defending its pivot point. The light volume pullback gave investors another chance to accumulate shares below its maximum buy price. Going forward, as long as this stock trades above its pivot point then odds favor even further gains. Conversely, if that important level is violated and it falls back into its prior base, then odds will be stacked against it making great progress, as it will be likely to spend more time consolidating. Remember to always limit losses if any stock you buy falls 7-8% below your purchase price.
C A N S L I M | StockTalk | News | Chart | ![]()
![]()
![]() SEC | Zacks Reports
SEC | Zacks Reports

View all notes | Alert me of new notes | CANSLIM.net Company Profile