You are not logged in.
This means you
CAN ONLY VIEW reports that were published prior to Sunday, March 23, 2025.
You
MUST UPGRADE YOUR MEMBERSHIP if you want to see any current reports.
AFTER MARKET UPDATE - TUESDAY, MAY 21ST, 2024
Previous After Market Report Next After Market Report >>>
|
|
|
|
DOW |
+66.22 |
39,872.99 |
+0.17% |
|
Volume |
834,837,308 |
+3% |
|
Volume |
6,384,253,800 |
-8% |
|
NASDAQ |
+37.75 |
16,832.62 |
+0.22% |
|
Advancers |
1,325 |
48% |
|
Advancers |
1,785 |
42% |
|
S&P 500 |
+13.28 |
5,321.41 |
+0.25% |
|
Decliners |
1,441 |
52% |
|
Decliners |
2,455 |
58% |
|
Russell 2000 |
-4.14 |
2,098.36 |
-0.20% |
|
52 Wk Highs |
179 |
|
|
52 Wk Highs |
135 |
|
|
S&P 600 |
-1.08 |
1,336.58 |
-0.08% |
|
52 Wk Lows |
34 |
|
|
52 Wk Lows |
112 |
|
|
 |
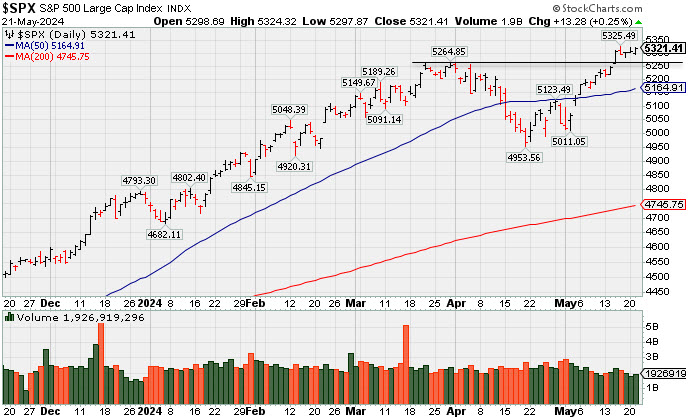
Major Indices Quietly Post Small Gains
Kenneth J. Gruneisen - Passed the CAN SLIM® Master's Exam
The major indices posted small gains on Tuesday and ended near the session highs. Volume reported was mixed, higher than the prior session total on the NYSE and lighter on the Nasdaq exchange. Decliners led advancers by a very narrow margin on the NYSE and bya 4-3 margin on the Nasdaq exchange. There were 64 high-ranked companies from the Leaders List that hit new 52-week highs and were listed on the BreakOuts Page versus 97 on the prior session. New 52-week highs totals contracted yet still outnumbered new 52-week lows on the NYSE and on the Nasdaq exchange. The major indices are in a confirmed uptrend (M criteria).
PICTURED: The S&P 500 Index posted a 3rd consecutive gain and closed at a new all-time high.
Palo Alto Networks (PANW -3.74%) was among the standouts with a negative response to earnings news. The S&P 500 consumer discretionary sector logged a gain with help fromf Tesla (TSLA +6.66%). Retailers Lowe's (LOW -1.88%) and AutoZone (AZO -3.53%) both lost ground after their earnings news. Macy's (M +5.13%) reported earnings and posted a solid gain in response.
Target (TGT -0.59%), TJX (TJX -0.09%), Petco Health and Wellness (WOOF -5.04%), and Williams-Sonoma (WSM -0.69%) each report earnings in front of Wednesday's open.
The 2-yr note yield settled one basis point 4.83% and the 10-yr note yield fell two basis points today to 4.41%. |
 Kenneth J. Gruneisen started out as a licensed stockbroker in August 1987, a couple of months prior to the historic stock market crash that took the Dow Jones Industrial Average down -22.6% in a single day. He has published daily fact-based fundamental and technical analysis on high-ranked stocks online for two decades. Through FACTBASEDINVESTING.COM, Kenneth provides educational articles, news, market commentary, and other information regarding proven investment systems that work in good times and bad.
Comments contained in the body of this report are technical opinions only and are not necessarily those of Gruneisen Growth Corp. The material herein has been obtained from sources believed to be reliable and accurate, however, its accuracy and completeness cannot be guaranteed. Our firm, employees, and customers may effect transactions, including transactions contrary to any recommendation herein, or have positions in the securities mentioned herein or options with respect thereto. Any recommendation contained in this report may not be suitable for all investors and it is not to be deemed an offer or solicitation on our part with respect to the purchase or sale of any securities. |
|
 |
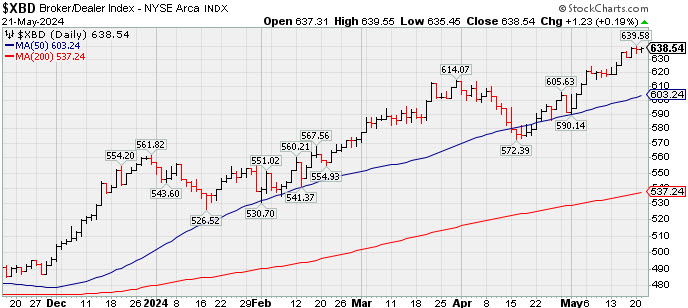
Small Gains Helped Financial Indexes Stand Out
Kenneth J. Gruneisen - Passed the CAN SLIM® Master's Exam
The Bank Index ($BKX +1.05%) outpaced the Broker/Dealer Index ($XBD +0.19%) as the Financials were standouts on an otherwise sluggish session. The Retail Index ($RLX -0.36%) lost some ground. The Networking Index ($NWX -1.24%) led the tech sector lower while the Semiconductor Index ($SOX-0.31%) and the Biotech Index ($BTK -0.20%) both posted smaller losses. Commodity-linked groups had a slightly negative bias as the Gold & Silver Index ($XAU -0.57%), Oil Services ($OSX -0.35%) and the Integrated Oil Index ($XOI -0.38%) each lost a little ground.
![]() PICTURED: The Broker/Dealer Index ($XBD +0.19%) inched higher while recently hitting new all-time highs.
| Oil Services |
$OSX |
88.32 |
-0.31 |
-0.35% |
+5.29% |
| Integrated Oil |
$XOI |
2,097.97 |
-7.93 |
-0.38% |
+12.64% |
| Semiconductor |
$SOX |
5,074.40 |
-15.96 |
-0.31% |
+21.53% |
| Networking |
$NWX |
806.61 |
-10.17 |
-1.24% |
-3.15% |
| Broker/Dealer |
$XBD |
638.54 |
+1.23 |
+0.19% |
+14.58% |
| Retail |
$RLX |
4,382.59 |
-15.99 |
-0.36% |
+12.70% |
| Gold & Silver |
$XAU |
150.50 |
-0.86 |
-0.57% |
+19.74% |
| Bank |
$BKX |
106.94 |
+1.12 |
+1.05% |
+11.37% |
| Biotech |
$BTK |
5,271.89 |
-10.39 |
-0.20% |
-2.71% |
|
|
|
 |
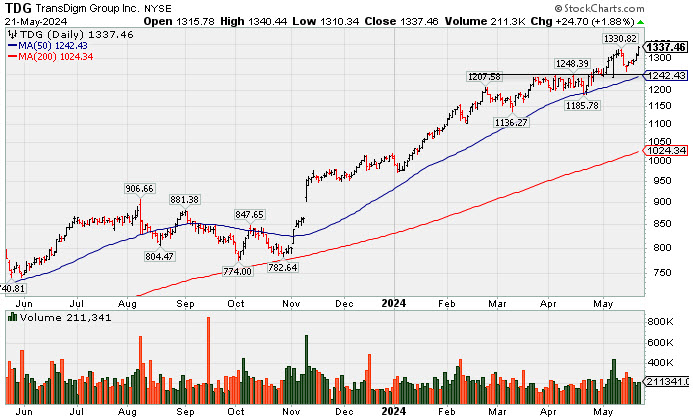
Aerospace/Defense Firm Hitting Another All-Time High
Kenneth J. Gruneisen - Passed the CAN SLIM® Master's Exam
Transdigm Group Inc (TDG +$24.08 or +1.83% to $1,336.84) posted a 3rd consecutive gain today with average volume. It is extended from any sound base and its 50-day moving average DMA line ($1,242) defines near-term support to watch on pullbacks. TDG was last shown in this FSU section on 4/30/24 with an annotated graph under the headline, "Found Support at 50-Day Moving Average Line and Hit New High".
TDG reported Mar '24 quarterly earnings +34% on +21% sales revenues versus the year-ago period, its 12th consecutive comparison above the +25% minimum earnings guideline (C criteria). Growth has been very strong after a downturn in FY '20 and '21 (A criteria) hurt its earnings track record. It has a 92 Earnings Per Share Rating.
The number of top-rated funds owning its shares rose from 1,332 in Dec '22 to 1,567 in Mar '24, a reassuring trend concerning the I criteria. Its small supply of 53.4 million shares (S criteria) in the public float can contribute to greater price volatility in the event of institutional buying or selling. It has a Timeliness Rating of A and an Accumulation/Distribution rating of C. |
|
|
Color Codes Explained :
Y - Better candidates highlighted by our
staff of experts.
G - Previously featured
in past reports as yellow but may no longer be buyable under the
guidelines.
***Last / Change / Volume data in this table is the closing quote data***
Symbol/Exchange
Company Name
Industry Group |
PRICE |
CHANGE
(%Change) |
Day High |
Volume
(% DAV)
(% 50 day avg vol) |
52 Wk Hi
% From Hi |
Featured
Date |
Price
Featured |
Pivot Featured |
|
Max Buy |
 TDG
-
NYSE
TDG
-
NYSE
TransDigm Group
Aerospace/Defense
|
$1,336.84
|
+24.08
1.83% |
$1,340.76
|
212,405
105.15% of 50 DAV
50 DAV is 202,000
|
$1,330.82
0.45%
|
4/12/2024
|
$1,224.21
|
PP = $1,246.32
|
|
MB = $1,308.64
|
 Most Recent Note - 5/21/2024 6:10:58 PM
G - Posted a 3rd consecutive gain today with average volume while hitting another new all-time high. It is extended from any sound base and its 50 DMA line ($1,242) defines near-term support to watch on pullbacks. Reported Mar '24 quarterly earnings +34% on +21% sales revenues versus the year-ago period. See the latest FSU analysis for more details and a new annotated graph.
>>> FEATURED STOCK ARTICLE : Aerospace/Defense Firm Hitting Another All-Time High - 5/21/2024 |
View all notes |
Set NEW NOTE alert |
Company Profile |
SEC
News |
Chart |
Request a new note
C
A
S
I |
USLM
-
NASDAQ
U.S. Lime & Minerals
Bldg-Cement/Concrt/Ag
|
$361.99
|
-1.11
-0.31% |
$364.68
|
25,424
94.16% of 50 DAV
50 DAV is 27,000
|
$378.78
-4.43%
|
2/9/2024
|
$254.68
|
PP = $265.09
|
|
MB = $278.34
|
Most Recent Note - 5/21/2024 12:24:25 PM
G - Pulling back today for a 5th consecutive small loss without heavy volume. Stubbornly holding its ground following noted volume-driven gains into new all-time high territory. Its 50 DMA line ($316.67) defines important near-term support to watch on pullbacks. Fundamentals remain strong.
>>> FEATURED STOCK ARTICLE : Stubbornly Held Ground and Posted Quiet Gain for Best-Ever Close - 5/14/2024 |
View all notes |
Set NEW NOTE alert |
Company Profile |
SEC
News |
Chart |
Request a new note
C
A
S
I |
CLS
-
NYSE
Celestica
Elec-Contract Mfg
|
$52.64
|
-0.03
-0.06% |
$52.83
|
1,034,126
45.28% of 50 DAV
50 DAV is 2,284,000
|
$53.01
-0.70%
|
5/15/2024
|
$51.52
|
PP = $51.22
|
|
MB = $53.78
|
Most Recent Note - 5/20/2024 5:18:46 PM
Y - Posted a gain today with below average volume for a best-ever close. Finished strong after highlighted in yellow in the 5/15/24 mid-day report with pivot point cited based on its 4/04/24 high plus 10 cents after a 6-week flat base. On pullbacks prior highs in the $51 area define initial support to watch above its 50 DMA line ($46.10).
>>> FEATURED STOCK ARTICLE : Strong Breakout After 6-Week Flat Base - 5/15/2024 |
View all notes |
Set NEW NOTE alert |
Company Profile |
SEC
News |
Chart |
Request a new note
C
A
S
I |
AROC
-
NYSE
Archrock
OilandGas-Machinery/Equip
|
$21.02
|
-0.30
-1.41% |
$21.61
|
1,562,650
107.62% of 50 DAV
50 DAV is 1,452,000
|
$21.42
-1.87%
|
5/20/2024
|
$21.23
|
PP = $21.50
|
|
MB = $22.58
|
Most Recent Note - 5/21/2024 6:13:27 PM
Y - There was a "negative reversal" and it closed near the session low today after hitting new multi-year highs. Color code was changed to yellow with pivot point cited based on its 4/04/24 high plus 10 cents in the 5/20/24 mid-day report - <i>"Found support above its 50 DMA line during an orderly 6-week flat base. Subsequent gains above the pivot point backed by at least +40% above average volume may trigger a technical buy signal. Earnings increases have been above the +25% mninimum guideline in quarterly comparisons through Mar '24 versus the year-ago periods. Annual earnings (A criteria) growth has been strong after a loss in FY '20."</i>
>>> FEATURED STOCK ARTICLE : Strong Finish for Archrock After Highlighted in Mid-Day Report - 5/20/2024 |
View all notes |
Set NEW NOTE alert |
Company Profile |
SEC
News |
Chart |
Request a new note
C
A
S
I |
|
|
|
THESE ARE NOT BUY RECOMMENDATIONS!
Comments contained in the body of this report are technical
opinions only. The material herein has been obtained
from sources believed to be reliable and accurate, however,
its accuracy and completeness cannot be guaranteed.
This site is not an investment advisor, hence it does
not endorse or recommend any securities or other investments.
Any recommendation contained in this report may not
be suitable for all investors and it is not to be deemed
an offer or solicitation on our part with respect to
the purchase or sale of any securities. All trademarks,
service marks and trade names appearing in this report
are the property of their respective owners, and are
likewise used for identification purposes only.
This report is a service available
only to active Paid Premium Members.
You may opt-out of receiving report notifications
at any time. Questions or comments may be submitted
by writing to Premium Membership Services 665 S.E. 10 Street, Suite 201 Deerfield Beach, FL 33441-5634 or by calling 1-800-965-8307
or 954-785-1121.
|
|
|